4458
Quantitative analysis of ultra-fast DCE-MRI to identify vascular inputs and outputs in breast tumors1Department of Biomedical Engineering, the University of Texas at Austin, Austin, TX, United States, 2Department of Radiology, University of Chicago, Chicago, IL, United States
Synopsis
Identifying and characterizing vascular inputs and outputs in tumors would be useful in both the diagnostic and prognostic settings. In this contribution, we propose a novel methodology that combines vessel detection with analysis of ultra-fast DCE-MRI data to integrate both morphological and functional information of tumor associated vessels to identify those that serve as inputs and outputs to breast tumors.
Introduction
Analysis of vascular inputs and outputs in tumors could significantly enhance diagnostic and prognostic accuracy1,2. However, most previous studies on tumor associated vessels are based on x-ray computed tomography or magnetic resonance angiography, which only report on morphology. Conversely, dynamic contrast enhanced MRI (DCE-MRI) can provide information regarding tissue physiological properties, including perfusion, permeability, and microvasculature distribution3,4, as well as enhanced anatomical structure. In particular, recent studies have shown that ultra-fast DCE-MRI may be useful for discriminating benign from malignant lesions5. In addition, ultrafast DCE-MRI can accurately track propagation of the contrast media bolus through blood vessels, and has the potential to evaluate the vasculature associated with breast tumors6. Thus, combining tumor vascular inputs and outputs detection with ultra-fast DCE-MRI analysis of lesion pharmacokinetics has the advantage of integrating both morphological and functional information of tumor associated vessels.Methods
Data Acquisition
Images were acquired on a Philips Achieva 3T-TX with a 16-channel bilateral breast coil and a 3D spoiled gradient recalled echo protocol consisting of 19 fat-suppressed, fast acquisitions after the injection of contrast media (0.1 mM/kg MultiHance) followed by four fat-suppressed "standard" acquisitions. Temporal resolution for the fast scans was 3.5 s, with spatial resolution of 1.5*1.5*4 mm3 with a SENSE factor of 4 in the right-left direction and 2 in the foot-head direction, and partial Fourier factor of 0.7 (in both ky and kz). Temporal resolution of the standard protocol was 55 s and spatial resolution of 0.8*0.8*1.6 mm3, SENSE of 2.5 in RL and partial Fourier of 0.85 in ky.
Data Analysis
An S-shaped intensity transfer function7 was first applied on the subtraction of the pre- and post-contrast, high-spatial resolution images to enhance the foreground structure while suppressing background noise. Segmentation of the vasculature from the surrounding tissue was then performed by applying a Hessian filter to the enhanced image, to generate a map of “vesselness”8, which represents the probability for each voxel to belong to a vessel. Then a two-class k-means clustering algorithm was used for classifying voxels into vascular and non-vascular regions. The resulting vascular mask was subsequently directionally dilated to fill obvious gaps between vessel segments yielding vascular trees which were then skeletonized (i.e., thinning to their centerlines). Finally, individual vessels, branching-points, and isolated end-points of the vascular trees were identified.
Based on the 3D reconstruction of vasculature, the “tumor-leading vessels” (i.e., those vessels physically connected to the tumor) were identified. Two possible situations of “tumor-leading vessels” were considered: 1) the vessels directly touching the tumor, and 2) vessels separating into multiple small branches near the tumor. For the latter vessels, we computed the lowest-cost paths from the termination of the vessel segment to all other vessels as well as the edge of lesion. If the lowest-cost path led to the lesion, then the vessel would be defined as a “tumor-leading vessel”.
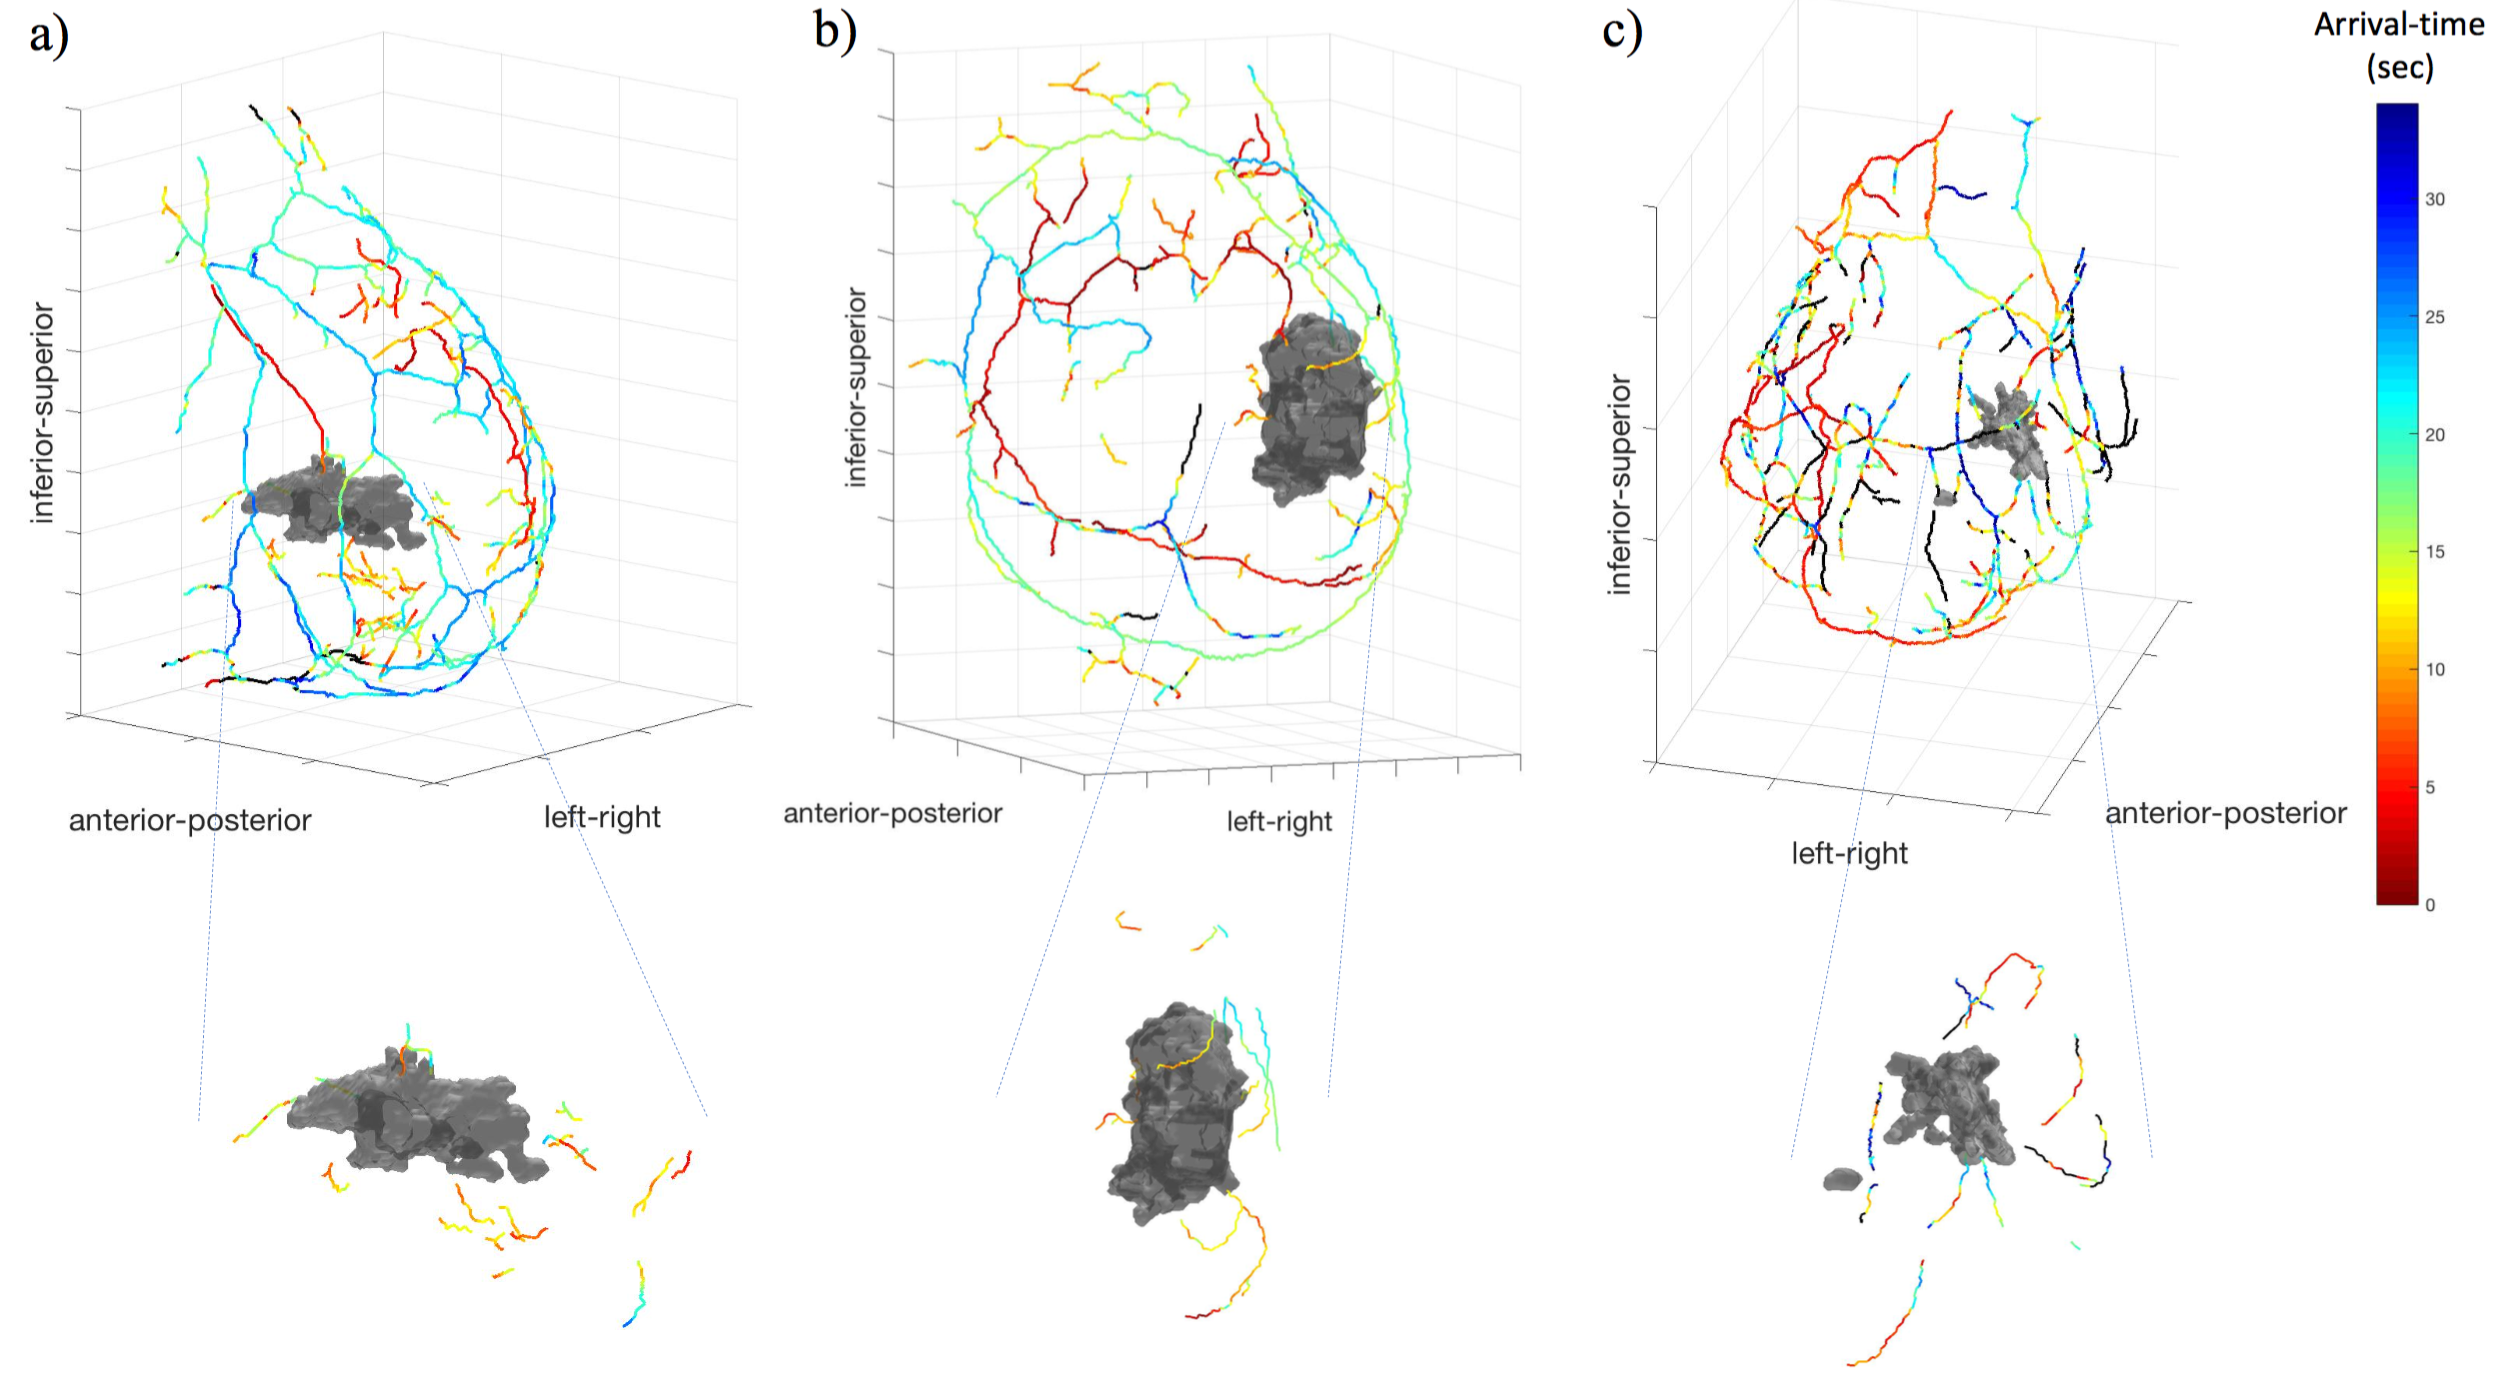
The set of tumor-leading vessels were then characterized using information from the ultra-fast DCE-MRI series. Specifically, we color-coded the vessels according to the bolus arrival-time estimate to establish the temporal and spatial relationship between input and output vessels. Then we defined vascular voxels with the lowest 5% arrival-time as “input vessels”, and voxels with the highest 5% arrival-time as “output vessels”, allowing the estimation of the lesion input and output functions (LIF and LOF), respectively.
Results
Figure 1 displays a 3D reconstruction of breast vasculature for three patients; patients #1 and #2 have malignant lesions, while patient #3 has a benign lesion. The segmented vessels are color-coded by bolus arrival-time. For patients #1, #2 and #3, 14, 16 and 12, respectively, “tumor-leading vessels” are identified.
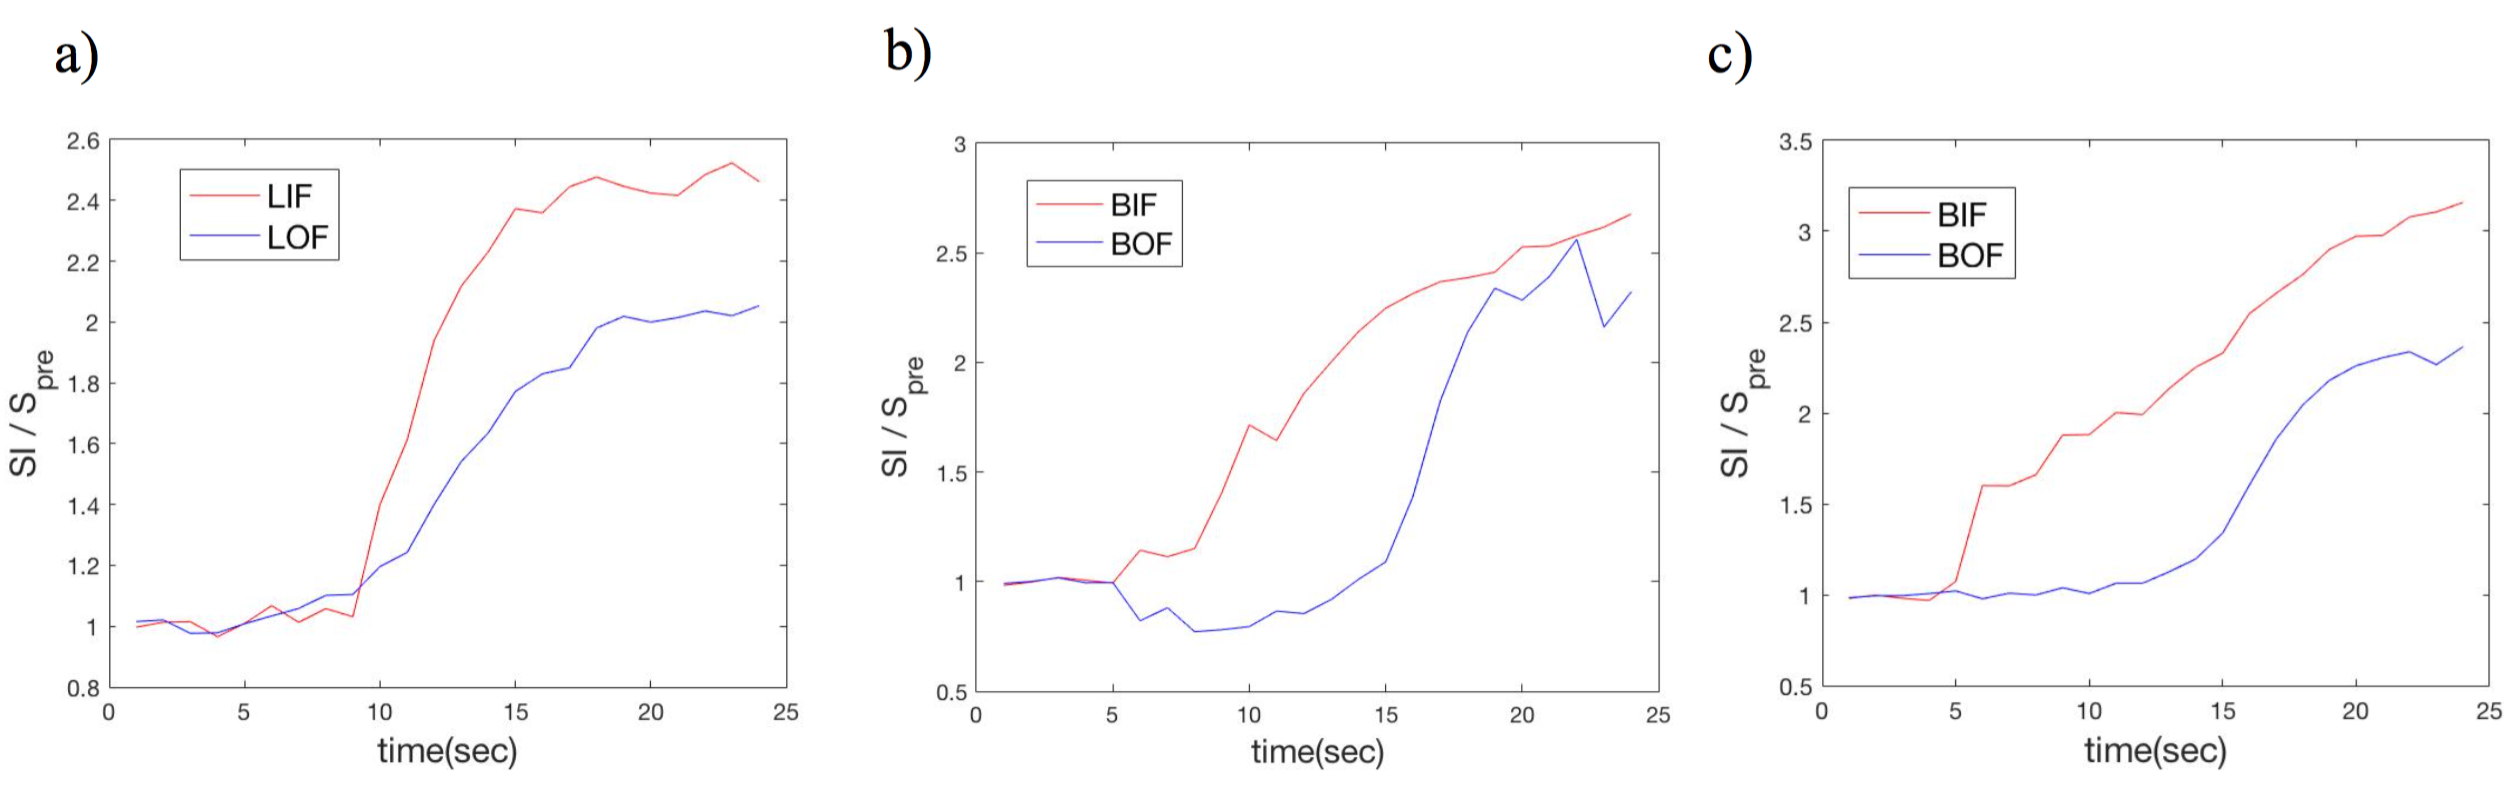
Figure 2a shows the averaged LIF and LOF of the patients depicted in panels a) and b) of Figure 1. For comparison, the calculation was also applied to the whole breast vasculature to generate breast input and output functions (BIF and BOF, respectively) in ipsilateral (Figure 2b) and contralateral breasts (Figure 2c). In general, the BIF/LIF show earlier, higher enhancement than the BOF/LOF.
Discussion and Conclusion
Breast vasculature and tumor-leading vessels can be
detected and characterized using the proposed methodology, thereby providing an
opportunity to evaluate vascular inputs and outputs of breast tumors. Additionally,
morphological features like tortuosity of tumor-leading vessels can be
obtained. Regions of the tumor that are proximal to input vessels can be studied
to evaluate the vascular patterns at the point of contract between vessels and
tumor. We are currently implementing the above analyses on a larger patient
data set (n = 13), to determine if these vascular metrics can assist in
reliably differentiating benign from malignant lesions.Acknowledgements
NCI U01CA142565, CPRIT RR160005, 1 R01 CA218700-01References
1. Hu, Hai-Jing, Yong-Wen Huang, and Ying-Chang Zhu. "Tumor feeding artery reconstruction with multislice spiral CT in the diagnosis of pelvic tumors of unknown origin." Diagnostic and Interventional Radiology 20.1 (2014): 9.
2. Kamitani, Takeshi, et al. "Feeding Arteries of Primary Tongue Cancers on Intra-arterial Infusion Chemotherapy." Cardiovascular and interventional radiology 39.2 (2016): 227-232.
3. Mann, Ritse M., et al. "Breast MRI: guidelines from the European society of breast imaging." European radiology 18.7 (2008): 1307-1318.
4. Yankeelov, Thomas E., Thomas E. Pickens, and David R. Price. Quantitative MRI in cancer. Taylor & Francis, 2011.
5. Abe, Hiroyuki, et al. "Kinetic analysis of benign and malignant breast lesions with ultrafast dynamic contrast-enhanced MRI: comparison with standard kinetic assessment." American Journal of Roentgenology 207.5 (2016): 1159-1166.
6. Onishi, Natsuko, et al. "Ultrafast dynamic contrast‐enhanced mri of the breast using compressed sensing: breast cancer diagnosis based on separate visualization of breast arteries and veins." Journal of Magnetic Resonance Imaging (2017).
7. Yu, Zeyun, and Chandrajit Bajaj. "A fast and adaptive method for image contrast enhancement." Image Processing, 2004. ICIP'04. 2004 International Conference on. Vol. 2. IEEE, 2004.
8. Wang, Lei, et al. "Segmentation of hepatic artery in multi-phase liver CT using directional dilation and connectivity analysis." Medical Imaging 2016: Computer-Aided Diagnosis. Vol. 9785. International Society for Optics and Photonics, 2016.
Figures