4454
Feasibility of multispectral spin echo breast quantitative susceptibility mapping: an alternative to post-biopsy mammogram after MR-guided breast biopsy1Weill Cornell Medicine, New York, NY, United States
Synopsis
During MR-guided breast biopsy, a titanium biopsy marker is deployed in the biopsy cavity to mark the spot. Conventional MR cannot distinguish between these markers and the pockets of air that are often introduced during the biopsy, necessitating a subsequent mammogram to confirm biopsy marker location. Our goal is to replace post-biopsy mammogram with a short MR protocol leveraging the difference in magnetic susceptibility between titanium and air in order to distinguish them as sources of MR signal voids. To this end, we generate quantitative susceptibility maps (QSM) using 3D fast spin echo acquired at four frequency offsets.
Introduction
More than 1.6 million breast biopsies are performed each year, a growing number of which are under MR-guidance. After MR-guided tissue sampling and while the patient is still in the MR scanner, a small titanium marker is deployed into the biopsy cavity. Conventional MR sequences cannot distinguish the titanium marker from surrounding air that is often introduced into the breast during the biopsy, since they both appear as signal voids. As such, it is standard of care to obtain a two view post-biopsy mammogram, ensuring that the biopsy marker is in the correct location. We propose using MR to distinguish titanium and air by exploiting their different magnetic susceptibilities (titanium: 182ppm, air: 9ppm). Commonly used multiecho gradient echo-based quantitative susceptibility mapping (QSM) methods fail; titanium induces marked magnetic field inhomogeneity, corrupting any effort to estimate the field map in the vicinity of the biopsy marker. In this abstract, we demonstrate the feasibility of using a multispectral spin echo QSM approach[1] for replacing the post-biopsy mammogram.
Methods
Phantom
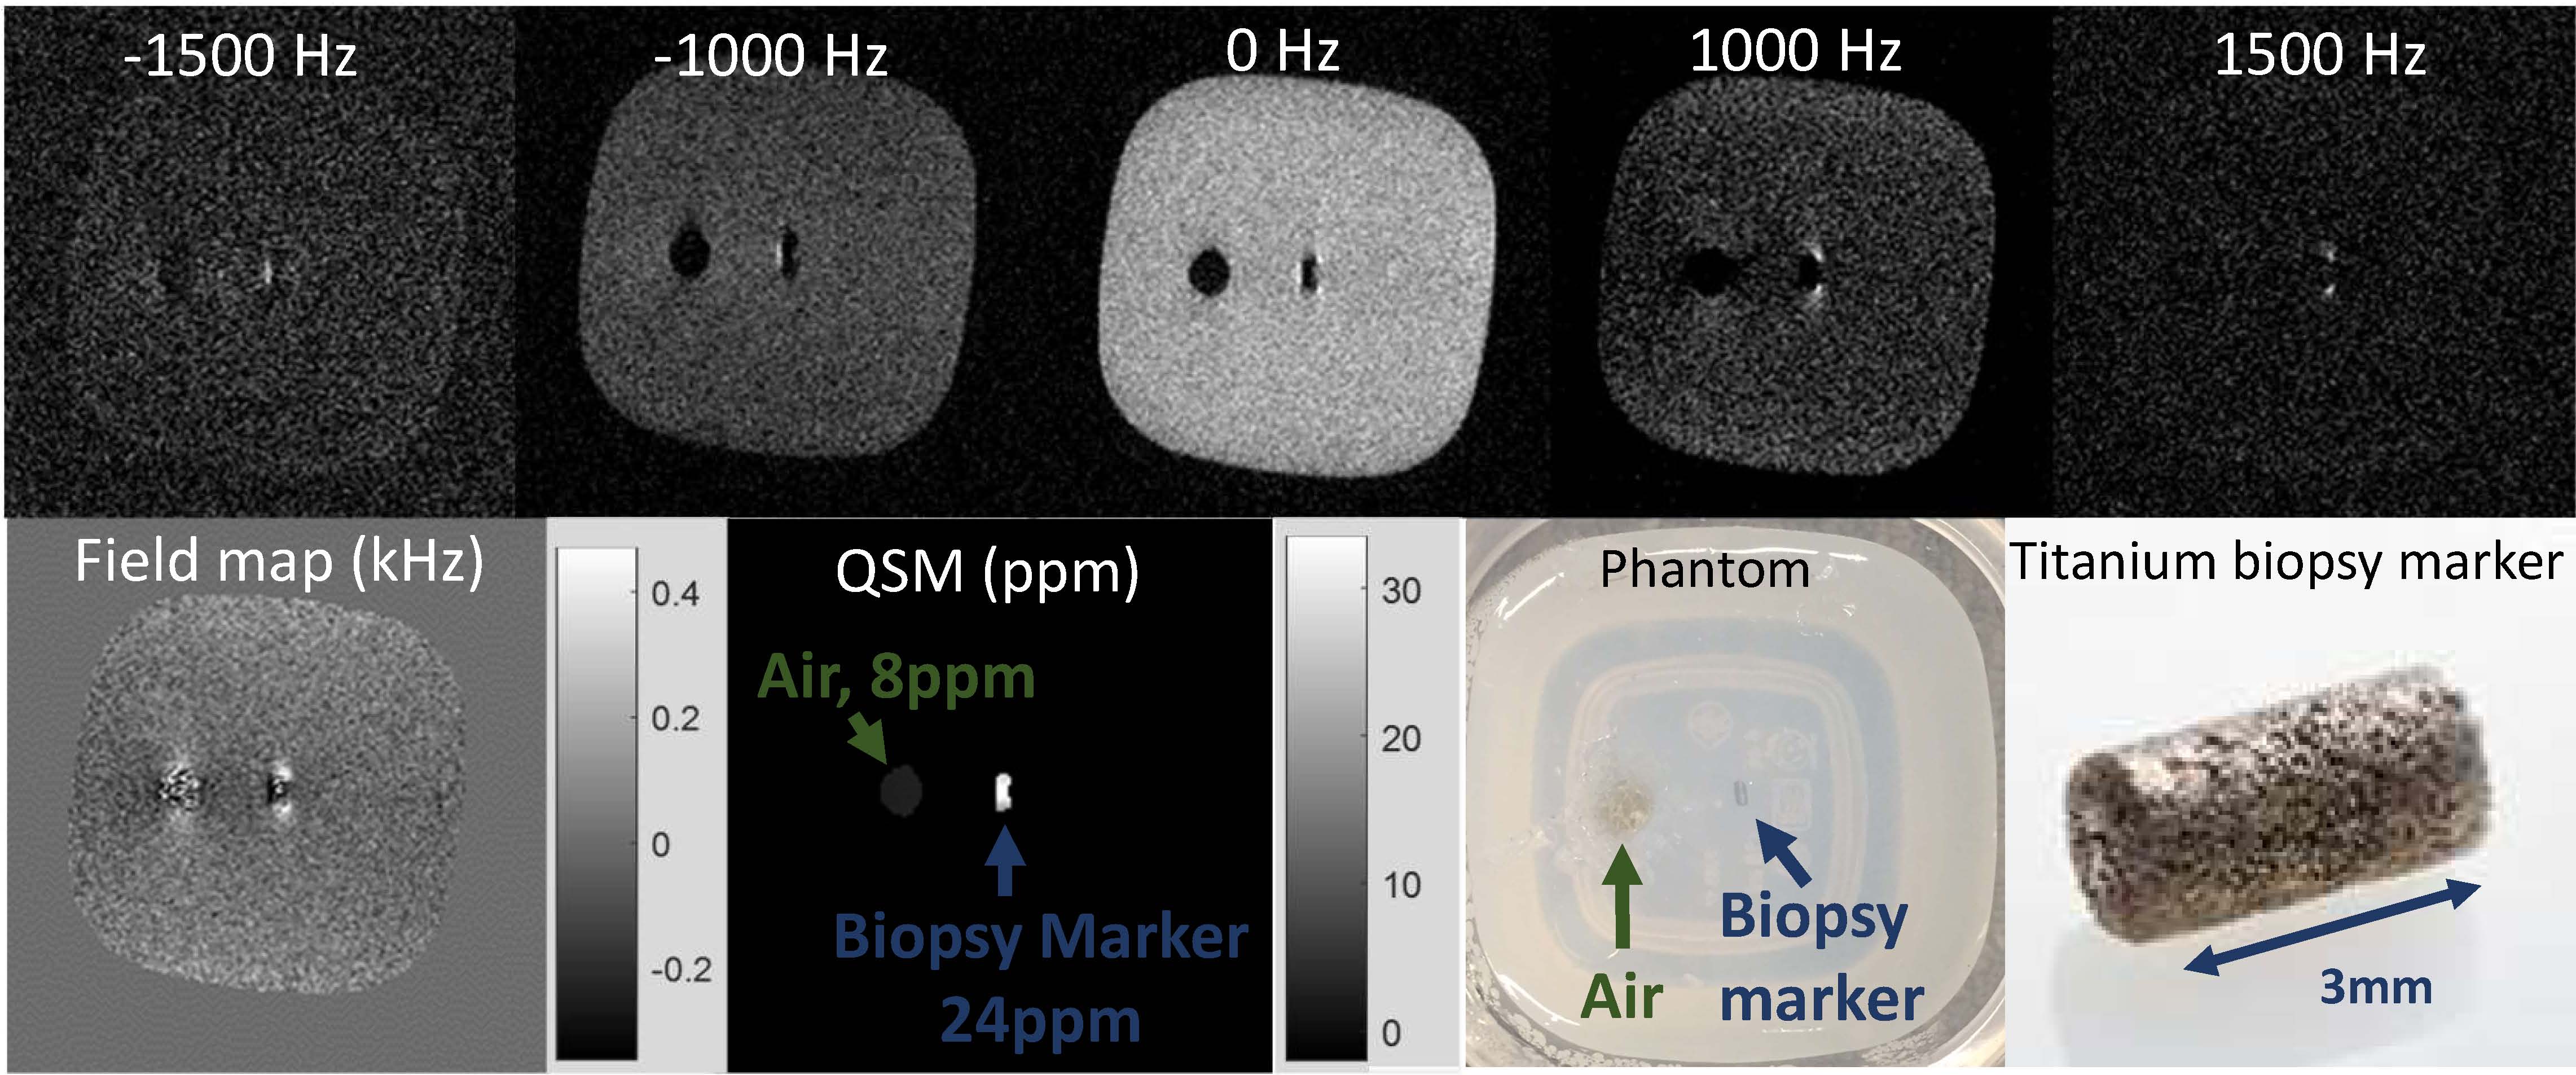
A breast biopsy phantom was constructed by embedding a 1x1x3 mm titanium TriMark biopsy site marker (Hologic) into a 4oz container of 1% agarose gel. Adjacent to the biopsy marker, an air cavity (diameter ~ 5mm) was created to simulate air introduced into the biopsy cavity during the procedure. The phantom was scanned on a 1.5 T GE scanner using a 2-channel breast biopsy coil. A 3D fast spin echo sequence using a gaussian RF pulse was acquired at five different frequency offsets between -1500 and +1500 Hz. Matrix size: 256x256x16. Voxel size: 0.8x0.8x2mm. TR/TE/ETL: 900/17/32. NEX 1. Receiver bandwidth: 125kHz. Field map images were generated using a dictionary matching approach [1]. QSM images were reconstructed using the nonlinear morphology enabled dipole inversion method[2-6]. Magnitude images were thresholded to create a mask of the signal void regions; QSM was generated only for voxels within those regions[1].
Patients
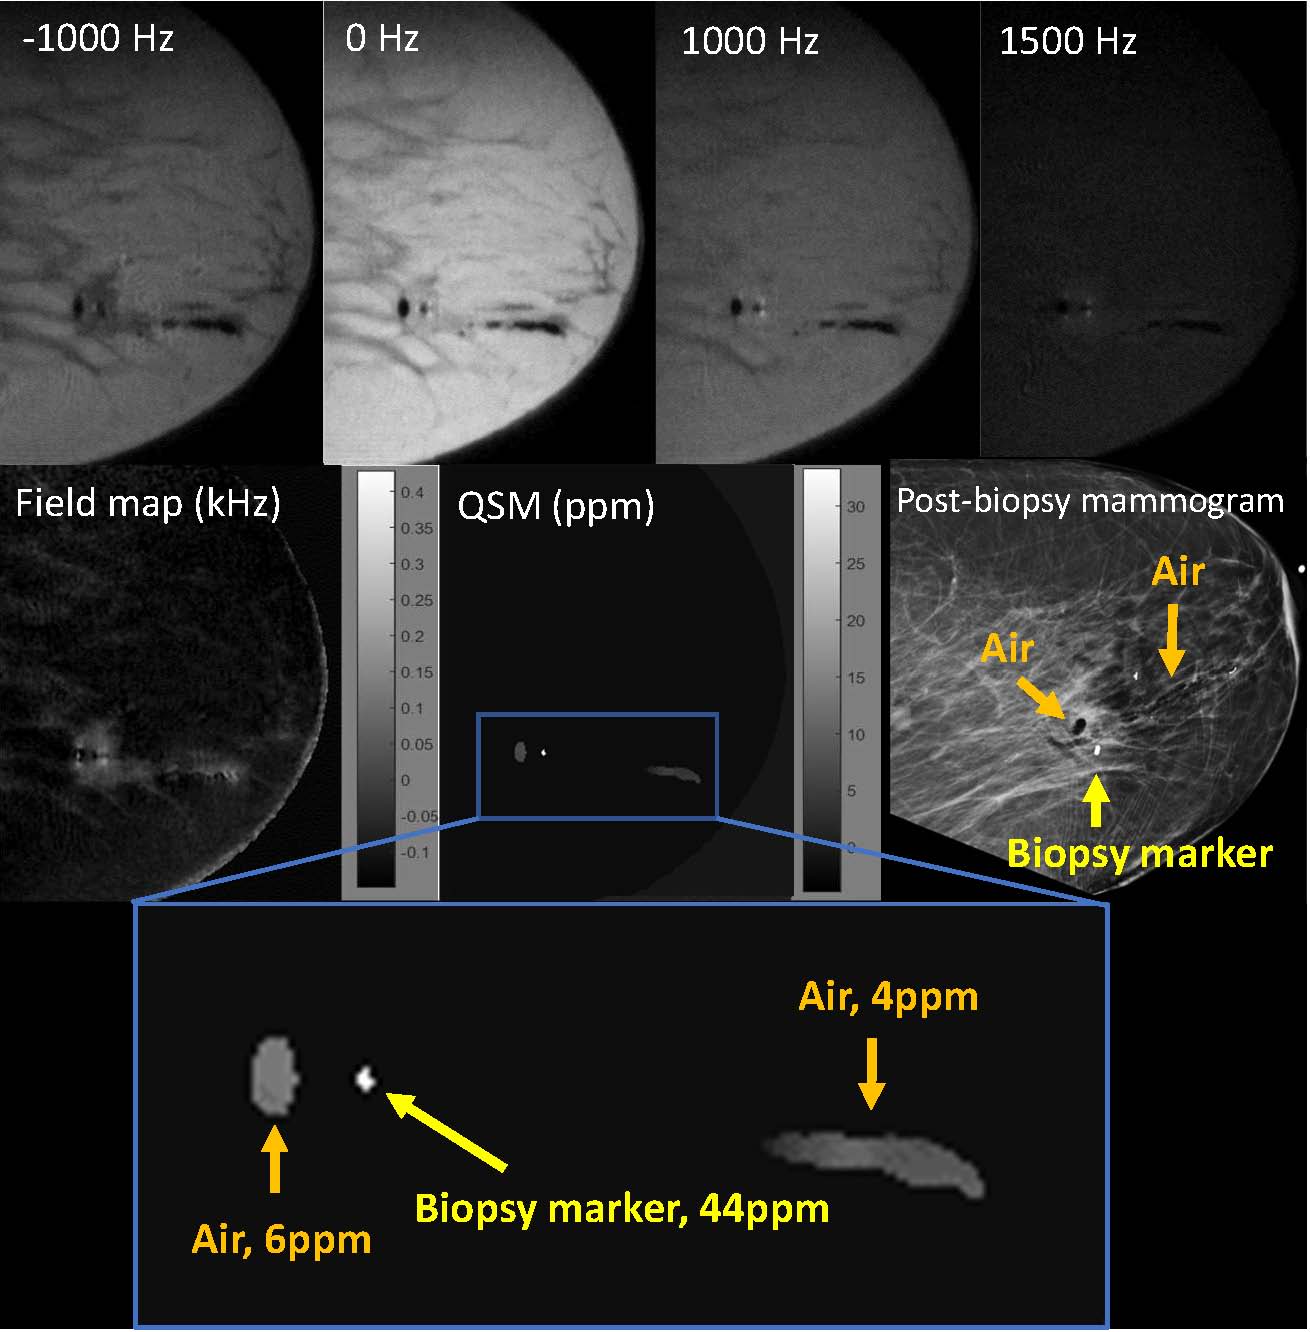
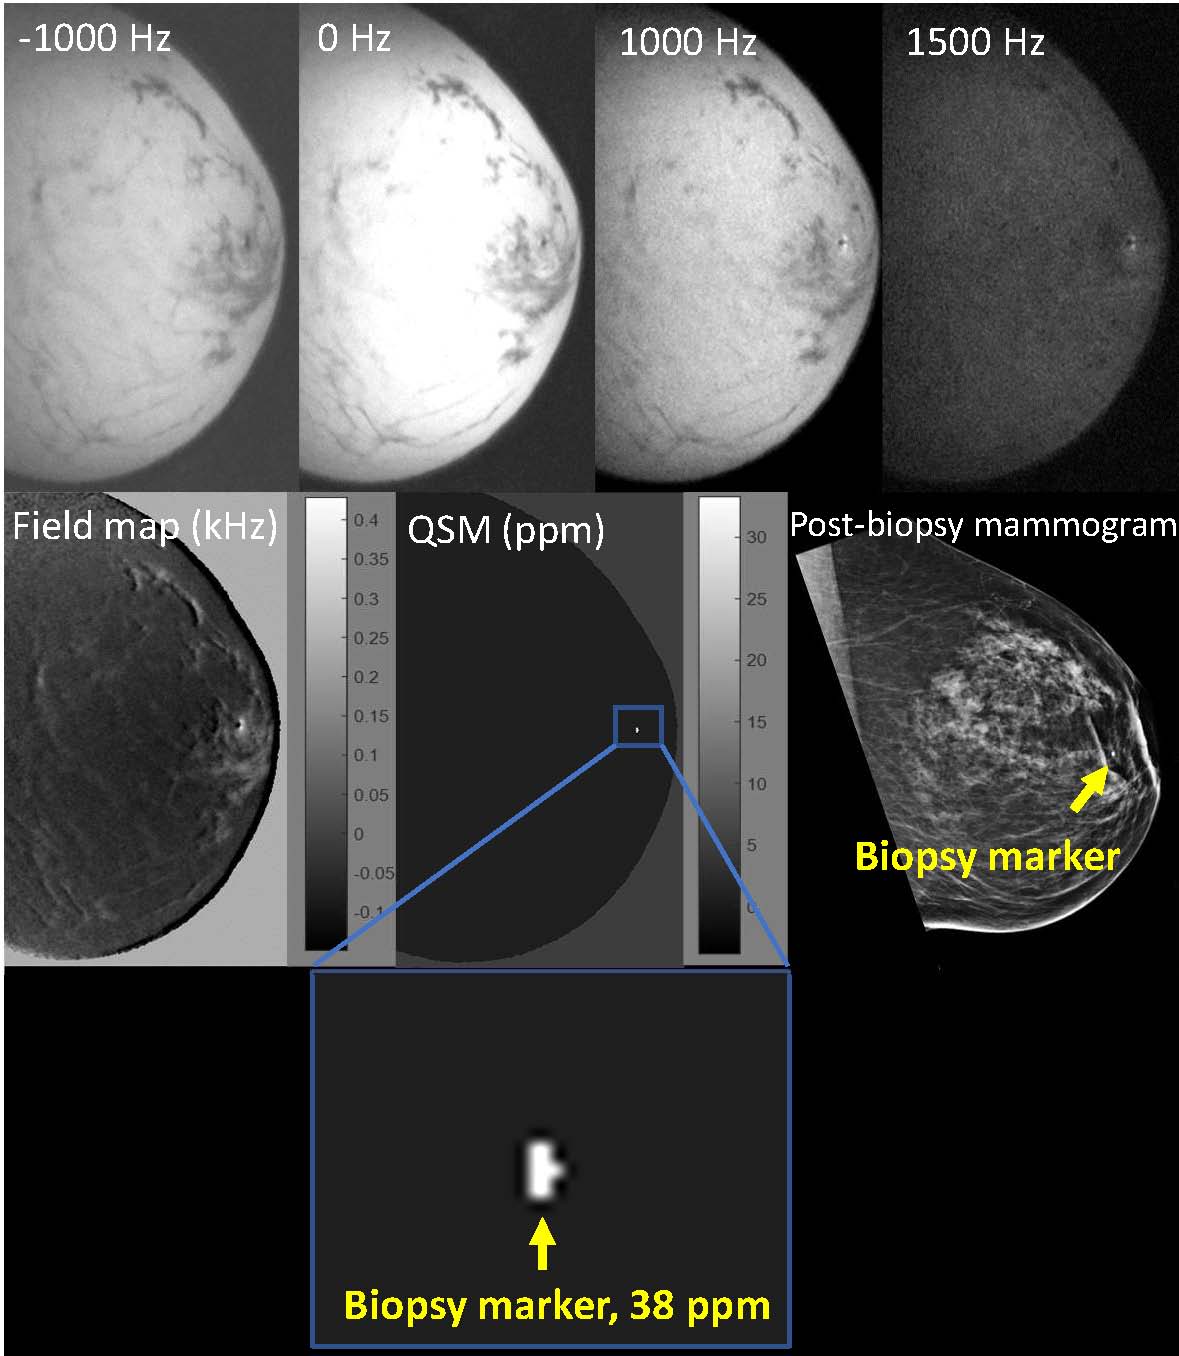
Five patients undergoing MR guided breast biopsy were included in this study. After deployment of the biopsy marker, patients were imaged as described above. A 3D fast spin echo sequence using a gaussian RF pulse was acquired at four different frequency offsets between -1000 and +1500 Hz. Receiver bandwidth ranged from 83-125 kHz. Slice number varied by patient; the minimum number of sagittal slices to cover the biopsy area was prescribed to minimize scan time. Other parameters were identical to phantom parameters listed above. Scan time ranged from 4-8 minutes. Images were reconstructed as described above. For each patient, the post-biopsy mammogram served as a gold standard for the location of the biopsy marker, and if/where air was present. For each case, voxels above 20 ppm were designated as biopsy marker. The mean and standard deviation of the susceptibility of the biopsy marker and air (if present) were measured.
Results
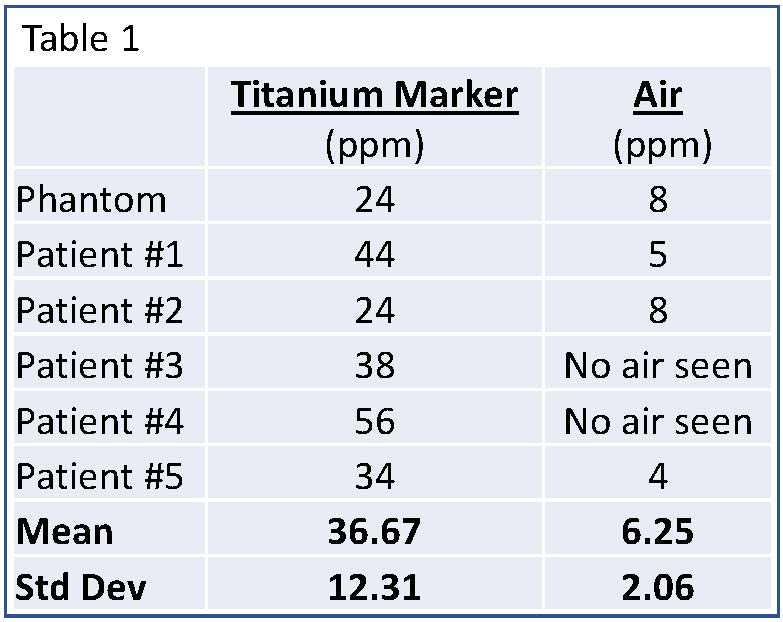
QSM images were successfully generated in the phantom and for all patients. Table 1 lists the mean and standard deviation of the biopsy marker and air for the phantom and all patients. In each case, the biopsy marker was seen as a focus of susceptibility ranging from 24-56 ppm. Air, if present, ranged from 4-8ppm.
Figure 1 displays phantom results. Figure 2 displays results for patient 1. In patients 1, 2, and 5, biopsy markers and adjacent air foci were seen on QSM images in a distribution compatible with the post-biopsy mammogram. Figure 3 displays results for patient 3. In patients 3 and 4, biopsy markers, but not air, were identified on QSM, which was compatible with the post-biopsy mammogram results. All cases were consistent with post-biopsy mammogram results.
Discussion
These preliminary results suggest that multispectral spin echo QSM has the ability to distinguish between a titanium biopsy marker and a pocket of air as the source of signal voids on MR. QSM results were consistent with mammogram findings in all cases.
Replacing mammogram with a short MR protocol could improve the biopsy experience for patients by streamlining and shortening total procedure time, eliminating a separate trip to the mammography department post-biopsy, and avoiding the use of ionizing radiation. Furthermore, while mammogram provides only projectional images, QSM gives cross sectional information, enabling more accurate assessment of biopsy marker location.
These results demonstrate the feasibility of post-biopsy breast QSM, but further research in a larger patient cohort is needed to determine the sensitivity and specificity of this method.
Conclusion
This work demonstrates the feasibility of replacing mammogram with multispectral spin echo QSM after MR-guided breast biopsy. Replacing mammogram with MR would decrease patient inconvenience, provide more precise information about biopsy marker location relative to the biopsied lesion, and eliminate the use of ionizing radiation.Acknowledgements
No acknowledgement found.References
1. Shi, X. et al. Metallic implant geometry and susceptibility estimation using multispectral B0 field maps. Magn Reson Med. June 2017. 77(6): 2302:2413.
2. Liu, T., et al., Nonlinear formulation of the magnetic field to source relationship for robust quantitative susceptibility mapping. Magn Reson Med, 2013. 69(2): p. 467-76.
3. Kressler, B., et al., Nonlinear regularization for per voxel estimation of magnetic susceptibility distributions from MRI field maps. IEEE Transactions on Medical Imaging, 2010. 29.
4. Schweser, F., et al., Quantitative susceptibility mapping for investigating subtle susceptibility variations in the human brain. Neuroimage, 2012. 62(3): p. 2083-100.
5. Shmueli, K., et al., Magnetic susceptibility mapping of brain tissue in vivo using MRI phase data. Magn Reson Med, 2009. 62(6): p. 1510-22.
6. De Rochefort, Ludovic, et al. “Quantitative susceptibility map reconstruction from MR phase data using bayesian regularization: Validation and application to brain imaging. Magn. Reson. Med. 2009. 63: 194-206.
Figures