4453
Magnetization Transfer MRI of Breast Cancer Response to Neoadjuvant Therapy: Preliminary Results1University of Texas at Austin, Austin, TX, United States, 2Texas Oncology, Austin, TX, United States, 3Seton Hospital, Austin, TX, United States, 4Austin Radiological Association, Austin, TX, United States
Synopsis
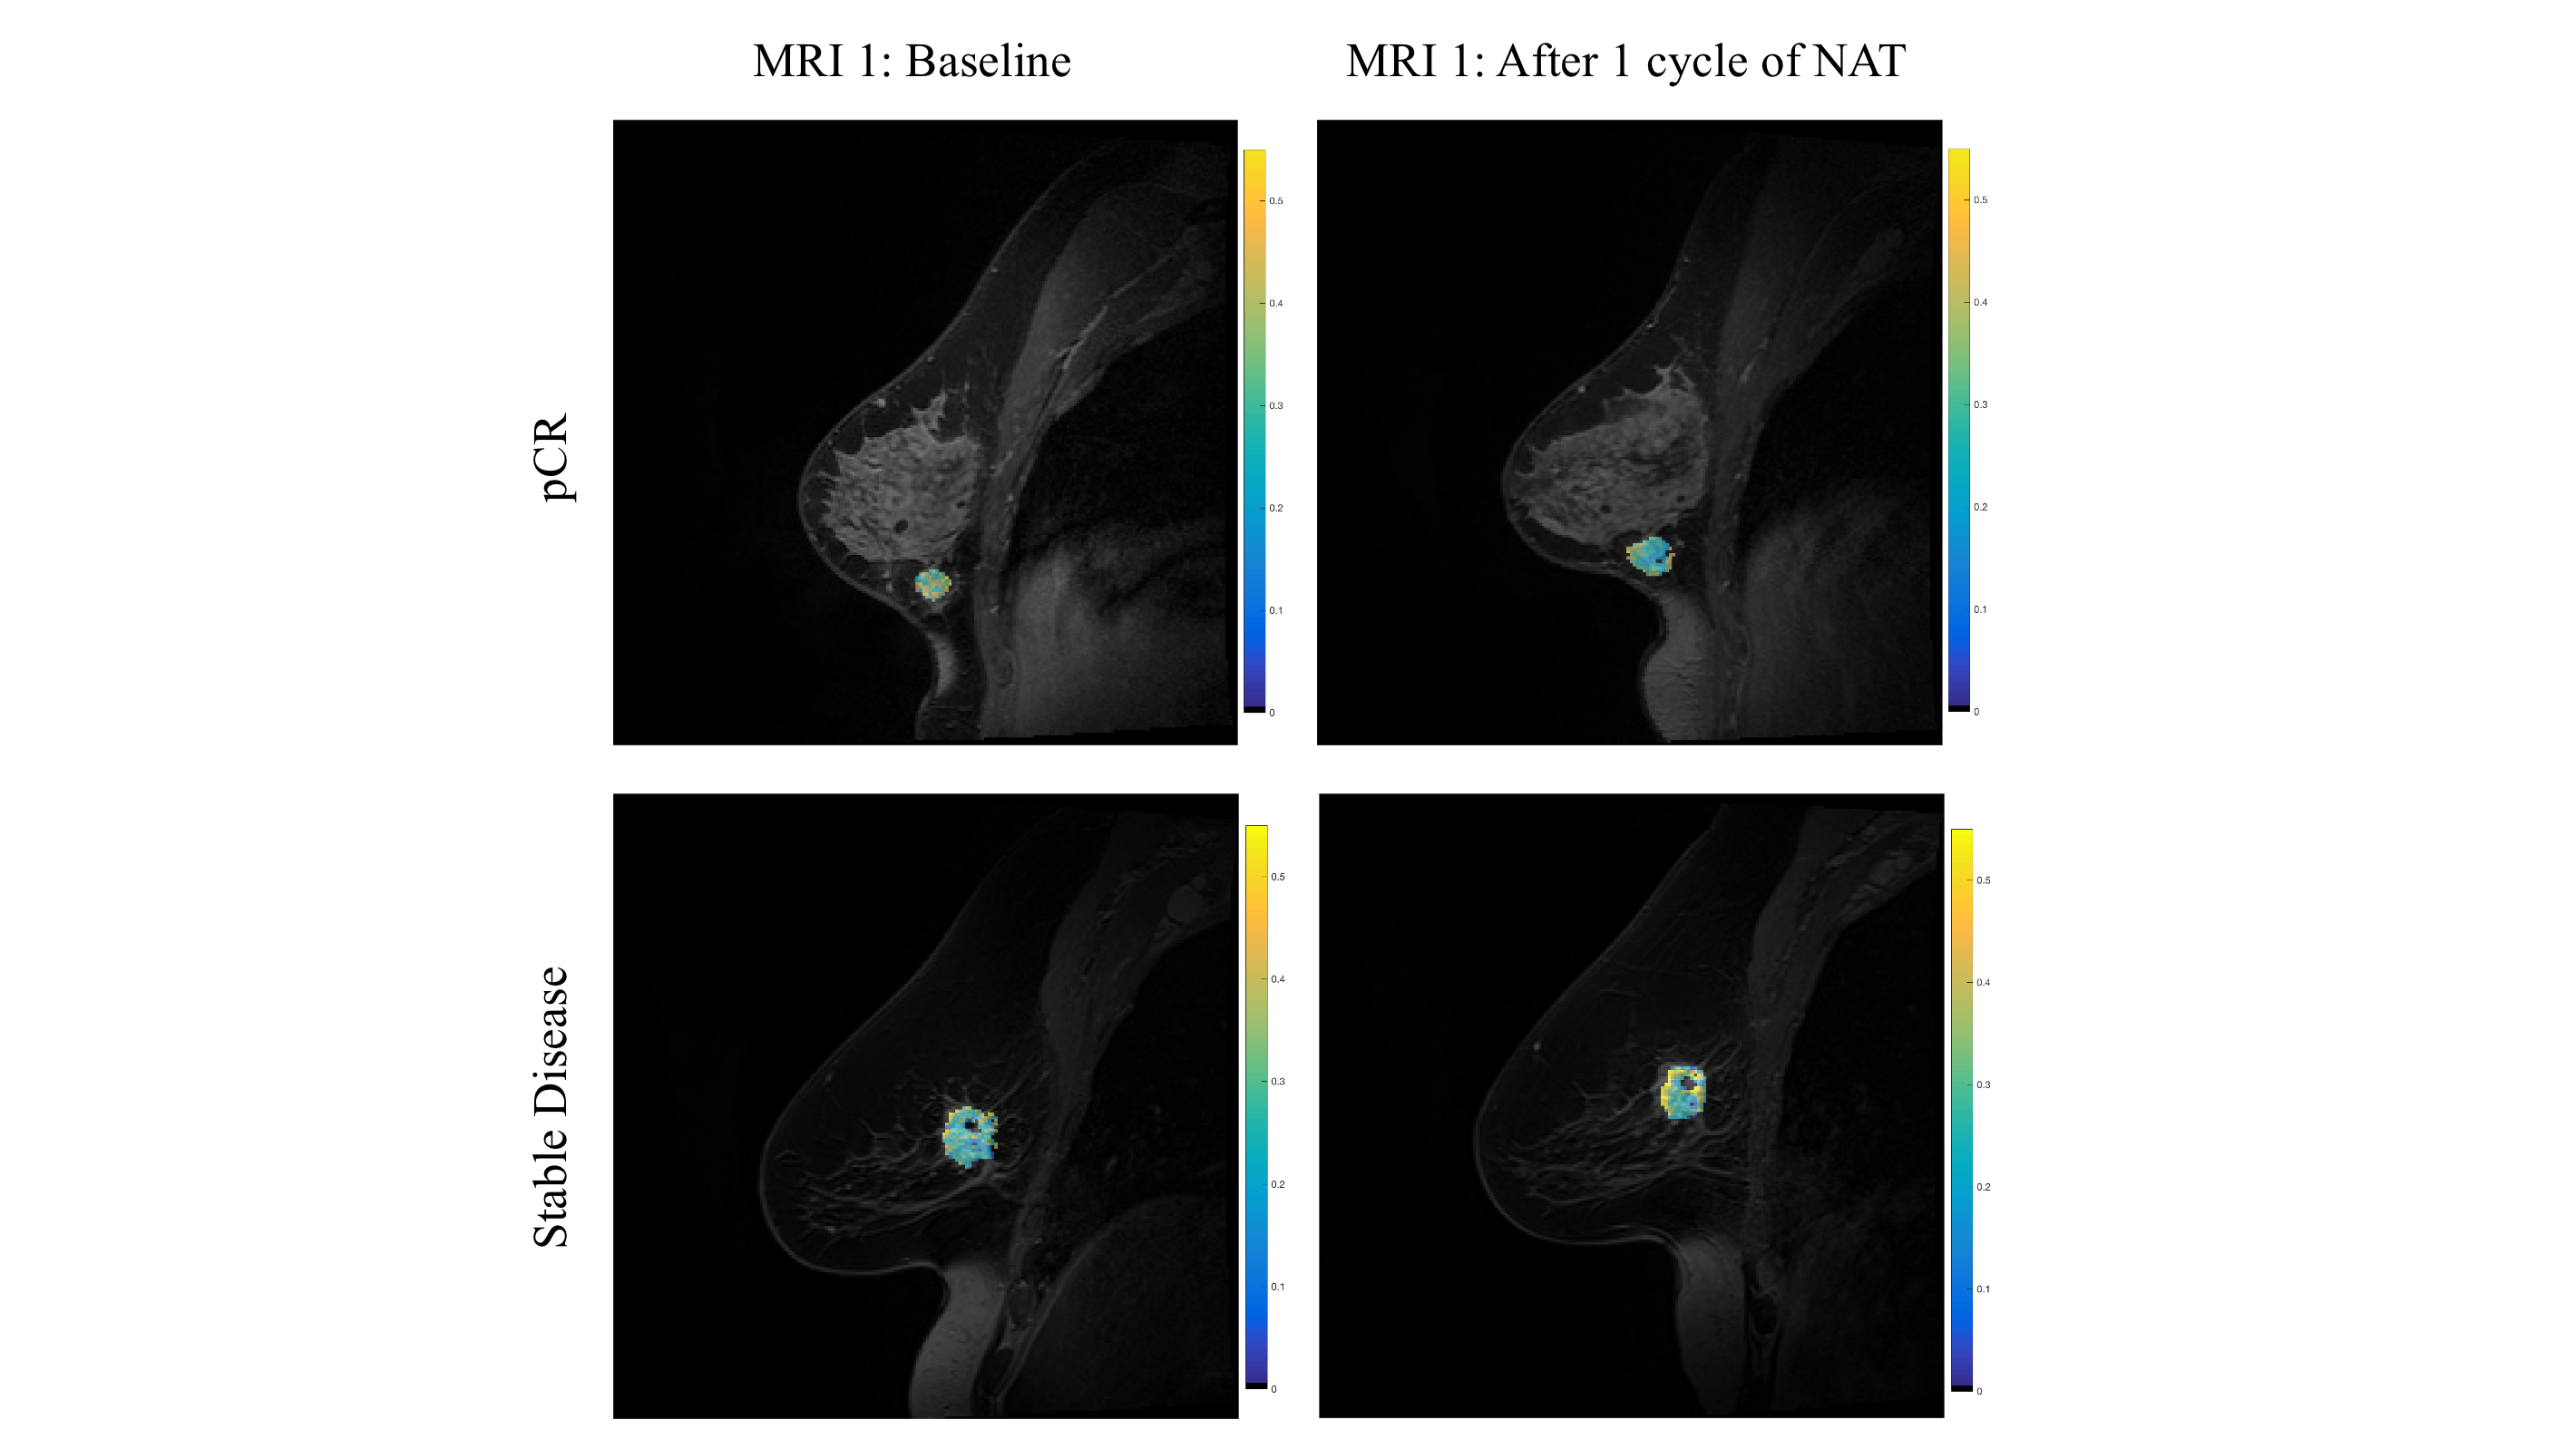
Magnetization transfer MRI (MT-MRI) may be sensitive to changes in the macromolecular content of tumors and the extracellular matrix that occur during neoadjuvant therapy for breast cancer. We demonstrate in a pilot population of breast cancer patients that the magnetization transfer ratio declines after the first cycle of chemotherapy in women who achieve response to therapy, while the magnetization transfer ratio increases in tumors that do not respond to therapy.
Introduction
A number of MRI techniques have been applied to quantify changes in breast tumors during the course of neoadjuvant therapy (NAT).1 NAT is any therapeutic regimen given prior to surgery, and has been shown to decrease micrometastasis and increase overall survival. Magnetization transfer MRI (MT-MRI), which can indirectly probe the macromolecular pool in biological tissue by surveying the interaction of macromolecules with free water, has been relatively underexplored in this setting. We report preliminary results of the use of MT-MRI in monitoring breast tumor response to NAT made in the community setting.Methods
We have employed MT-MRI in a quantitative breast imaging protocol in healthy volunteers (n = 13) and breast cancer patients undergoing NAT (n = 10). MT-MRI measurements were performed using two gradient echo sequences (TR/TE = 48/6.4) each identical save for the inclusion of a 1500 Hz off resonance MT saturation pulse included on one acquisition for a total scan time of 53 seconds. MT was quantified using the magnetization transfer ratio (MTR), which was calculated as the difference in signal intensity with and without the MT saturation pulse divided by the signal intensity without MT saturation. Healthy subjects were scanned twice within the same day to assess repeatability of MTR (n=10) and across three sites to assess reproducibility of MTR (n=3) in healthy breast fibroglandular tissue. In women undergoing NAT for breast cancer, longitudinal MTR measurements were performed at 4 time points: 1) prior to the start of NAT, 2) after 1 cycle of NAT, 3) after 2-4 cycles of NAT, and 4) 1 cycle after MRI #3. Changes in MTR were compared to changes in tumor response to treatment.Results
In healthy volunteers, the MTR of fibroglandular tissue was repeatable in two scans of the same subject, with an average difference of 11.6%. Additionally, MTR measurements were reproducible across three imaging sites, with an average difference of 12.7% between scanners. In women with known breast cancer undergoing NAT, the MTR of the tumor revealed an average increase in MTR of 14.3% from the initial (pre-NAT) MRI to the final MRI. However, there was a high amount of variability between patients, which correlated with response to treatment. After one cycle of NAT, women who ultimately achieved pathological complete response (pCR; n = 3) to therapy exhibited a decline in MTR (-3.55% ± 6.30%) whereas patients who did not achieve pCR (n = 6) had increased MTR (3.46% ± 13.81%). Overall, when combining the tumors which achieved a positive response to therapy through a decrease in tumor size (pCR or partial response; n = 5), there was an overall decline in MTR after one cycle of NAT (-5.84% ± 5.69%) compared with women with stable or progressive disease (7.89% ± 15.40%; n = 4). The second MTR measurement (performed after 2-4 cycles of NAT) correlated with declines in tumor size, with smaller increases in MTR corresponding to greater declines in tumor volume (R2 = 0.6; p = 0.009; n = 10).Discussion and Conclusions
We find that MTR measurements of healthy fibroglandular tissue are both repeatable and reproducible, in agreement with previous studies performing quantitative magnetization transfer MRI in the breast.2 Initial pilot experiments indicate that changes in MTR in response to chemotherapy may correlate with the response to therapy. Tumors which responded to therapy exhibited a decline in MTR after a single cycle of NAT, indicating that MTR may reflect a treatment-induced loss of macromolecules in either the tumor or extracellular matrix. At later time points during the course of NAT, the MTR values of tumors were increased over baseline, possibly due to treatment-induced fibrosis. Importantly, these measurements were made in the community setting, demonstrating that MT-MRI can be performed outside of academic medical centers. Further work is underway to confirm these initial results in a larger patient cohort.Acknowledgements
We thank financial support from NCI (U01 CA174706 and U01 CA154602) and the Cancer Prevention Research Institute of Texas (RR160005).References
1. Li X, Kang H, Arlinghaus LR, et al. Analyzing spatial heterogeneity in DCE- and DW-MRI Parametric Maps to Optimize Prediction of Pathologic Response to Neoadjuvant Chemotherapy in Breast Cancer. Trans Oncology. 2014; 7(1):14-22.
2. Arlinghaus LR, Dortch RD, Whisenant JG, Kang H, Abramson RG, Yankeelov TE. Quantitative Magnetization Transfer Imaging of the Breast at 3.0 T: Reproducibility in Healthy Volunteers.Tomography. 2016 Dec;2(4):260-266.
Figures