4444
Novel parameters of Ultrafast DCE MRI of the breast using a compressed sensing technique1Department of Diagnostic Imaging and Nuclear Medicine, Kyoto University Graduate School of Medicine, Kyoto, Japan, 2Department of Radiology, Memorial Sloan Kettering Cancer Center, New York City, NY, United States, 3Department of Radiology, Kyoto University Hospital, Kyoto, Japan, 4Siemens Healthcare GmbH, Erlangen, Germany, 5Department of Breast Surgery, Kyoto University Graduate School of Medicine, Kyoto, Japan
Synopsis
We evaluated new parameters of breast ultrafast dynamic contrast-enhanced (UF-DCE) MRI using compressed sensing technique: the maximum slope (MS), time to enhancement (TTE) and the time interval between arterial and venous visualization (AVI). MS was higher, and TTE and AVI were shorter in malignant lesions compared to benign lesions, although there were discrepancies among these parameters and BI-RADS based delayed phase patterns. There seemed to be some relevance between these parameters and histopathologic findings.
Introduction
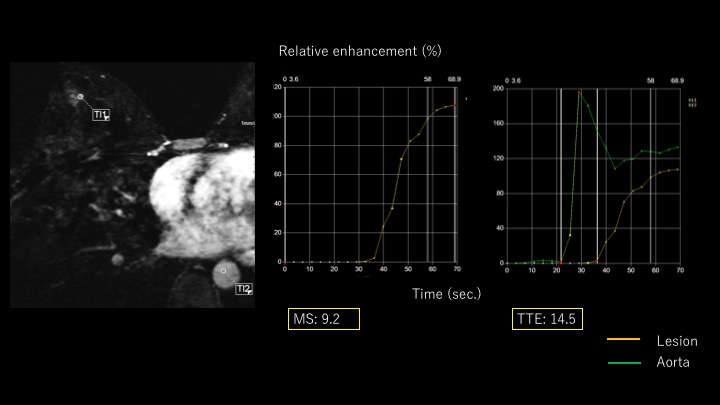
The necessity of a kinetic evaluation including delayed phase images hinders acceleration of breast dynamic contrast-enhanced (DCE) MRI. To remove this barrier, ultrafast dynamic contrast-enhanced (UF-DCE) MRI has been proposed with several new kinetic parameters; the maximum slope (MS), time to enhancement (TTE) and the time interval between arterial and venous visualization (AVI)1-3. The aim of this study was to evaluate these new parameters of UF-DCE MRI using a compressed sensing (CS) technique.Methods
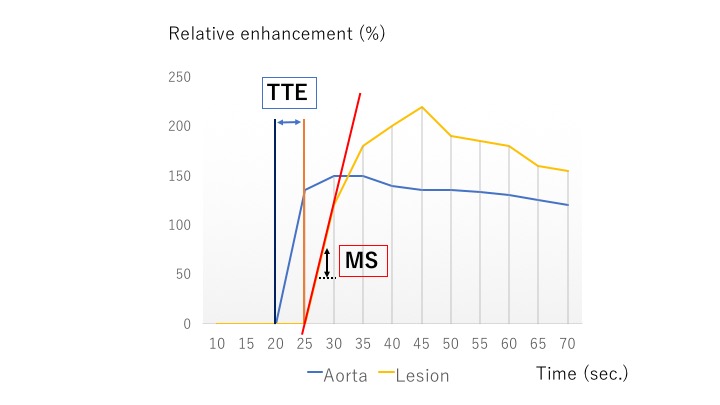
Our study population consisted of consecutive female patients who underwent breast MRI with UF-DCE protocol from April to August 2016 with histopathological diagnosis. A total of 28 females with 32 enhancing lesions (27 malignant and five benign; two intraductal papillomas, one fibroadenoma and three others) were included. MR examinations were performed using a 3T scanner (MAGNETOM Skyra, Siemens Healthcare, Germany) with a 16-channel dedicated bilateral breast coil. Gadobutrol (Gadovist, Bayer. Germany) was intravenously infused at a dose of 0.1 ml/kg and at a speed of 2.0 ml/sec, followed by 20 ml of saline at the same rate. The DCE MR protocols were as follows: 1. pre phase; 2. UF-DCE MRI (15 sec before contrast injection-60 sec after contrast injection, 2 sec preparation time followed by 3.7 sec/frame×continuous 20 frames); 3. initial phase DCE MRI, 60-120 sec after contrast injection; 4. high spatial-resolution DCE MRI, 120-300 sec after contrast injection; 5. delayed phase DCE MRI, 300-360 sec after contrast injection. UF-DCE MRI was acquired by a prototype based on the 3D gradient-echo VIBE sequence using a CS reconstruction (TR/TE 5.0/2.5, FA 15, FOV 360 mm×360 mm, matrix 384×269, thickness 2.5 mm, CS acceleration=16.5, temporal resolution 3.7 sec per frame, 20 time frames). CS reconstruction was performed with 30 iterations, based on a separate retrospective evaluation of the convergence speed. Using 20 frames of UF-DCE MR images, we reconstructed 19 maximum intensity projection (MIP) images from subtracted images (by subtraction from the 1st frame). Using Aquarius iNtuition Viewer: Fast Pass Analysis (prototype software by terarecon), we measured the following parameters and compared their diagnostic performance; 1. MS: The slope(%/sec) of the tangent along the steepest part of the up-slope curve. 2. TTE: The time point when the lesion starts to enhance subtracted by the time point when the aorta starts to enhance (figure 1). 3. AVI: The time point when the breast vein starts to enhance subtracted by the time point when the breast artery starts to enhance. We also evaluated kinetics of each lesion based on BI-RADS 2013. In particular, we classified the kinetic curve based on the delayed phase (washout/ plateau/ persistent) and compared this with the new parameters above using Spearman’s correlation coefficient. Per-lesion analysis was conducted.Results
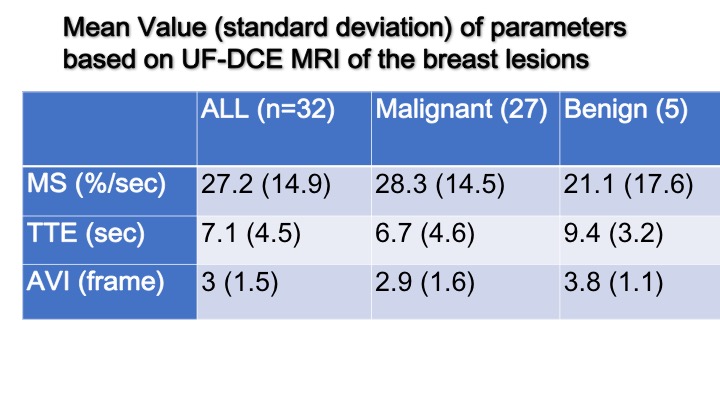
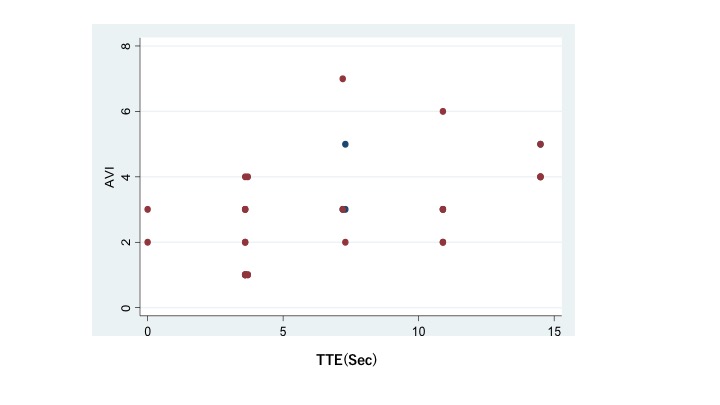
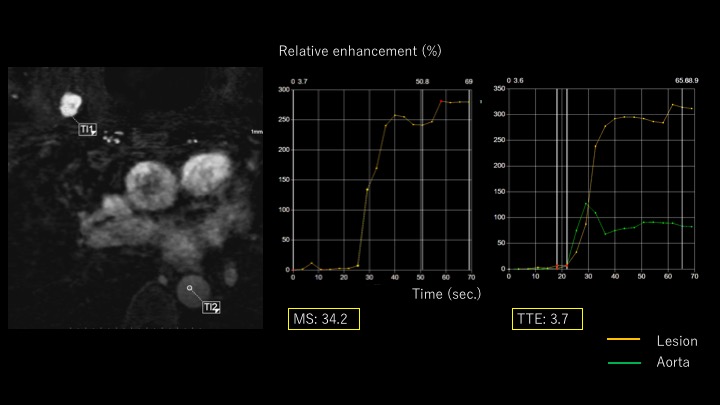
Mean values for malignant and benign lesions were summarized in Table 1. MS was higher, and TTE as well as AVI were shorter in malignant lesions compared to benign lesions. TTE showed moderate correlations with AVI (Spearman’s correlation coefficient 0.52, p=0.002, figure 2) and weak negative correlations with MS (-0.35, p=0.05). AVI showed moderate correlation with BI-RADS washout pattern (0.46, p=0.01). Using the following cut-off point, sensitivity/specificity were 0.89/0.40 (AVI: cut-off 2 frames), 0.89/0.33(MS: cut-off 15%/sec), 0.86/0.20 (TTE: cut-off 10sec). Compared to the histopathological diagnosis, papillary lesions showed higher MS (59.0 vs 23.9) and shorter TTE (3.7 vs 7.5). Luminal B breast cancer showed shorter AVI (1.8 vs 3.2). Images of representative cases and time curves of the relative enhancement are shown in figures 3 and 4.Discussion
Malignant lesions tended to enhance earlier, with steeper curve, with shorter arterial and venous interval, reflecting increased blood flow. The data also revealed discrepancies among these parameters and BI-RADS washout pattern, possibly reflecting slightly different aspect of the lesions. Among several parameters, AVI and TTE showed moderate association. There was a tendency that MS and TTE were associated with papillary lesions, and AVI was associated with Luminal B breast cancer. The current analysis is limited by the small number of benign lesions.Conclusion
Among several new parameters, MS was higher, and TTE and AVI were shorter in malignant lesions compared to benign lesions, although there were discrepancies among these parameters and BI-RADS based delayed phase patterns, possibly reflecting different aspects of the breast lesions. These parameters may reflect some histopathological findings, which leads to more detailed diagnosis. We may need to develop new ways to evaluate lesions in order to apply UF-DCE of the breast in the clinical setting, instead of simply replacing BI-RADS based kinetic analysis.Acknowledgements
We thank Mr. Katsutoshi Murata and Mr. Yuta Urushibata, Siemens Healthcare K.K., for their technical support in this work.
This work was partly supported by Grant-in-Aid for Scientific Research on Innovative Areas “Initiative for High-Dimensional Data-Driven Science through Deepening of Sparse Modeling”, MEXT grant numbers 25120002, 25120008.
References
- Mann RM, Mus RD, et al. A novel approach to contrast-enhanced breast magnetic resonance imaging for screening: high-resolution ultrafast dynamic imaging. Investigative radiology. 2014; 49(9), 579-585.
- Mus RD, Borelli C, et al. Time to enhancement derived from ultrafast breast MRI as a novel parameter to discriminate benign from malignant breast lesions. European Journal of Radiology, 2017; 89, 90-96.
- Onishi N, Kataoka M, et al. Ultrafast dynamic contrast‐enhanced mri of the breast using compressed sensing: breast cancer diagnosis based on separate visualization of breast arteries and veins. Journal of Magnetic Resonance Imaging . 2017
Figures