4443
Intravoxel incoherent motion (IVIM) and non-Gaussian diffusion MRI of the lactating breast1Department of Diagnostic Imaging and Nuclear Medicine, Graduate School of Medicine, Kyoto University, Kyoto, Japan, 2Hakubi Center for Advanced Research, Kyoto University, Kyoto, Japan, 3Siemens Healthcare K.K., Tokyo, Japan
Synopsis
The effect of breastfeeding on IVIM and non-Gaussian diffusion MRI was investigated. ADC0 and sADC values significantly decreased (P < 0.001 and P < 0.001) while K values significantly increased (P < 0.05) post-breastfeeding. fIVIM values significantly increased after breastfeeding (P < 0.01). No significant difference was found in D* values. There was significant heterogeneity in ADC0 maps post-breastfeeding, both in retroareolar and segmental scores (P < 0.0001 and = 0.0001). IVIM and non-Gaussian diffusion parameters significantly changed between pre- and post-breastfeeding status, and care needs to be taken in interpreting DWI data in lactating breasts.
Introduction
The use of contrast-enhanced breast MRI in lactating women might be safely performed for the evaluation of the extent of disease, despite small amounts of gadolinium contrast agents excreted in breast milk.1 Concerns have arisen based on recent findings of gadolinium deposits in the brain2 and increased risks of disease in infants exposed to gadolinium contrast at any time during pregnancy.3 Besides contrast-enhanced breast MRI during lactation is challenging due to increased enhancement in normal breast parenchyma that can mimic breast lesions.4 Intravoxel incoherent motion (IVIM) and non-Gaussian diffusion MRI are non-contrast techniques that can assess tissue microvasculature and structure.5 Our purpose was to investigate the effect of breastfeeding on IVIM and non-Gaussian diffusion MRI.Methods
This study included 12 lactating women, five women post-weaning, and one lactating patient. Twelve lactating women were scanned twice, before and after breastfeeding. They suckled the babies at both breasts after the first MR scan and then underwent the second MR scan. Five post-weaning women and one patient underwent a single MR scan. The volunteers’ information is provided in Table 1. Breast MRI was performed using a 3-T system (Prisma and Trio; Siemens AG) equipped with a dedicated 16-channel breast array coil. The following fat-suppressed DWI images were obtained twice, before and after breastfeeding: single shot EPI along three orthogonal axes; 16 b values of 0, 5, 10, 20, 30, 50, 70, 100, 200, 400, 600, 800, 1000, 1500, 2000, 2500 sec/mm2; a scan time of 3min 46sec; repetition time/echo time, 4,700/56 ms; flip angle, 90°; 2x2mm resolution and 3.0 mm slice thickness); ROIs were placed onto all the normal breast tissues and images were processed using software implemented in Matlab (Mathwork, Natick, MA). IVIM (fIVIM and D*) and non-Gaussian diffusion (ADC0 and K) parameters using 16 b values5, plus synthetic apparent diffusion coefficients (sADCs) from 2 key b values (b = 200 and 1500 s/mm2)6 were calculated using regions of interest. ADC0 maps of the entire breast were generated and their heterogeneity was evaluated. The contrast changes observed extending from the nipple to the posterior breast direction (retroareolar score) and along the segments in any quadrants of the breast (segmental score) characteristic of lactating breasts was scored on ADC0 maps by two independent breast radiologists (Figure 1).
For the comparison of the diffusion and IVIM parameters, Wilcoxon signed rank tests were used between pre- and post-breastfeeding, and Mann-Whitney tests were used between breasts in the post-weaning period and pre- or post-breastfeeding. Bonferroni’s correction was performed to account for multiple comparisons. Retroareolar and segmental scores were analyzed using Wilcoxon signed rank tests, and the interobserver variability of two readers was evaluated using interrater agreement (k).
Results
Representative non-Gaussian diffusion and IVIM parametric maps of a lactating breast are shown in Figure 2. The values of diffusion and IVIM parameters in pre- and post-breastfeeding and post-weaning subjects are summarized in Table 2. ADC0 and sADC values significantly decreased post-breastfeeding (1.90 vs. 1.72 × 10⁻³ mm2/s, P < 0.001 and 1.39 vs. 1.24 × 10⁻³ mm2/s, P < 0.001) while K values significantly increased (0.33 vs. 0.44, P < 0.05). fIVIM values significantly increased after breastfeeding (1.97 vs. 2.97 %, P < 0.01). No significant difference was found in D* values. A high correlation of scores between two readers (weighted κ was 0.87 for retroareolar score and 0.89 for segmental score) was observed; hence, both scores were averaged for the analysis. The median and interquartile range of the retroareolar scores significantly increased from 1.0 (0.0–1.5) pre-breastfeeding to 2.0 (1.0–2.0) post-breastfeeding (P < 0.0001). A significant increase in segmental scores was also observed from 0.5 (0.0–1.25) pre-breastfeeding to 2.0 (1.0–3.0) post-breastfeeding (P = 0.0001). ADC0 parametric map of breast cancer during lactation is shown in Figure 3. Low ADC0 values in invasive ductal carcinoma (IDC) are prominent compared to high ADC0 values in breast parenchyma.Discussion
We have shown that both ADC0 and sADC values decrease approximately 8% in post- compared with pre-breastfeeding, while Nissan et al. have reported higher MD values in lactating breasts compared with post-weaning breasts.7 The evaluation of ADC0 distribution using retroareolar and segmental scores indicate that the distribution of ADC0 values become more inhomogeneous along both anterior-posterior and inner-outer directions with post-breastfeeding. Thus, the above results suggest that pre-breastfeeding status is optimal for breast DW images, to obtain good contrast of ADC values between cancer and normal breast parenchyma, allowing higher and more homogeneous ADC values in normal breast parenchyma, and a better contrast between breast parenchyma and lesions, although more evidence as to the appropriate time to scan lactating breasts with MRI is needed.Acknowledgements
The authors would like to thank Mr. Yuta Urushibata and Dr. Hirokazu Kawaguchi from Siemens Healthcare K.K. for the excellent and knowledgeable support. The authors would also like to thank Dr. Thorsten Feiweier from Siemens Healthcare for providing the prototype sequence used in this work.
This work was supported by Hakubi Project of Kyoto University and MEXT KAKENHI Grant No. 15K19786.
References
(1) Rofsky NM, Weinreb JC, Litt AW. Quantitative analysis of gadopentetate dimeglumine excreted in breast milk. J Magn Reson Imaging 1993;3(1):131-132.
(2) McDonald RJ, McDonald JS, Kallmes DF, et al. Intracranial Gadolinium Deposition after Contrast-enhanced MR Imaging. Radiology. 2015;275(3):772-82.
(3) Ray JG, Vermeulen MJ, Bharatha A, Montanera WJ, Park AL. Association Between MRI Exposure During Pregnancy and Fetal and Childhood Outcomes. JAMA. 2016;316(9):952-61.
(4) Talele AC, Slanetz PJ, Edmister WB, et al. The lactating breast: MRI findings and literature review. Breast J. 2003;9(3):237-40.
(5) Iima M, Yano K, Kataoka M, et al. Quantitative Non-Gaussian Diffusion and Intravoxel Incoherent Motion Magnetic Resonance Imaging: Differentiation of Malignant and Benign Breast Lesions. I Invest Radiol. 2015;50(4):205-11.
(6) Iima M, Le Bihan D. Clinical Intravoxel Incoherent Motion and Diffusion MR Imaging: Past, Present and Future. Radiology 2016;278(1):1.
(7) Nissan N, Furman-Haran E, Shapiro-Feinberg, et al. Monitoring In-Vivo the Mammary Gland Microstructure during Morphogenesis from Lactation to Post-Weaning Using Diffusion Tensor MRI. Journal of mammary gland biology and neoplasia 2017; in press. doi: 10.1007/s10911-017-9383-x.
Figures
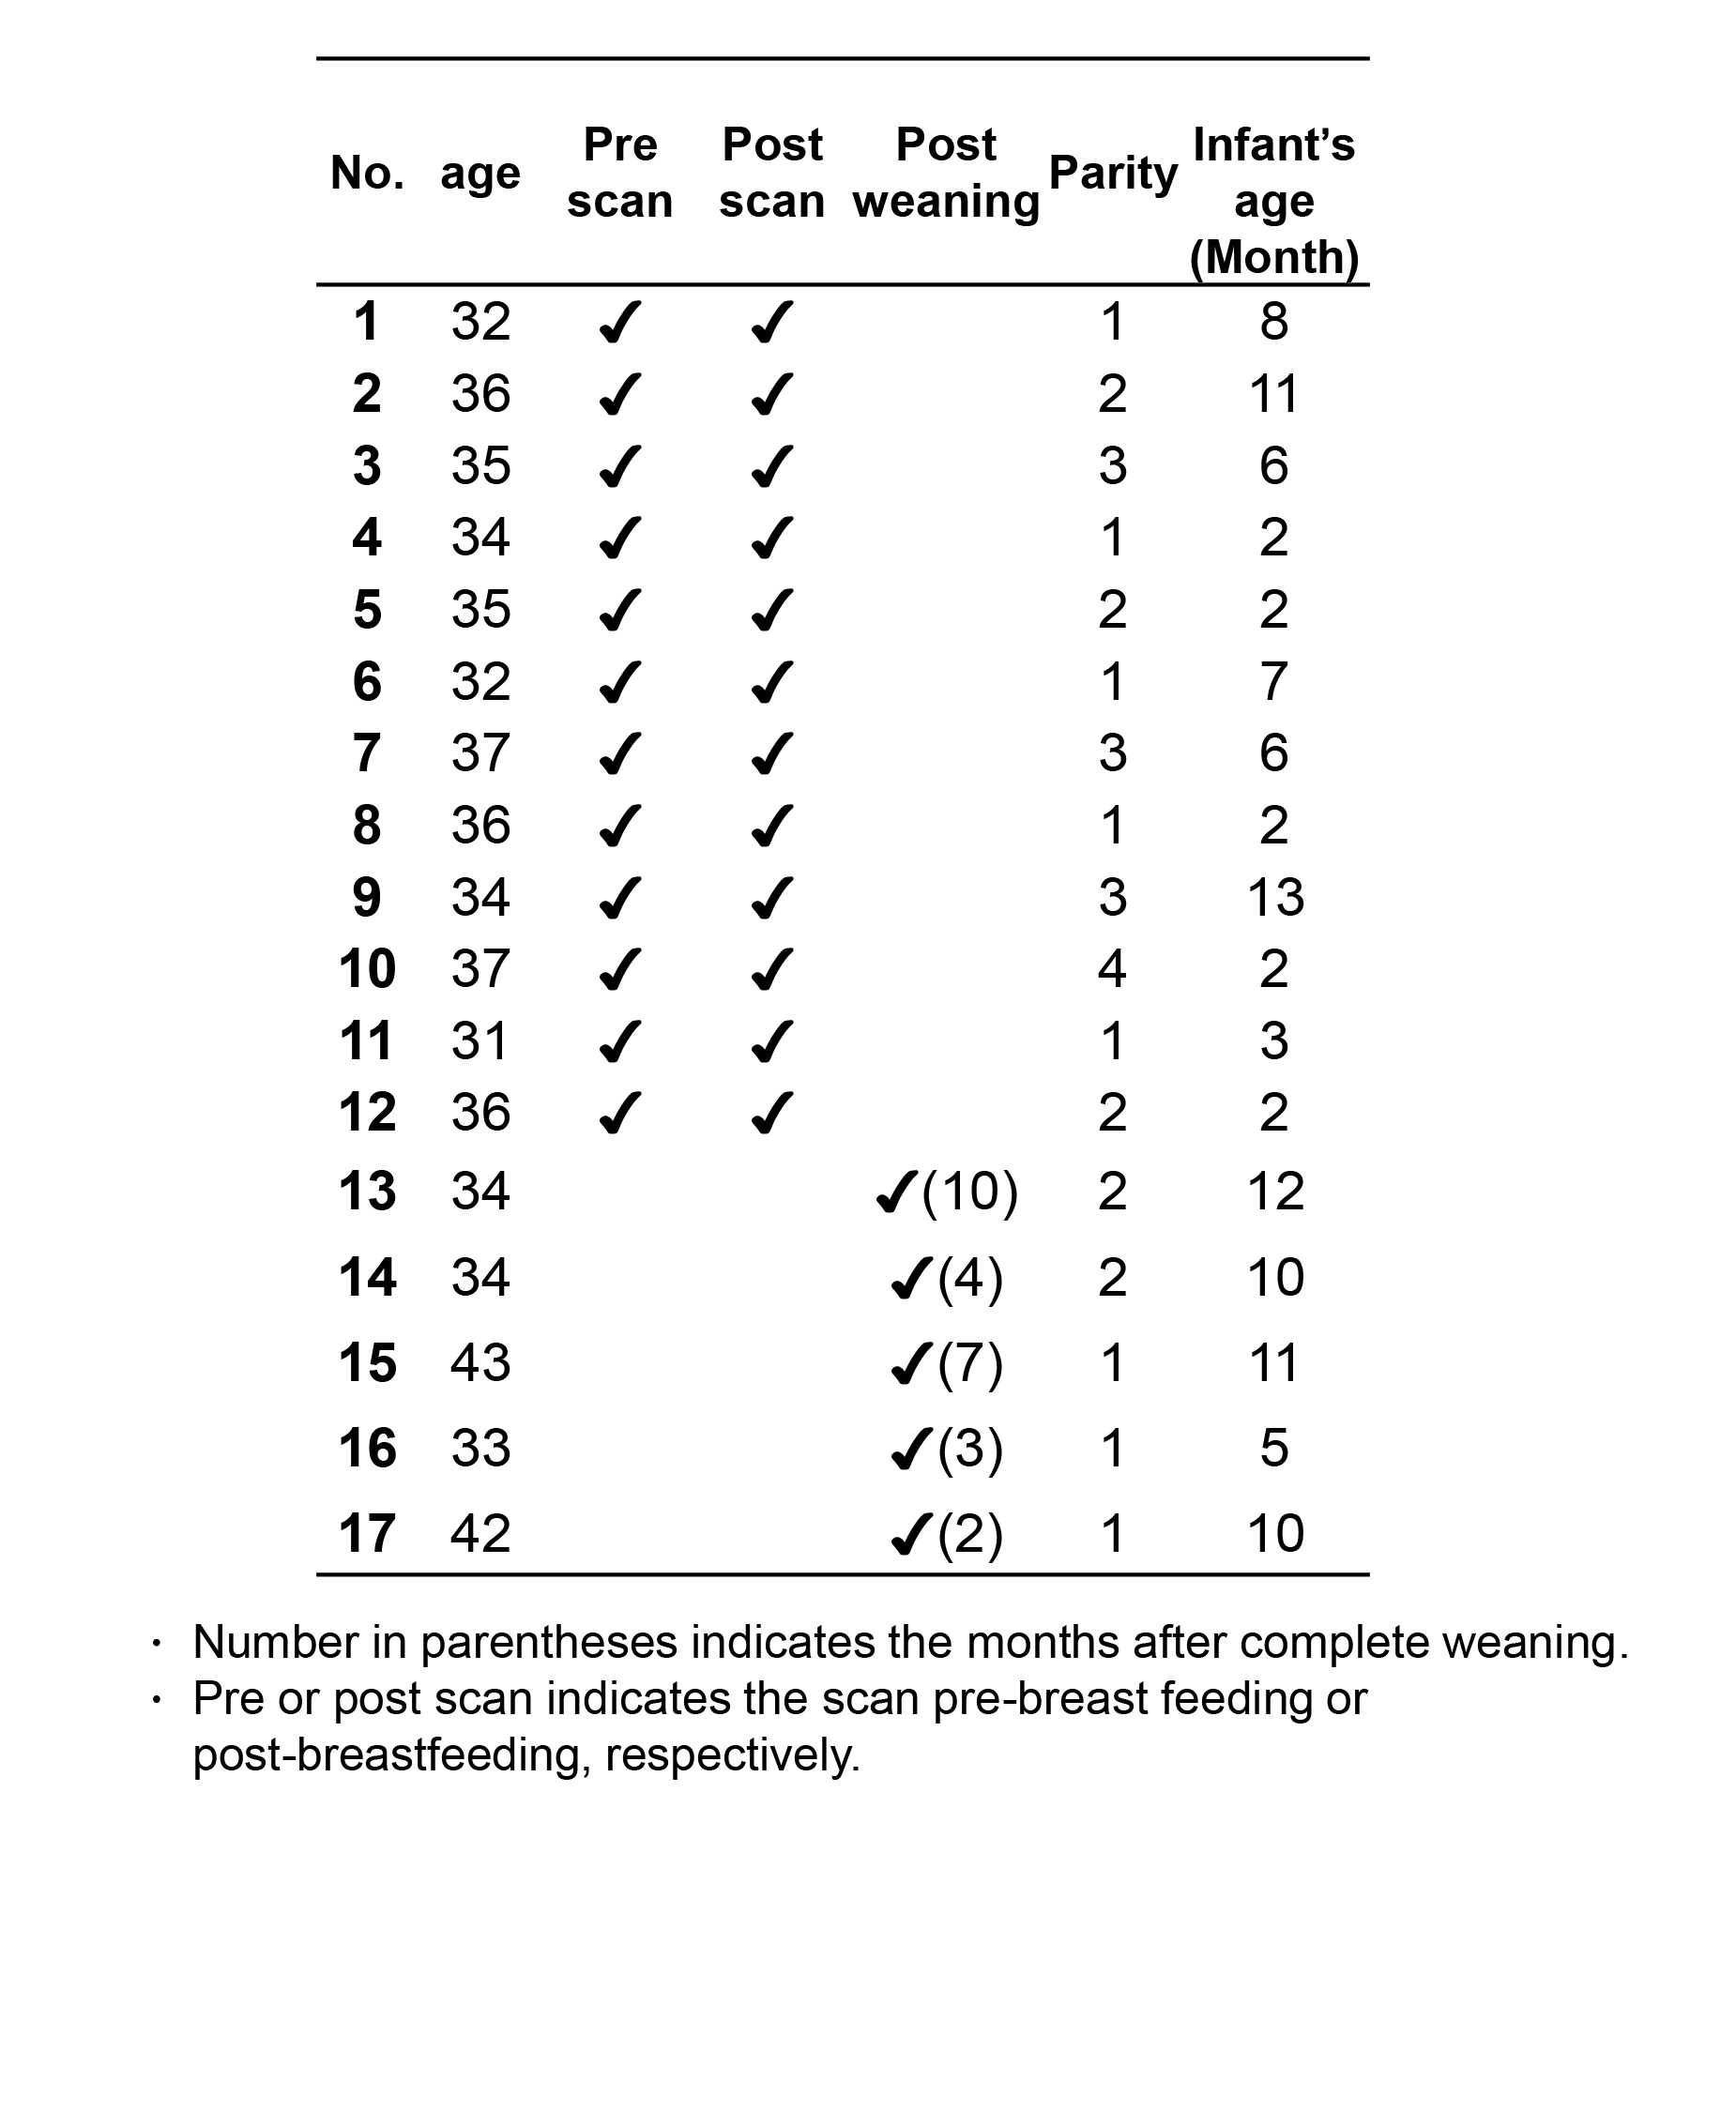
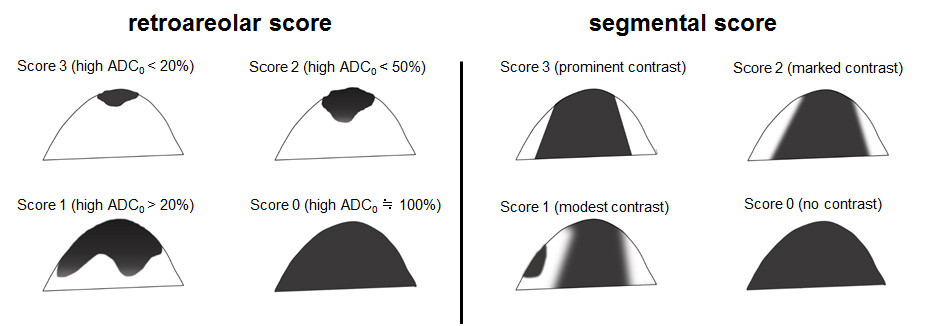
Figure 1: Schema of retroareolar score (left) and segmental score (right) using a semiquantitative scale (3-0).
The contrast in the nipple-to-posterior-breast direction (retroareolar score) uses a score of 0–3:The percentage of the area involved by high ADC0 is scored 3 for < 20%; 2 for < 50%; 1 for > 50%; and 0 for almost 100% homogeneity with no contrasting areas. The contrast among the segments (segmental score) is scored from 0–3: A score of 3 is given if the contrast of ADC0 values of a cone or triangular area is prominent. Score 2 if it is marked; 1 if modest; 0 implies no contrast.
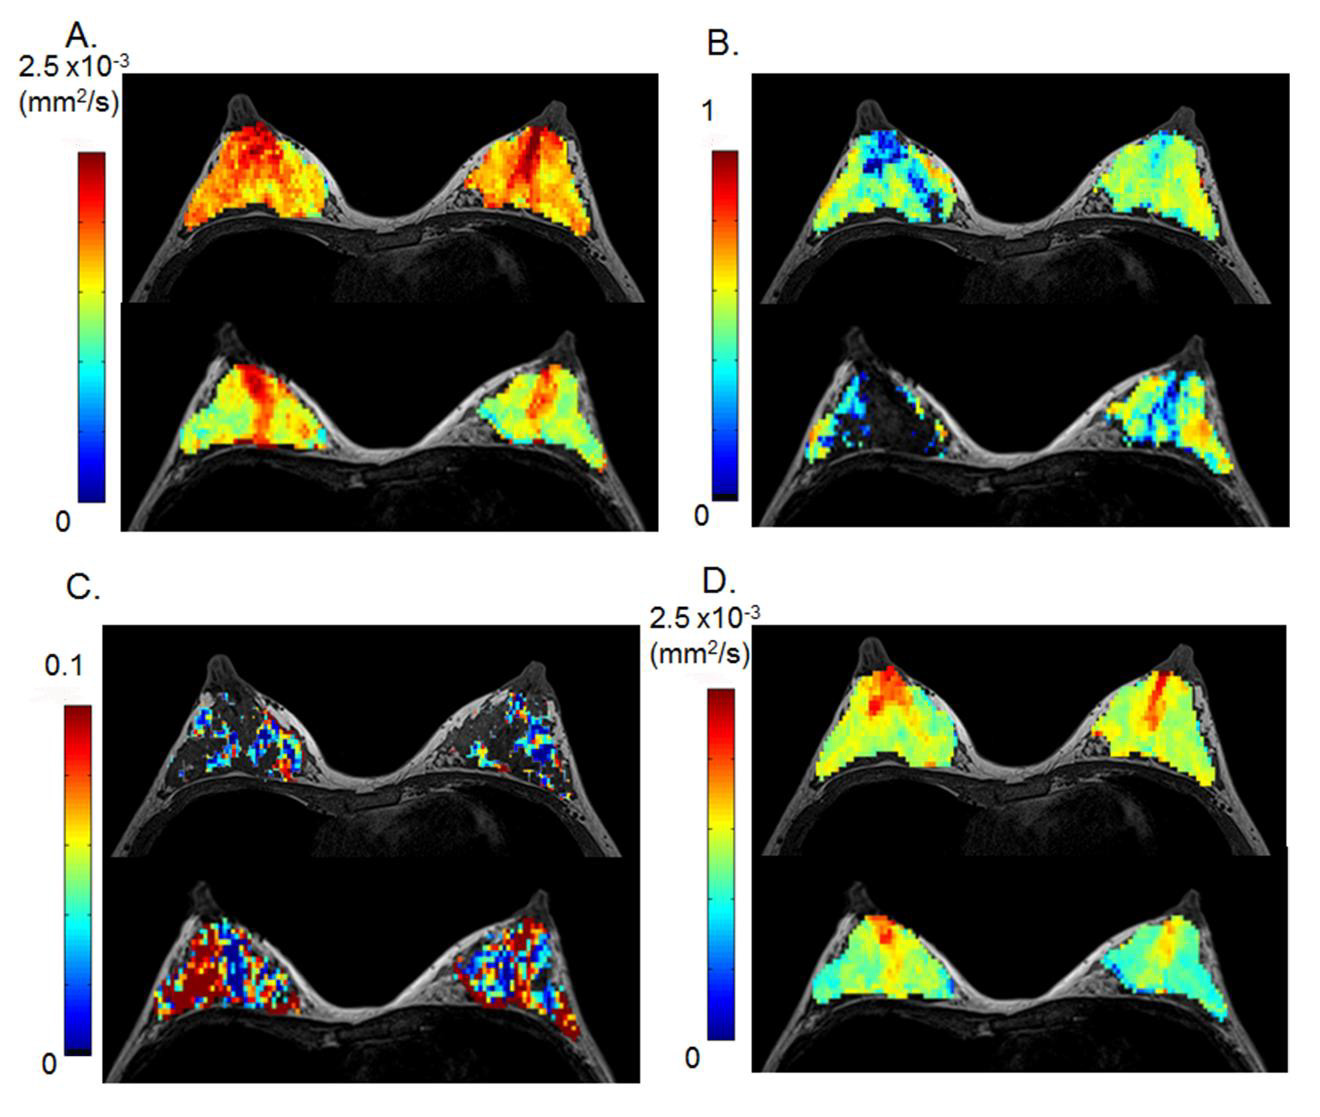
Figure 2: 32-year-old lactating volunteer with a 7-month-old baby.
The upper row images were scanned pre-breastfeeding, and the lower row images were scanned post-breastfeeding. (A) ADC0 map, (B) K map, (C) fIVIM map (D) sADC map. The distribution of ADC0, sADC and K values becomes more heterogeneous after breastfeeding (both retroareolar and segmental scores increased post-breastfeeding). ADC0 and sADC values decrease in the whole breast except the retroareolar region (Figure 2A, D). The increase of fIVIM values after breastfeeding was marked, as shown by the increase in red pixels in Figure 2C.
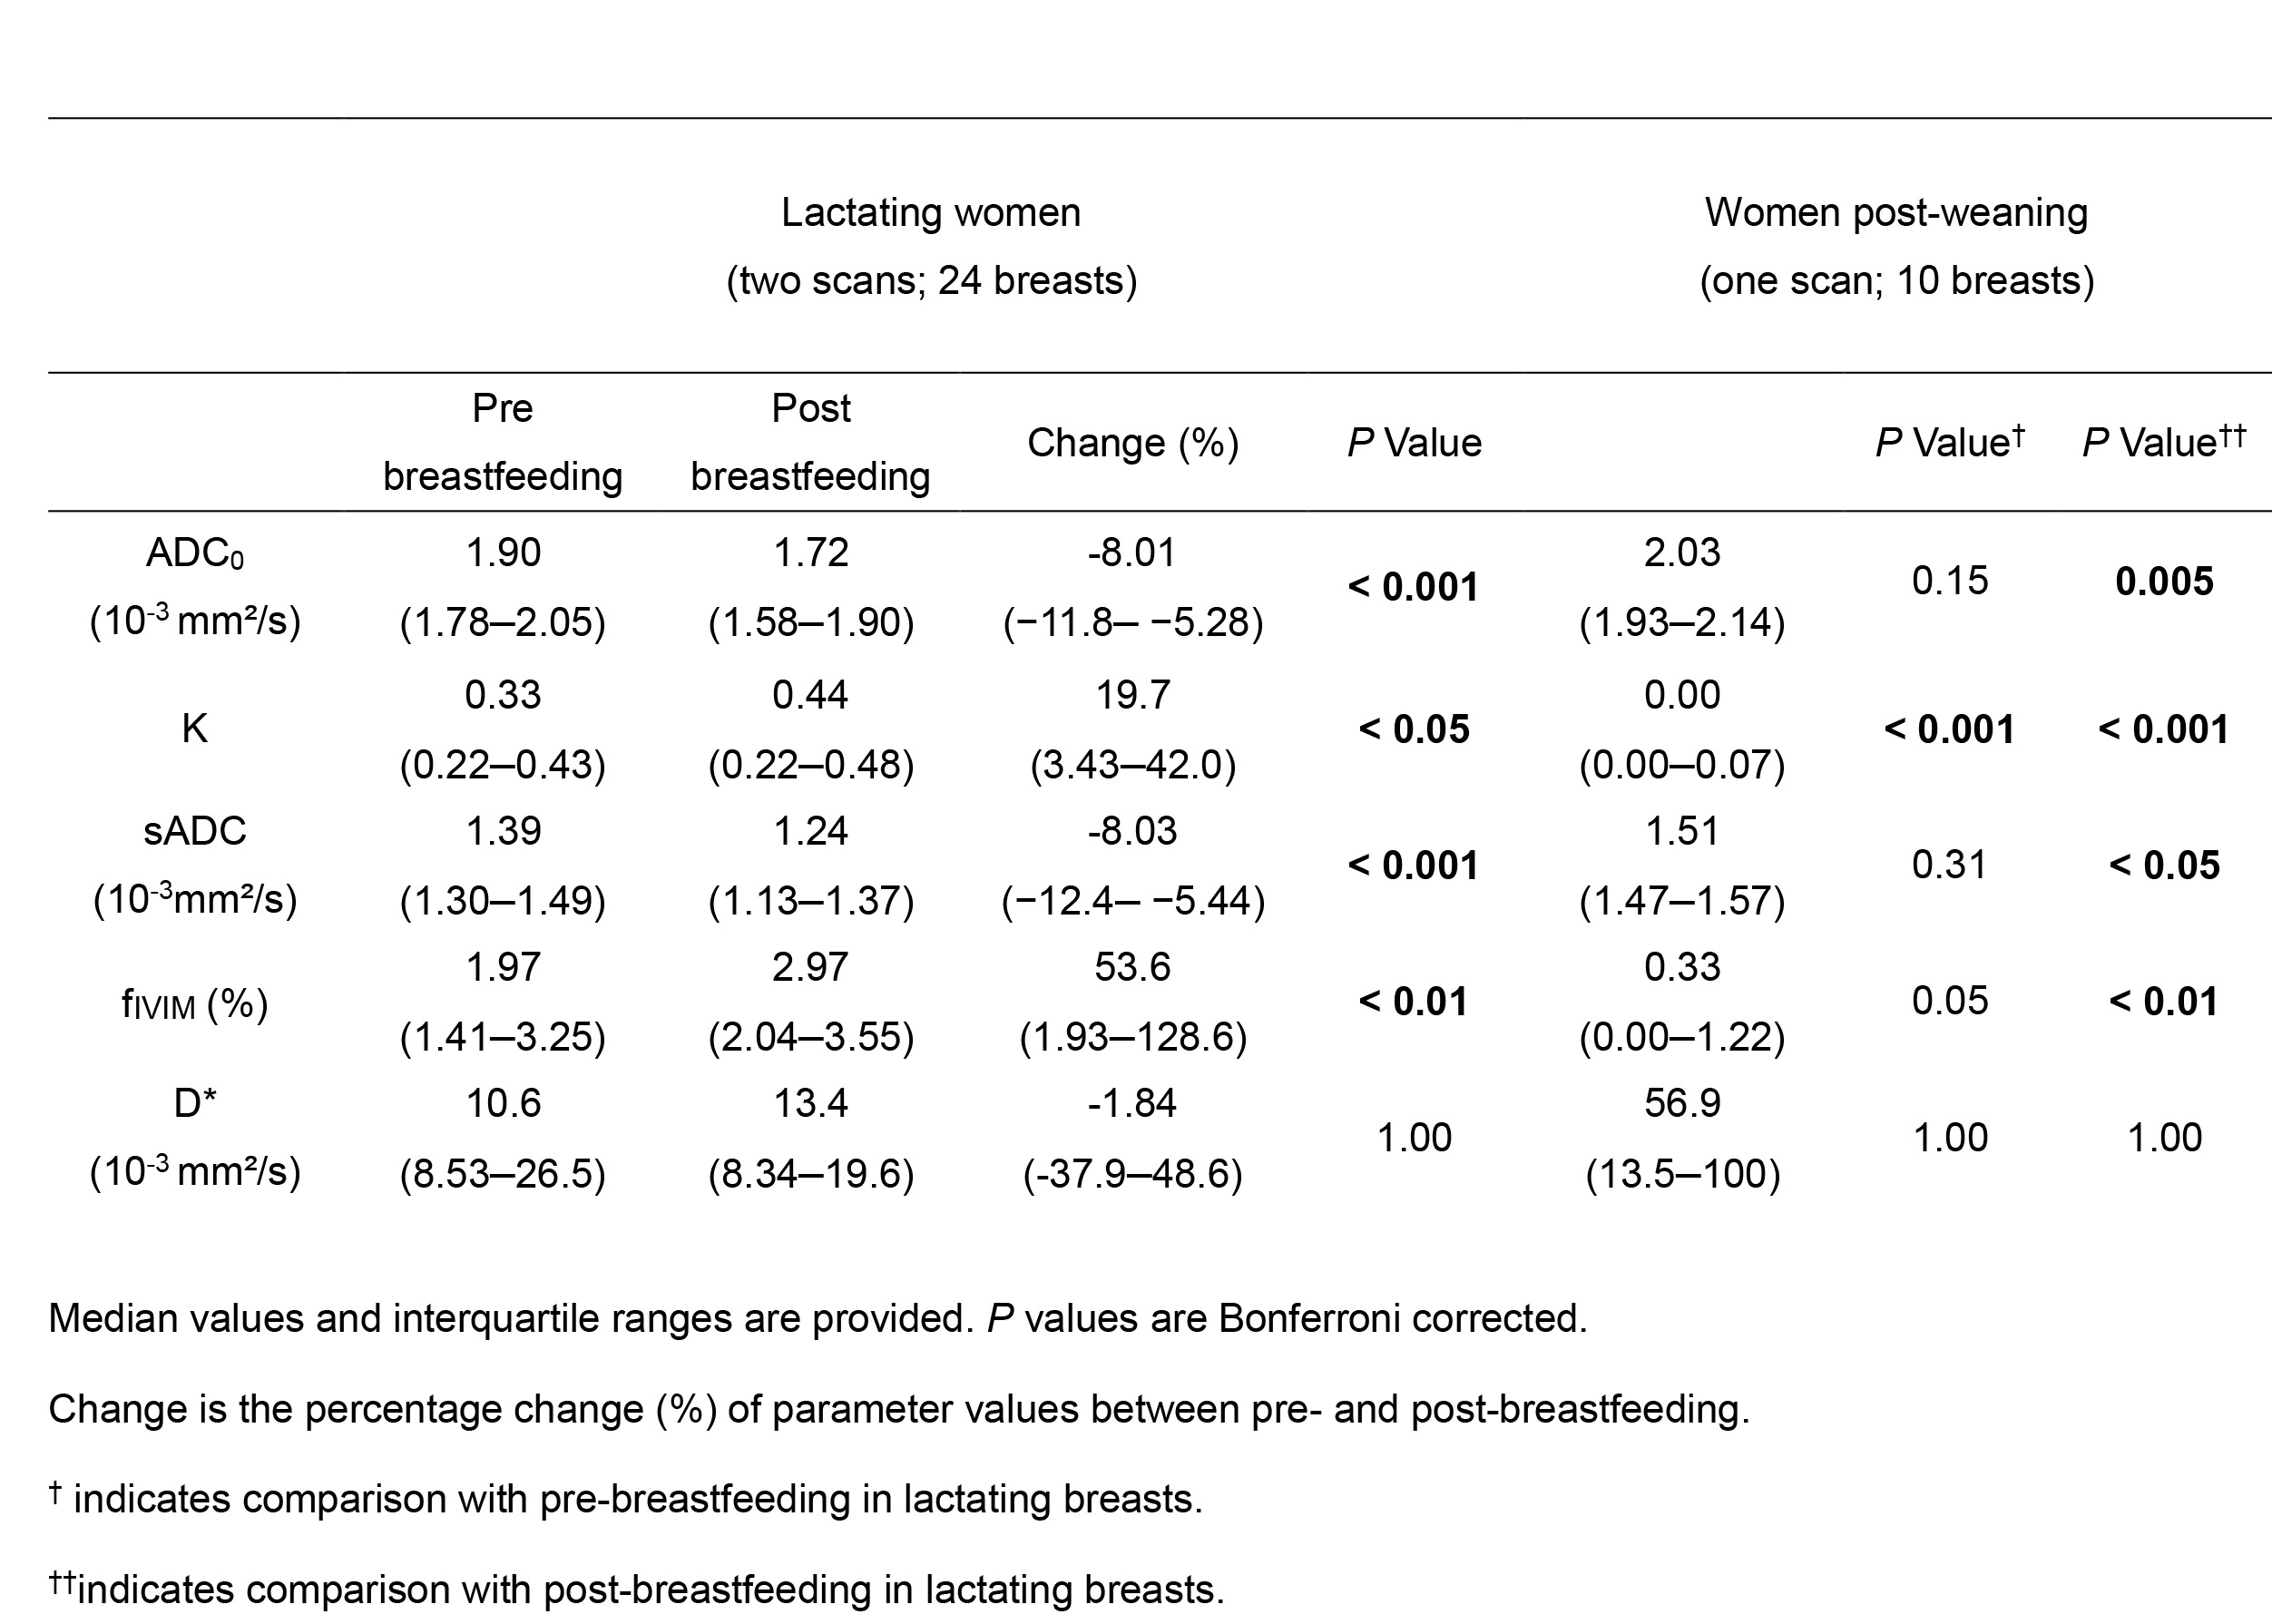
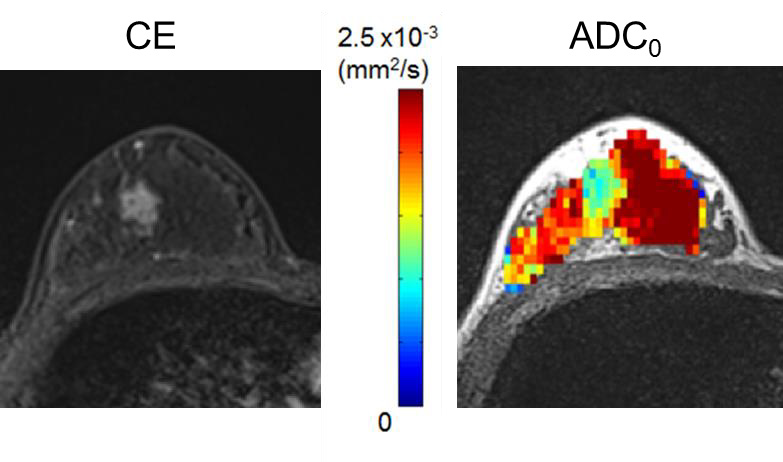
Figure 3: 36-year-old woman in lactation with invasive ductal carcinoma.
Left; contrast-enhanced (CE) image, right; ADC0 map. The mass with low ADC0 values (light blue) corresponds to the enhancing mass on CE image.