4442
Characterize Tumor Cellularity in Breast Cancer with Diffusion MRI1Radiology, Washington University School of Medicine, St. Louis, MO, United States, 2Radiology, Changhai Hospital, Shanghai, China
Synopsis
Recent consensus suggested breast MRI lacks necessary sensitivity or specificity to detect breast cancer. MRI may over-diagnose breast cancer and result in over-treatment. The novel diffusion MRI histology (D-Histo) method demonstrated its ability to accurately locate lesion and quantify cancer cellularity and afforded greater sensitivity and specificity than ADC did in distinguishing between tumor and benign tissues. D-Histo’s improved diagnostic accuracy thus better guides treatment planning, and more accurately measures treatment efficacy.
Introduction
Breast cancer is the most commonly diagnosed cancer among American women. Approximately 252,710 new cases are expected to be diagnosed in 2017. Breast cancer is also the second leading cause of cancer death among American women after lung cancer. Roughly 40,610 women in the U.S. are expected to die from this disease in 2017.1 Breast MRI, especially Gd-T1WI, DCE MRI and DWI spectrums, has been widely used to detect clinically-significant breast cancer and to guide biopsies.2 Yet false positive diagnoses were common, due to the overlapping MRI signals from benign tumors, edema, inflammation and stromal tissue. Here we employed a novel diffusion MRI method, the diffusion MRI histology (D-Histo), to detect breast cancer. D-Histo, an improved version of diffusion basis spectrum imaging,3 models diffusion-weighted MRI signals into an anisotropic-diffusion tensor reflecting stromal tissues, and a spectrum of highly-restricted (modeling lymphocytes), restricted (modeling cancer cells) and non-restricted (modeling edema) isotropic-diffusion tensors. We demonstrated D-Histo restricted-fraction could accurately delineate malignant breast tumor and quantify tumor cellularity.Methods
Patient recruitment: 88 patients with clinical suspicion of breast cancer and without any preoperative treatment were recruited for the study. There were 31 invasive ductal carcinoma patients and 3 mucinous breast carcinoma patients; 13 patients were with fibroadenoma, 3 with intraductal papilloma and 1 with lymphoma. MRI: diffusion-weighted MRI data was obtained on a 3T GE scanner with an 8-channel phased-array breast receive coil. Single-shot echo-planar DWI was performed in transverse view (1.5×1.5×5 mm3) using a 25-direction encoding scheme (maximum b-value of 1500 s/mm2) in 8 minutes. An in-house software performed both D-Histo and DTI analyses. Standard mpMRI were obtained for all patients. All tumor lesions and benign regions were based on Gd-T1W images and defined by an experienced radiologist. Histology: Tumor tissues were obtained for sectioning and staining after mastectomy. Sectioned slabs were embedded in paraffin and sectioned in 4-µm thick slices for H&E staining.Results
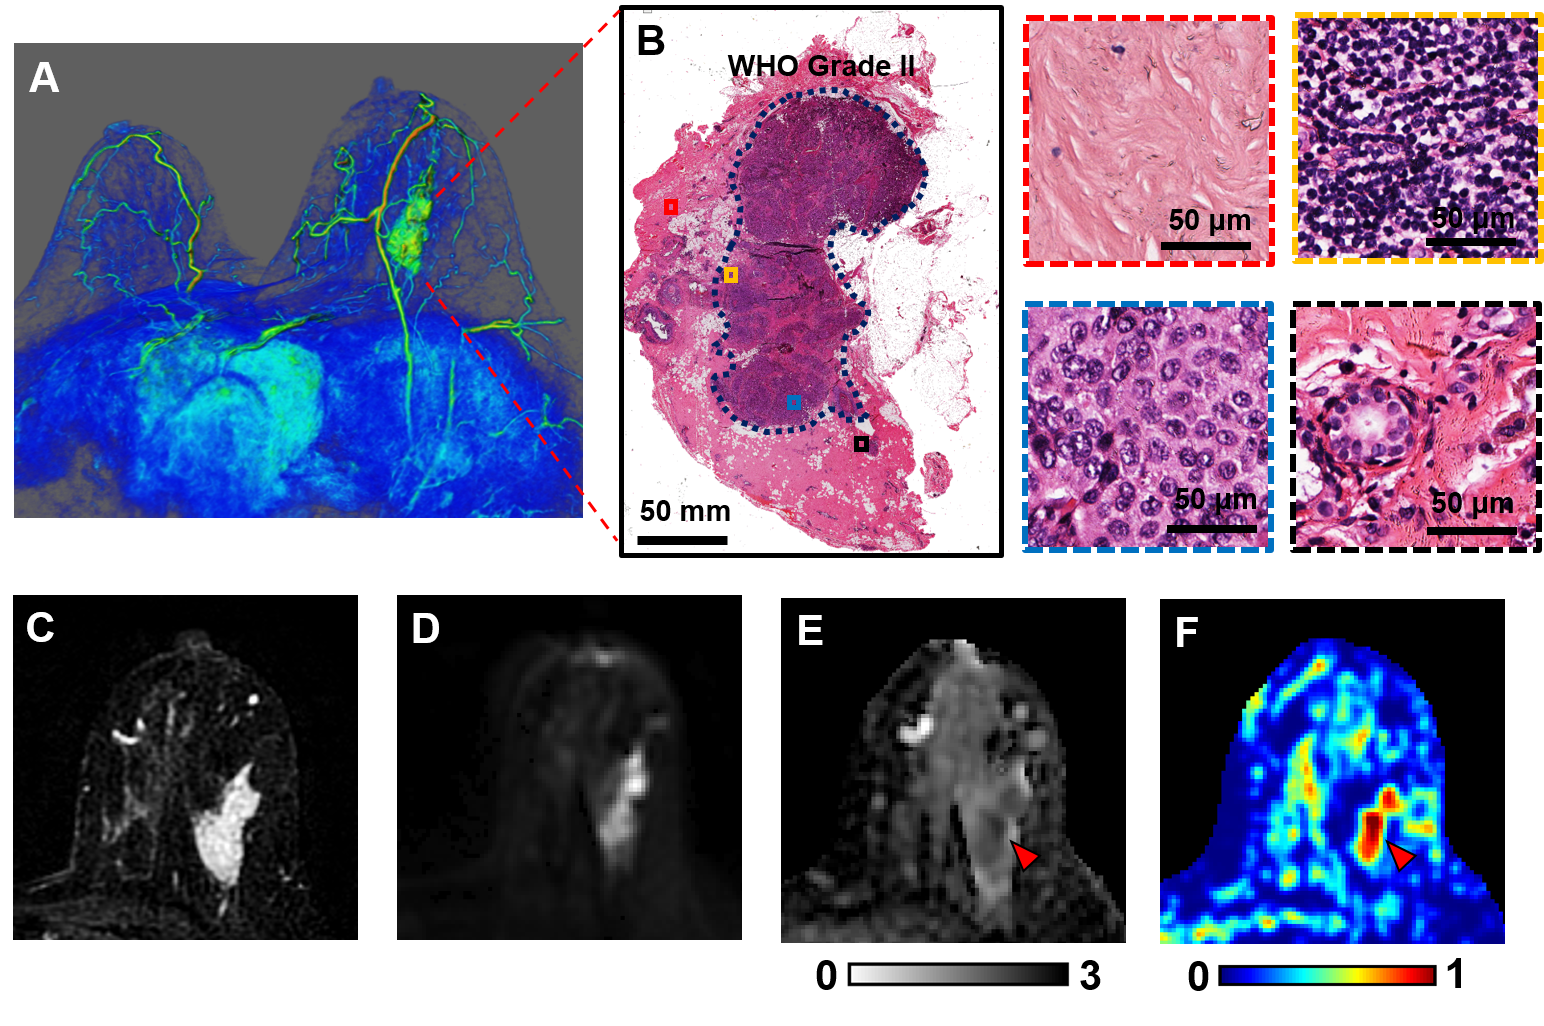
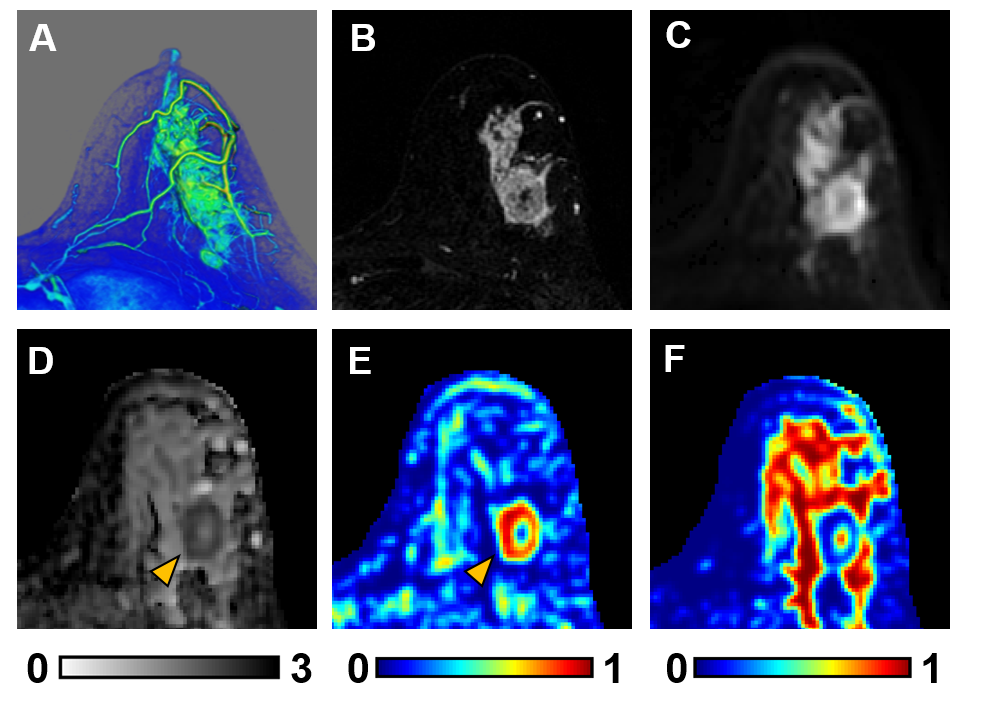
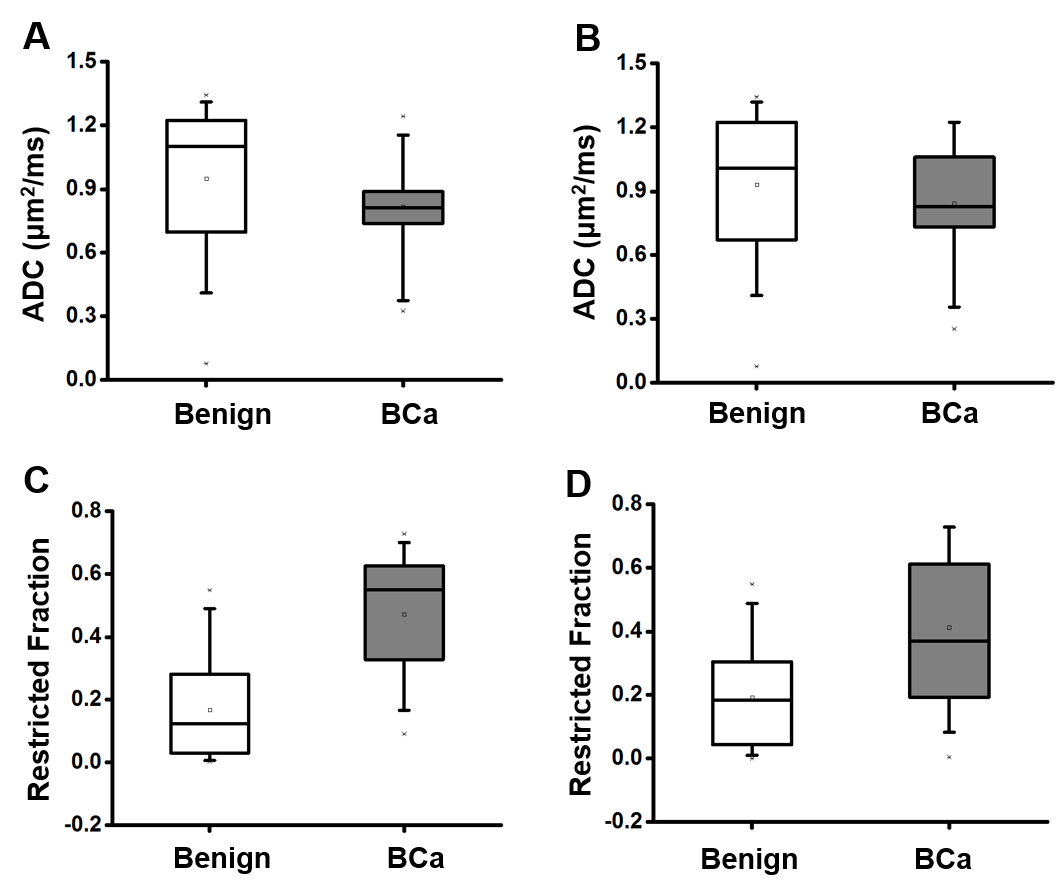
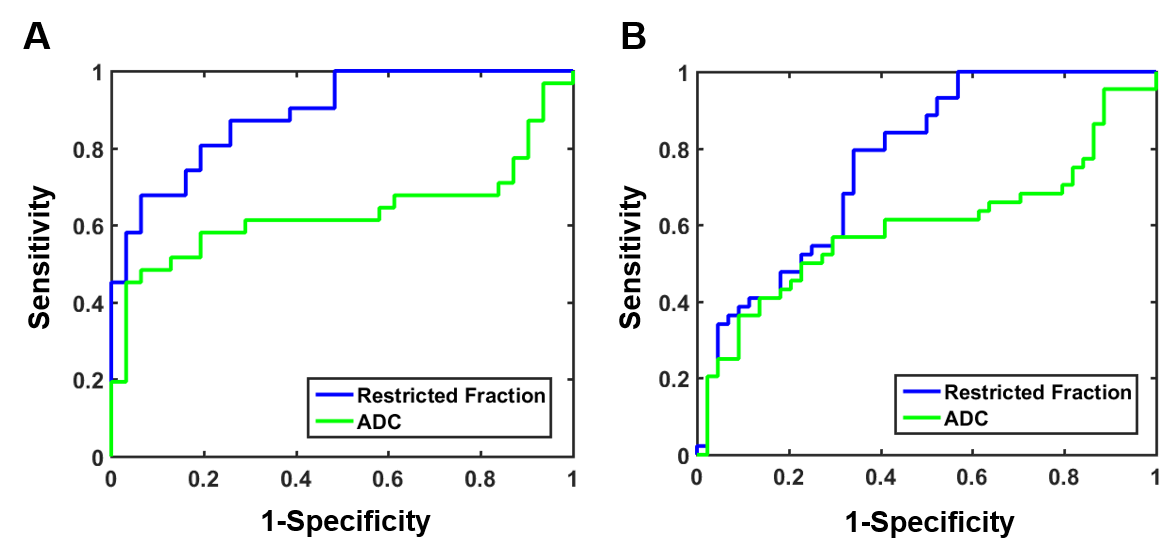
3D reconstruction of Gd-T1WI indicated a tumor nodule in the right breast of a 57-year-old patient with invasive ductal carcinoma (WHO Grade II). Tumor nodule was surgically removed and whole-mount-section was performed. H&E image identified malignant tumor portion in the central part of the nodule (Fig.1B) along with different histopathology including stroma, lymphocytes, high-cellularity tumor and tumor infiltration (Fig. 1B). Gd-enhancement overestimated malignant tumor portion (Fig. 1C) by including peritumoral edema and benign tissues. T2WI and ADC map (Fig. 1D, E) showed ambiguous tumor lesion. D-Histo restriction-fraction indicated high tumor cellularity (Fig. 1F), which is consistent with H&E result. Another representative case is a 53-year-old patient with Grade III invasive ductal carcinoma (Fig. 2A). Gd-enhanced T1WI and T2WI (Fig. 2B, C) images displayed a tumor region larger than lesion indicated by both ADC map and restricted-fraction map (Fig. 2D, E). D-Histo hindered-fraction map also revealed peri-tumoral edema and possible central necrosis (Fig. 2F). In the case of a 39-year-old patient with diffuse large B cell lymphoma (Fig. 3A), lesion areas indicated by Gd-enhanced T1WI, T2WI, ADC map and restricted-fraction map (Fig. 3B, C, D, E) closely resembled each other; the overall high cellularity of lymphoma might explain the consistency. ADC values differed very little between benign tissue and invasive ductal carcinoma (0.95±0.34 vs. 0.82±0.20, p=0.06). Difference of ADC values between benign tissue and all breast tumors (0.93±0.34 vs. 0.84±0.27, p=0.19) were also insignificant. D-Histo restricted-fractions values increased significantly for both invasive ductal carcinoma (0.47±0.18 vs. 0.17±0.16, p<0.0001) and all breast tumors (0.41±0.24 vs. 0.19±0.15, p<0.0001) from that of benign tissue (Fig. 4). ROC analysis of D-Histo and of ADC (Fig. 5) suggested D-Histo restricted-fraction to have greater sensitivity and specificity than ADC to differentiate invasive ductal carcinomas from benign tissue (AUC=0.891 vs. AUC=0.631) and to distinguish between all breast tumors and benign tissue (AUC=0.792 vs. AUC=0.591).Discussion and Conclusion
Gd-enhanced T1WI detects breast cancer with high sensitivity, which comes at the expense of over-diagnosing breast cancer. Gd-contrast agent indiscriminately enhances benign and inflammatory tissues along with malignant lesion. The common leakage of contrast agents into peritumoral edema and adjacent benign tissues also tends to present oversized lesions. ADC was widely used to assess restricted diffusion caused by increased tumor cellularity, although ADC-based diagnoses are prone to false positive diagnosis caused by confounding effects from stroma and inflammation. D-Histo counters these shortcomings by specifically model individual microstructures with their distinct diffusion signatures, allowing an accurate reflection of the population distribution of each microstructure. Here we demonstrated how D-Histo restricted-fraction more accurately delineated breast cancer than other sequences and possesses greater overall sensitivity and specificity than ADC has to distinguish breast tumor from benign tissue.Acknowledgements
No acknowledgement found.References
1. DeSantis CE, Ma J, Goding Sauer A, Newman LA, Jemal A. Breast cancer statistics, 2017, racial disparity in mortality by state. CA: a cancer journal for clinicians. Nov 2017;67(6):439-448.
2. Marino MA, Helbich T, Baltzer P, Pinker-Domenig K. Multiparametric MRI of the breast: A review. Journal of magnetic resonance imaging : JMRI. Jun 22 2017.
3. Wang Y, Wang Q, Haldar JP, et al. Quantification of increased cellularity during inflammatory demyelination. Brain : a journal of neurology. Dec 2011;134(Pt 12):3590-3601.
Figures