4435
Automated data acquisition system for fMRI resting state de-noising1Biomedical Research Imaging Center and Department of Neurology, University of North Carolina at Chapel Hill, Chapel Hill, NC, United States
Synopsis
We have developed an automated system for collecting data from monitoring devices for animal functional MRI (fMRI) research to clean the effects of the physiological nuisance signal. Graphical user interface (GUI) is also provided to make a convenient environment for monitoring animal vital signs on one screen. To demonstrate the system’s usefulness, we perform CBV-based resting-state fMRI and compare the changes of temporal signal-to-noise ratio (tSNR) in the striatum between the before and after end-tidal CO2 (EtCO2) signal correction using RETROICOR algorithm. The software automates the time synchronization among the collected data and will be expanded to automate the noise filtering process.
Introduction
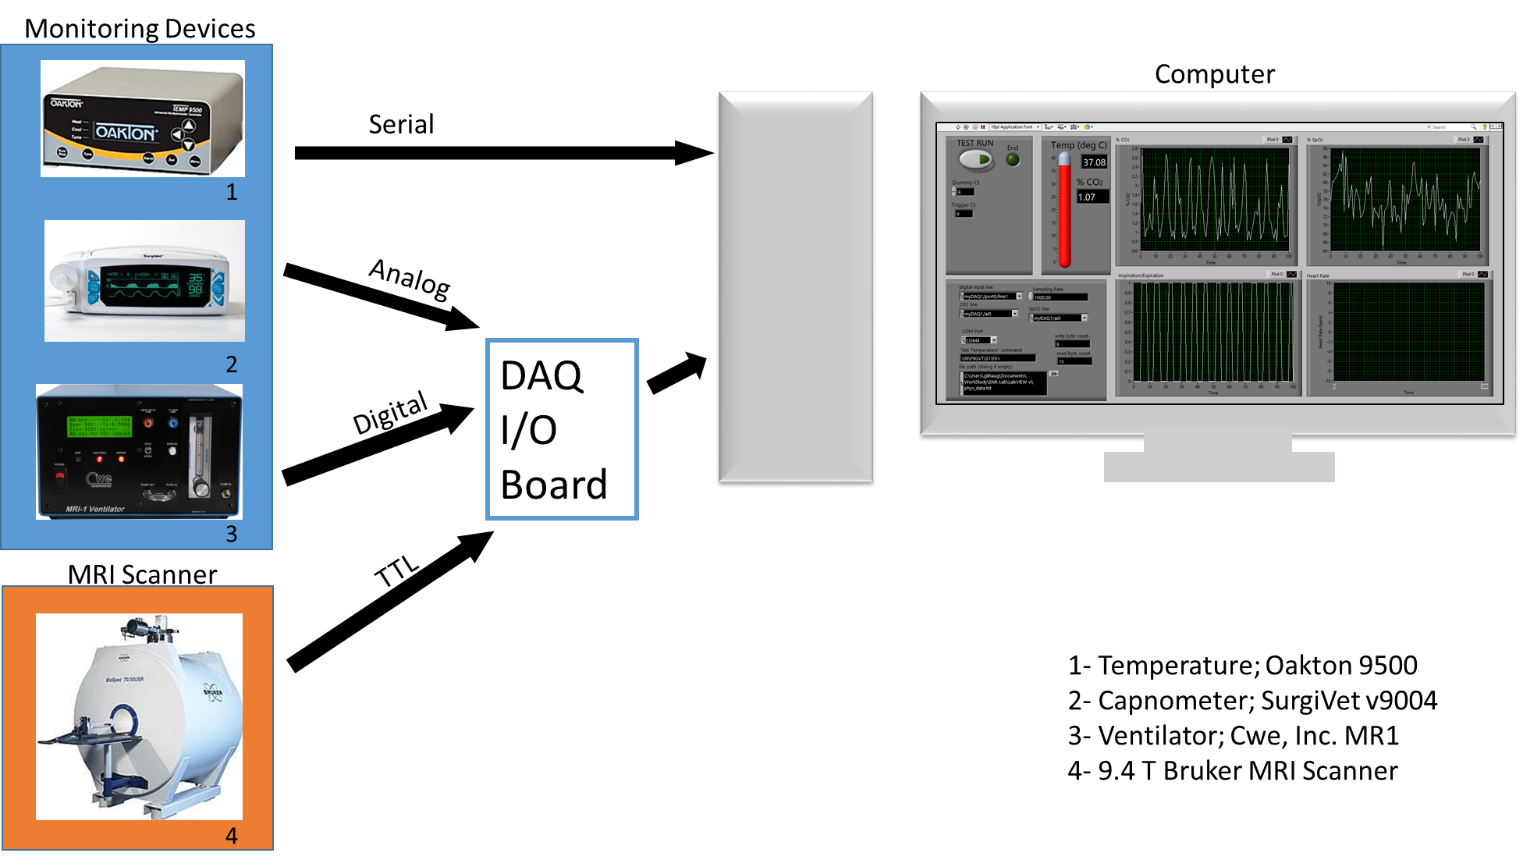
In the small animal fMRI research, multiple devices are used to monitor physiological conditions, including oxygen saturated (SpO2), heart rate, body temperature and EtCO2. Arterial carbon dioxide, heart rate, and blood pressure are sources of noise in the blood oxygenation-level dependent (BOLD) signal,1 and thus recording these signal helps clean out the noise signal from the image data, especially in resting-state fMRI research2,3. Typically, the devices for monitoring these signals are not universally manufactured by one company. A modular and automated platform will allow interfacing with multiple devices for direct data collection without manipulation. Researchers save time, not only in collecting physiological signals but also for monitoring the animal’s condition during the imaging session. In the past, modular, automated platforms have been developed for human and other large animal fMRI.4 However, not many platforms have been made available for small animal fMRI. Here, we focus on the specific need to automate the data collection process in the small animal, resting state fMRI field. A custom-written software (LabVIEW, National Instruments) is tested with a multifunctional data acquisition card (myDAQ, National Instruments) system to interface with several devices from the multiple companies. The GUI is also designed to display physiological data in real-time for monitoring several different physiological signals in real-time on the monitor.Methods
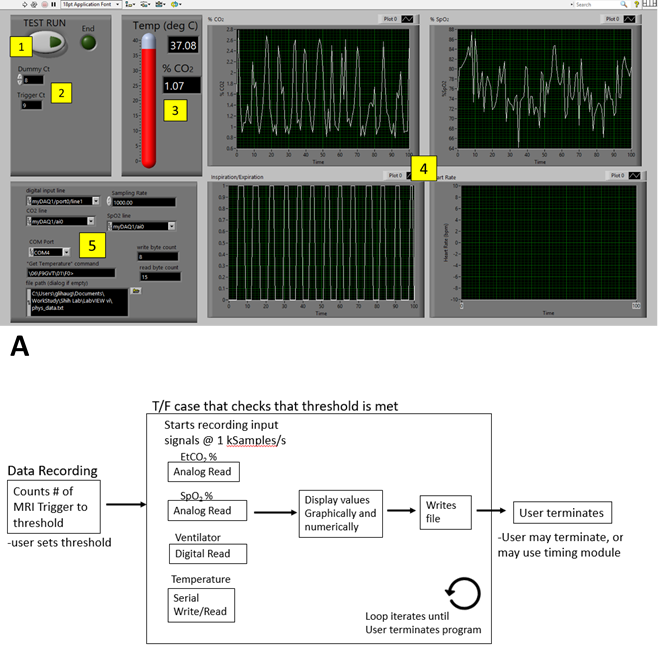
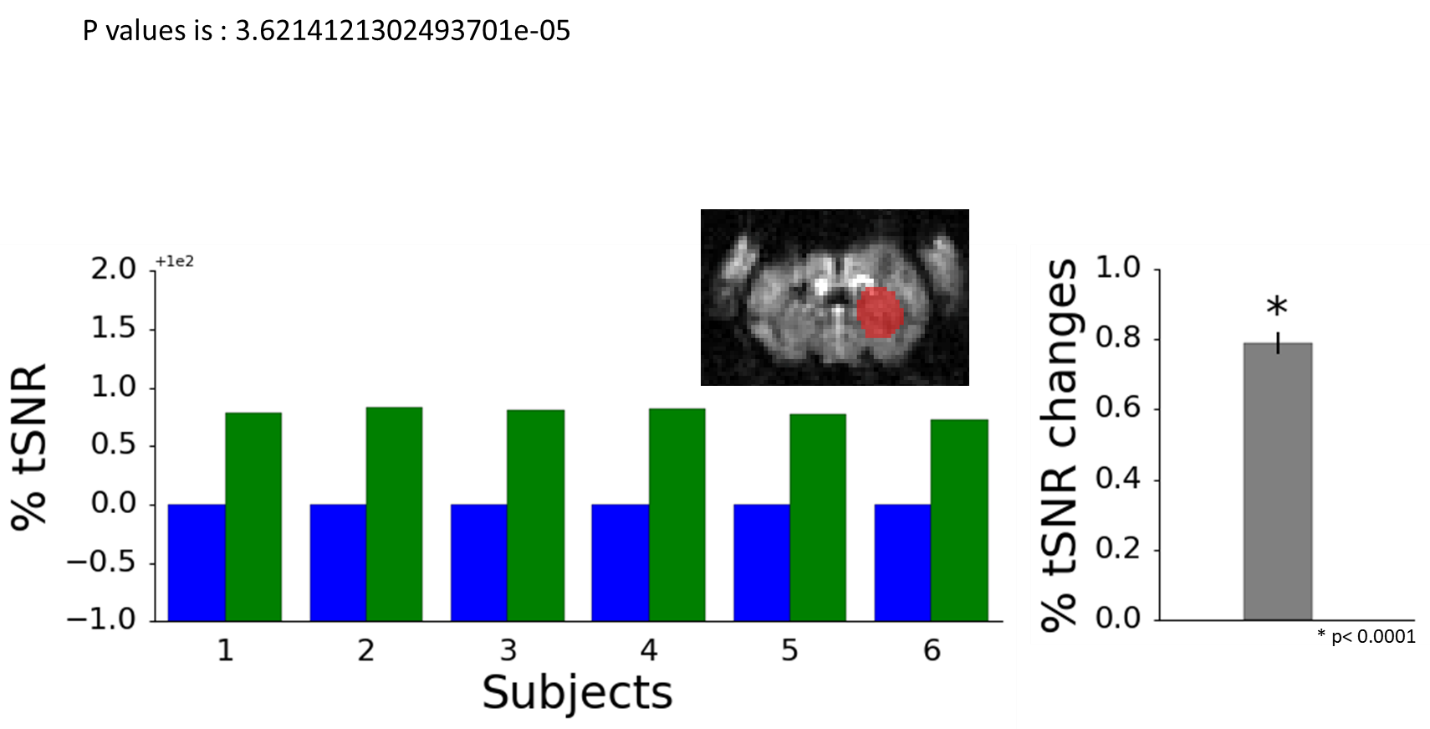
6 Long-Evans rats were used and endotracheal intubation was performed for anesthetizing each animal. The ventilation rate and volume were optimized to maintain 3.0 ± 0.3% EtCO2 levels. Heart rate, body temperature, and SpO2 were continuously monitored and maintained to be 300-350 bpm, 36-37 °C, and >87%, respectively. The TTL output from 9.4 T Bruker scanner triggers approximately every second. Our system begins counting the falling edges as the number of dummy scans before recording the data, and has an additional option to bypass counting the edges. Once the dummy scans have completed, the software proceeds to record and display the data in real-time. In this study, physiological signal, including EtCO2, SPO2, and body temperature were recorded during the imaging session of resting state fMRI (setup shown in Figure 1).The RETROICOR5 method was used to estimate and correct the respiration (EtCO2) signal for presenting an example of using the physiological data for analysis. To compare the data, the striatum mask is manually drawn to define the area of constant intensity in CBV image modality (representative image is provided in Figure 3). The average tSNR in the mask was calculated for each animal, before and after filtering the noise. 250 time points of CBV image are used with 1Hz frequency (250 s). For EtCO2 data, 15000 time points are used (at 60Hz, total 250).Results
All data was displayed in real-time. For analog signals, the data was calibrated to reflect the value on the device. The %EtCO2 and %SpO2 levels were displayed graphically and numerically. The temperature was displayed numerically. (Figure 2) The % EtCO2 parameter was evaluated for its influence on the signal. The program can robustly start recording and display data simultaneously once the system receives the specified number of triggers from the MRI scanner. Comparing the tSNR of the unfiltered to the adjusted signal, the change between the two data sets was statistically significant (p < 0.0001, Figure 3).1,3,4 The mean change in tSNR was calculated to be 0.789 ± 0.320%.Discussion
Although statistically significant, the mean change of tSNR is small, suggesting that controlled respiration could reduce the effect of the nuisance signal due to respiration. Ultimately, this analysis demonstrates the advantage of collecting data from multiple devices simultaneously for analysis that is necessary to extract the signal.Our first prototype automated data collection from multiple devices with synchronization to the MRI scanner. The program will eventually be tested as a standalone application, so that users are not required to purchase a LabVIEW license to run the program. In addition, the program is uploaded to GitHub (https://github.com/glhgit/fmri_physiological_data/upload/master) for others to download and modify. We will also develop an open source software using the Arduino software, so that the program is more accessible to researchers for modification. The program will also be adapted to other configurations such as a stimulation paradigm controlling the laser pulse for optogenetic stimulation6.
Acknowledgements
We thank members of the Shih lab and Matthew Verber from the Chemistry Department at UNC for valuable discussions concerning the studies described in this abstract. Our team is supported by NIMH R01MH111429, R41MH113252, R21 MH106939, NINDS R01NS091236, NIAAA U01AA020023, R01AA025582, NICHD U54HD079124, American Heart Association 15SDG23260025, and Brain & Behavior Research Foundation.References
1. Wise, R. G., Ide, K., Poulin, M. J., & Tracey, I. (2004). Resting fluctuations in arterial carbon dioxide induce significant low frequency variations in BOLD signal. NeuroImage,21(4), 1652-1664. doi:10.1016/j.neuroimage.2003.11.025
2. Kalthoff, D., Seehafer, J. U., Po, C., Wiedermann, D., & Hoehn, M. (2011). Functional connectivity in the rat at 11.7T: Impact of physiological noise in resting state fMRI. NeuroImage,54(4), 2828-2839. doi:10.1016/j.neuroimage.2010.10.053
3. Bright, M. G., & Murphy, K. (2015). Is fMRI “noise” really noise? Resting state nuisance regressors remove variance with network structure. NeuroImage, 114, 158-169. doi:10.1016/j.neuroimage.2015.03.070
4. Purdon, P. L., Millan, H., Fuller, P. L., & Bonmassar, G. (2008). An Open-Source Hardware and Software System for Acquisition and Real-Time Processing of Electrophysiology during High Field MRI. Journal of Neuroscience Methods, 175(2), 165–186. http://doi.org/10.1016/j.jneumeth.2008.07.017
5. Glover, G. H., Li, T., & Ress, D. (2000). Image-based method for retrospective correction of physiological motion effects in fMRI: RETROICOR. Magnetic Resonance in Medicine, 44(1), 162-167. doi:10.1002/1522-2594(200007)44:1<162::aid-mrm23>3.0.co;2-e
6. Laxpati, N. G., Mahmoudi, B., Gutekunst, C., Newman, J. P., Zeller-Townson, R., & Gross, R. E. (2014). Real-time in vivo optogenetic neuromodulation and multielectrode electrophysiologic recording with NeuroRighter. Frontiers in Neuroengineering, 7. doi:10.3389/fneng.2014.00040
Figures