4403
Simplifying the Numerical Human Model with k-means Clustering Method1Center for Devices and Radiological Health, US Food and Drug Administration, Silver Spring, MD, United States
Synopsis
Currently, the safety assessment of radio-frequency (RF) heating in computational modeling is limited by the available numerical models which are not patient-specific although RF-induced heating depends on the physical characteristics of the patient. The numerical model generation is difficult due to the highly time-consuming segmentation process. Therefore, having fewer types of segmented structures simplifies the generation of numerical models. In this study, we used the k-means clustering method to reduce the number of dielectric properties of an existing numerical model and investigated the resulting difference in SAR with respect to the number of clusters.
Introduction
Computational modeling is widely used to assure patient safety with respect to radio-frequency (RF)-related concerns during Magnetic Resonance Imaging (MRI). It allows for evaluation of RF power absorption and specific absorption rate (SAR) in anatomically detailed numerical human models with implantable devices.
Different anatomically realistic numerical models are available for device safety evaluation. Thus it is ideal to have a personalized anatomical model since RF-induced heating depends on the physical characteristics of the patient1; however, the time-consuming model generation process prevents achieving a realistic safety evaluation.
Currently available whole-body numerical models have 26 to 77 anatomical structures2-5. A previous study showed that three different dielectric properties (muscle, fat and lung) were sufficient to estimate SAR with a 5mm resolution6; yet devices with dimensions of less than 5mm can be implanted in very thin anatomical structures. Thus, a model with higher spatial resolution may be needed for RF-induced heating evaluation. Moreover, a study using a higher resolution model showed that the blood vessel SAR can be up to ten times higher than the maximum standard gel phantom SAR value7. Knowing the limits of simplification in a numerical model can help not only by reducing the time needed for segmentation but also to fabricate a standard phantom which can accurately reflect the in-vivo result.
In this study, we used the k-means clustering method to reduce the number of anatomical structure types with different dielectric properties in a detailed human model and investigated the resulting difference in SAR with respect to the number of clusters.
Methods
The simulations were performed at 128 MHz with the AustinMan model5 at the hip bone landmark on the Sim4Life platform (Zurich Med Tech, Switzerland) based on the finite-difference time-domain method. A 32-port 16-leg birdcage coil with idealized excitation was modeled with 700mm in length and 650mm in diameter. The Huygens’ Approach8 was applied to facilitate a fair comparison between full and simplified models. The incident field was calculated with an unloaded coil first, then used to compute fields within body models, with 1mm isotropic grid.
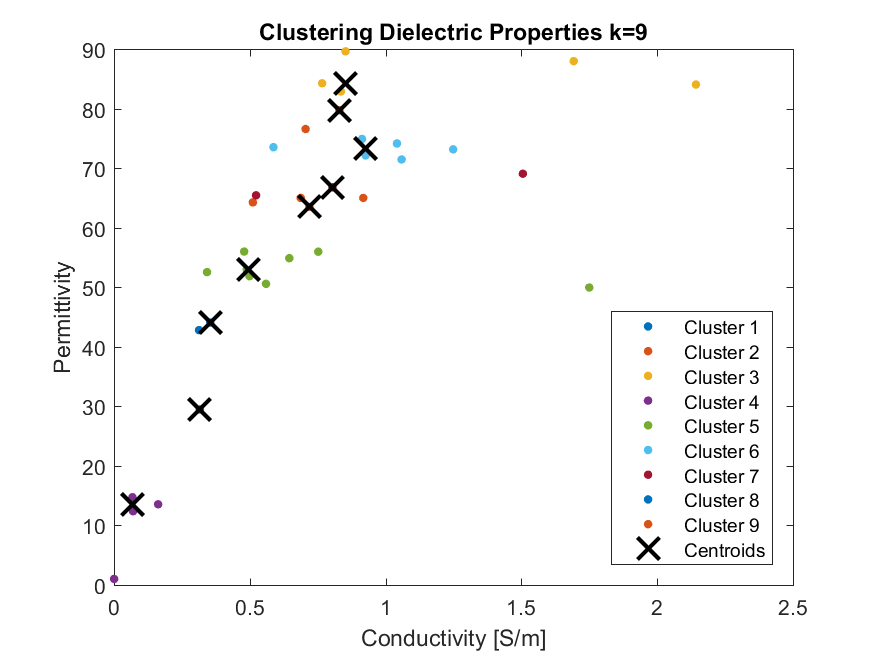
The k-means clustering was applied on the electrical conductivity and permittivity of anatomical structures of the AustinMan model in MATLAB (The MathWorks Inc., USA). Ten models with different dielectric property configurations were used in the simulations: one full model with the original 51 different dielectric properties and nine models with varying number of dielectric properties (k=33,30,27,24,21,18,15,12 and 9). The total sum of distances was used as a distance measure, and the model with 33 clusters was chosen as a starting point because the distance was less than 0.5 for number of clusters above 34.
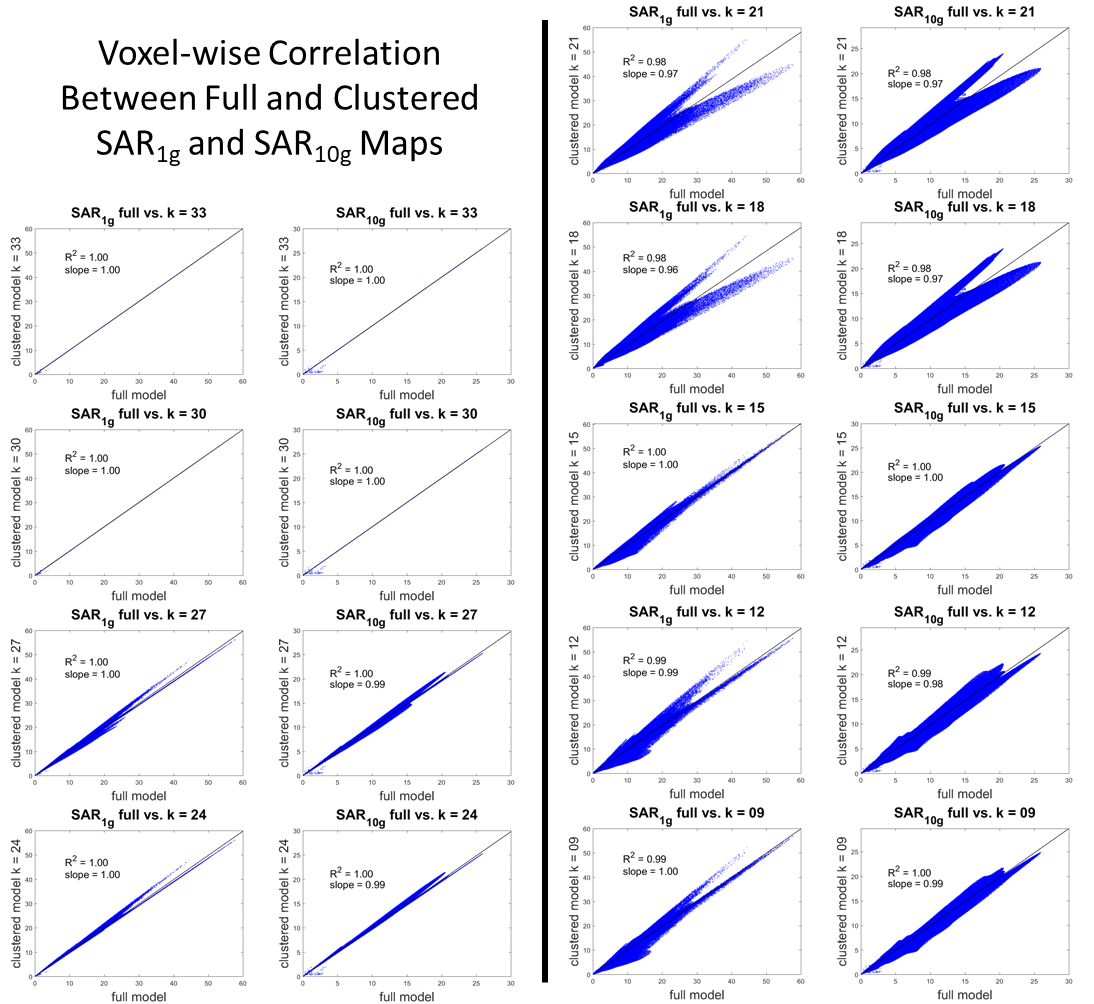
The single-voxel SAR (SARraw), 1g-averaged SAR (SAR1g) and 10g-averaged SAR (SAR10g) results were compared by calculating the mean and maximum percentage difference between the full model and the clustered models. Voxel-wise comparison of each pair was performed with the linear fitting of the SAR values. All SAR values were computed with original mass density values of the model and normalized to a whole-body averaged SAR equal to 2W/kg9.
Results
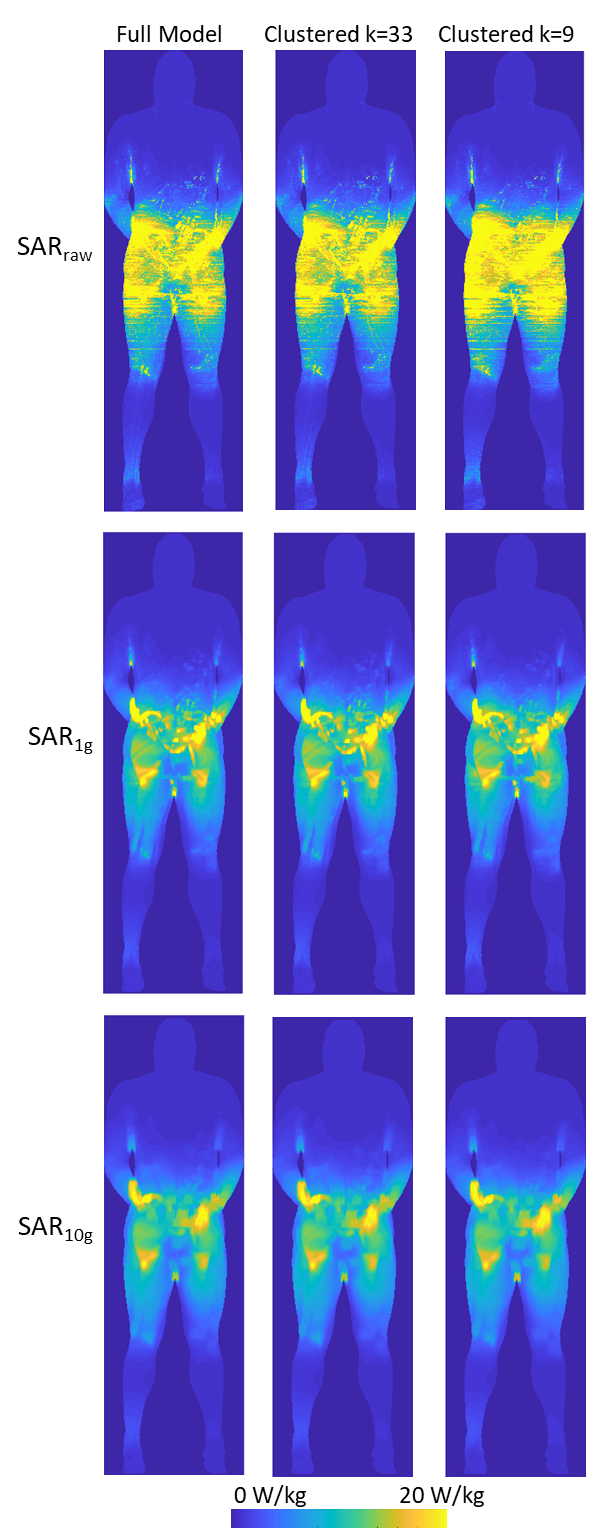
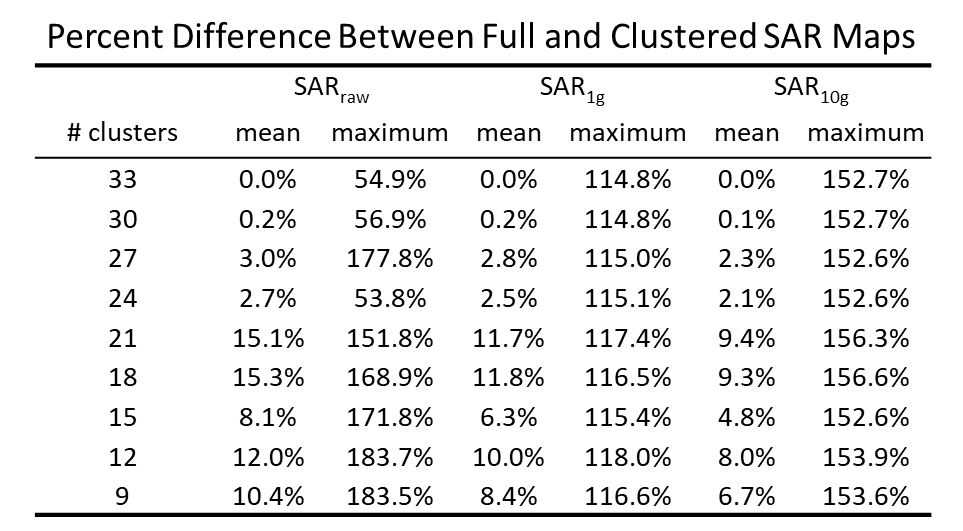
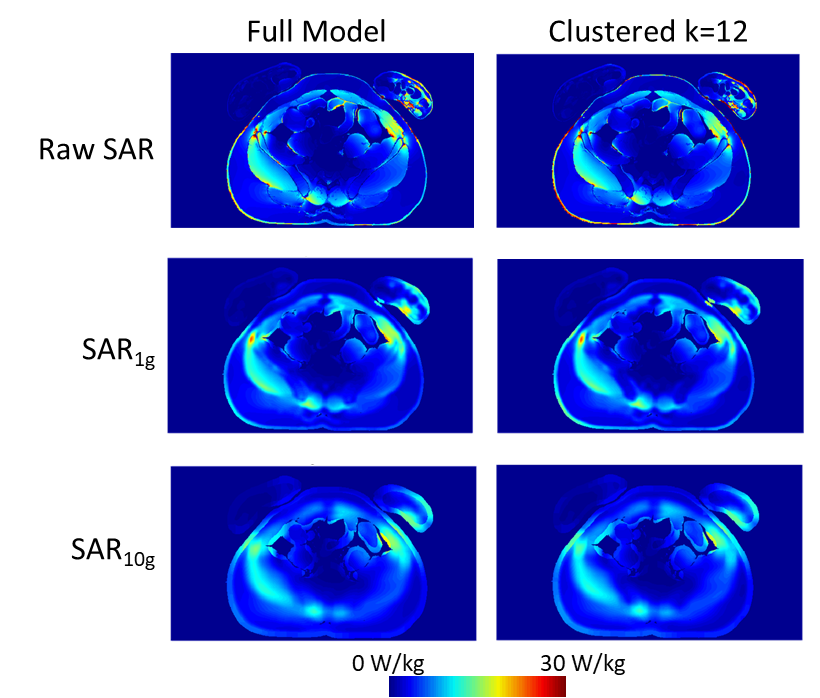
The values of dielectric properties for each k-clustered model were determined by the k centroids (Fig.1). The maximum intensity projection of each SAR map showed that SARraw values were higher when computed with the 9-clustered model. The SAR1g and SAR10g maps were similar among different models regardless of numbers of dielectric properties used (Fig.2). The mean and maximum percentage difference (Table 1) revealed that there was up to a 15.3% mean SAR difference. The cross-sectional SAR maps showed that the 12-clustered models estimated higher SAR values compared to the full model (Fig.3). Scatter plots of SAR values from the full model against from each clustered model revealed that all the clustered models showed high correlations with the full model (Fig.4).Discussion
The clustered analysis showed that reducing the number of dielectric properties from 51 (original) to 30 has less than 0.2% effect on the SAR results. Even by further decreasing the number of dielectric properties, the mean SAR differences were less than 15.3%. Each voxel pair between the full and the 30-clustered SAR values was highly correlated.
We focused on the hip bone landmark in this study. The optimal number of clusters may change depending on the imaging landmark. Also, our k-means clustering approach was only based on dielectric properties. Incorporating the location of the dielectric property may help improving the clustered models.
Conclusion
Simplified numerical models can show equivalent SAR result. More investigation of clustering method may enable accurate MRI safety assessment by simplifying the model generation for a personalized SAR estimation.Acknowledgements
The mention of commercial products, their sources, or their use in connection with material reported herein is not to be construed as either an actual or implied endorsement of such products by the Department of Health and Human Services.
This work was supported by the Research Participation Program at the Center for Devices and Radiological Health administered by the Oak Ridge Institute for Science and Education through an inter-agency agreement between the U.S. Department of Energy and the U.S. Food and Drug Administration.
References
- Murbach M, Cabot E, Neufeld E, et al. Local SAR enhancements in anatomically correct children and adult models as a function of position within 1.5 T MR body coil. Prog Biophys Mol Biol, 2010; 107(3):428-433.
- Christ A, Kainz W, Hahn EG, et al. The Virtual Family—development of surface-based anatomical models of two adults and two children for dosimetric simulations. Phys Med Biol. 2010; 55: N23–38.
- Nagaoka T, Watanabe S, Sakurai K, et al. Development of realistic high-resolution whole-body voxel models of Japanese adult males and females of average height and weight, and application of models to radio-frequency electromagnetic-field dosimetry, Phys Med Biol, 2004; 49:1-15.
- Visible Human Project: https://www.nlm.nih.gov/research/visible/visible_human.html. Accessed October 28, 2017.
- Massey JW, Yilmaz AE. AustinMan and AustinWoman: High-Fidelity, anatomical voxel models developed from the VHP color images. Conf Proc IEEE Eng Med Biol Soc 2016: 3346-3349.
- Homann H, Börnert P, Eggers H, et al. Toward individualized SAR models and in vivo validation. Magnetic resonance in medicine, 2011; 66(6):1767-1776.
- Fujimoto K, Angelone LM, Lucano E, et al. Conf. Proc. BMES/FDA 2017.
- Benkler, S., Chavannes, N., Kuster, N. Novel FDTD Huygens source enables highly complex simulation scenarios on ordinary PCs. Conf Proc IEEE APSURSI, 2009: 1-4.
- IEC 60601-2-33, Magnetic Resonance Equipment for Medical Diagnosis Testing, 2010.
Figures