4402
Validation of numerical simulation of susceptibility artifact and the consequences for artifact size calculation of the current ASTM standard F21191MR:comp GmbH Testing for MR Satety & Compatibility, Gelsenkirchen, Germany, 2MRI-STaR-(Magnetic Resonance Institute for Safety, Technology and Research GmbH), Gelsenkirchen, Germany
Synopsis
The ASTM standard F2119 provides evaluation methods for the artifacts of medical implants in a well-defined test environment. In our work we had validated a numerical simulation of MR susceptibility artifacts according to this standard. Based on this simulation, the calculation methods of the artifact size in the ASTM standard were evaluated to show the limitation of the current methods.
Introduction
The presence of metallic implants prevents an exact diagnosis in an MR examination. To characterize these implant-specific artifacts the ASTM standard F2119 [1] provides an evaluation method for medical implants in a well-defined test environment. However, this test method has limitations. The focus of our work is the validation of a numerical simulation based on the ASTM standard and the consequences for the calculation of the artifact size.Method
Simulation:
The simulation was performed using JEMRIS [2]. A voxelized model of a cubic phantom was defined and the test object (TO) was placed perpendicular to the static magnetic field in the center of the phantom. The volume of the whole phantom was simulated and the slice with the biggest artifact was chosen. The simulation applied gradient echo and spin echo sequences according to the standard [1].
Validation:
For the validation of the simulation, an MR measurement and a simulation focusing on the susceptibility artifacts [3], [4] of a titanium rod were performed. The artifact of the simulated and the measured image was calculated and superimposed to comparing the two artifacts pixel by pixel. The measure for the similarity of the images was the fraction of the congruent pixel divided by all pixels of the artifacts.
Artifact size:
Two different methods for calculation of the artifact size were applied to the simulated data. The first method is the primary method of the ASTM standard. This requires precise knowledge of the position of the TO inside the artifact area which allows a calculation of the distance from the edge of the TO to every pixel in the artifact. However, often the edge of the object is not visible which prevents the application of this method in practice. Therefore, the alternative method of the ASTM standard suggests to assume the TO in the center of the artifact [1]. Based on this, the artifact size was calculated as the half difference between the maximum artifact extension and the size of the TO in the corresponding direction. Artifact size was determined for the horizontal and vertical direction.
Results
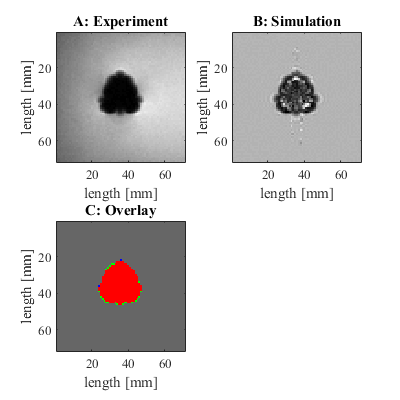
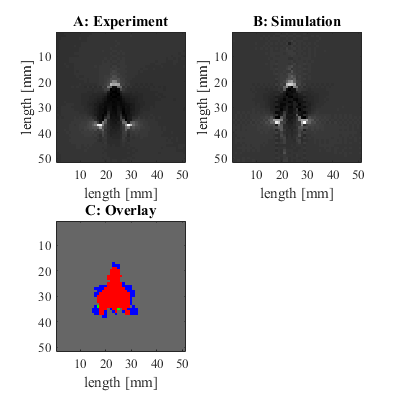
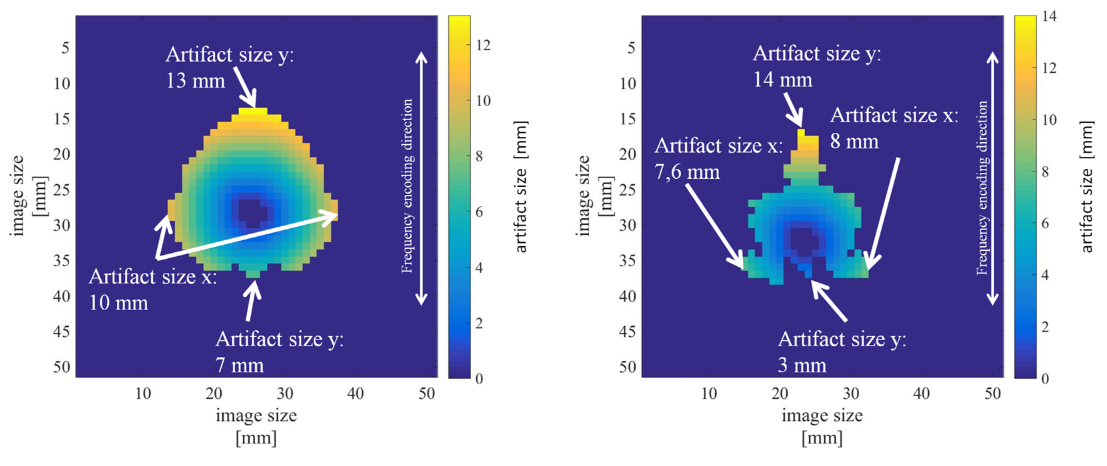
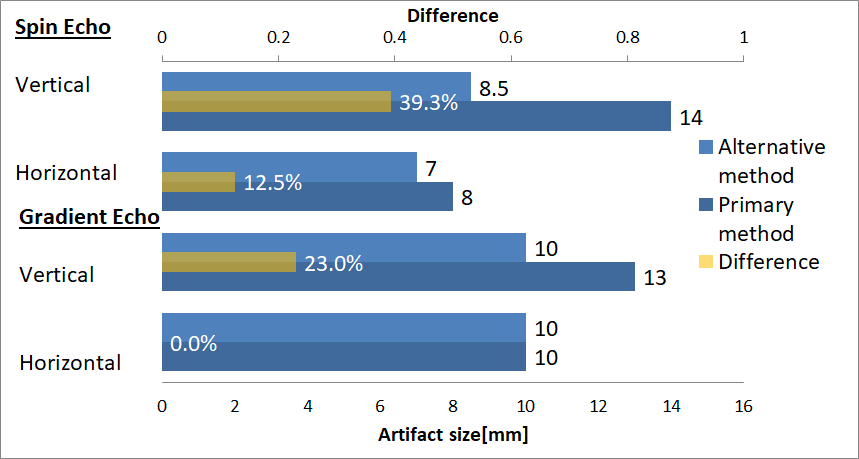
Figure 1A and 1B shows nearly the same shape of the artifact for the simulated and the measured gradient echo image but the simulated image shows some white areas within the artifact. Furthermore, figure 2 shows the same shape and distribution of brightness for the simulated and measured spin echo images. The superimposed image (fig. 1C) of the artifacts of the gradient echo images shows a high congruence (represented by the red area) of the simulated and measured images with a similarity factor of 0.94. Figure 2C shows a lower congruence of the two artifacts with a similarity factor of 0.69 for the spin echo sequences. A comparison of the different artifacts sizes in figure 1C shows that the meausred artifact area is bigger than the simulated area which is shown by the green pixels. In contrast to that, the spin echo sequence shows a bigger artifact for the simulated image (represented by blue pixels). Figure 3 shows the artifacts of the simulated gradient and spin echo image. The color coding in the images represents the distance from TO to the corresponding pixel in the artifact and the maximum artifact size in two directions are presented in fig. 4. The gradient echo sequence has a difference of 23.0% and the spin echo sequence has a difference of 39.3% between the artifact sizes of the two different methods in vertical direction.Discussion
The validation process shows a high similarity for the shape of the artifact in the gradient echo image. However, the spin echo sequence shows a lower similarity which could be caused by the lower artifact area and problems with the superimposition of the TO orientation between the measured and simulated image. The calculation of the artifact size shows a different result for the alternative method. This is caused by the non-symmetric position of the TO in the artifact along the frequency-encoding direction. This leads to an underestimation of the artifact size compared to its real size.Conclusion
In our work, we show that the simulation of susceptibility artifacts provides realistic MR artifacts for the spin and gradient echo sequences according to the ASTM standard. Based on this simulation, limitations of the calculation methods of the artifact size are shown. This demonstrates the necessity for the development of new calculation methods for the next version of the ASTM standard. The simulations of the MR artifacts are a powerful tool which allows a detailed validation of the new calculation methods.Acknowledgements
No acknowledgement found.References
[1] ‘ASTM F2119-07(2013) Standard Test Method for Evaluation of MR Image Artifacts from Passive Implants’. 2013.
[2] T. Stöcker, K. Vahedipour, D. Pflugfelder, and N. J. Shah, ‘High-performance computing MRI simulations’, Magn. Reson. Med., vol. 64, no. 1, pp. 186–193, Jul. 2010.
[3] C. J. Bakker, R. Bhagwandien, M. A. Moerland, and L. M. Ramos, ‘Simulation of susceptibility artifacts in 2D and 3D Fourier transform spin-echo and gradient-echo magnetic resonance imaging’, Magn. Reson. Imaging, vol. 12, no. 5, pp. 767–774, 1994.
[4] J. F. Schenck, ‘The role of magnetic susceptibility in magnetic resonance imaging: MRI magnetic compatibility of the first and second kinds’, Med. Phys., vol. 23, no. 6, pp. 815–850, Jun. 1996.
Figures