4394
Platform for Validating pTx RF Coil Simulations Using Proton Resonance Frequency Shift MR Thermometry1Wellcome Centre for Integrative Neuroimaging, FMRIB, University of Oxford, Oxford, United Kingdom, 2Laboratory of Imaging Technology, Biochemistry and Biophysics Centre, NHLBI, NIH, Bethesda, MD, United States, 3Department of Cardiovascular Medicine, British Heart Foundation centre of research excellence, University of Oxford, Oxford, United Kingdom
Synopsis
We propose a workflow to validate parallel transmission (pTx) RF heating patterns using Proton-Resonance Frequency shift (PRF)-based MR thermometry. An agar+polyethylene powder cylindrical phantom, with similar dielectric properties to the human brain at 297.2 MHz, was designed to assess an 8-channel dipole array. RF heating was evaluated and compared between PRF-based MR thermometry, fibre optic probe measurement, and thermal simulation. The PRF reconstruction procedure was optimized to reduce artefacts. Given the importance of RF safety in pTx applications, this method enables accurate validation of RF heating simulations with minimal additional hardware requirements.
Introduction
Parallel transmit at 7T poses an RF safety challenge due to the potential for high local SAR coupled with the complexities of predicting SAR a priori. There is a need to validate pTx systems beyond EM simulation given the possibility that the simulation model does not accurately represent the physical coil. Other work has investigated SAR validation via PRF-based MR thermometry1. Previously, limitations to thermometry in SAR validation included compensation for B0 drift and artefacts in the phase maps from B1+ signal voids. However, these limitations can be overcome by combining thermometry, fibre optic probe temperature monitoring, a dummy stabilization scan, and a dual mode B1+ shim. By applying these techniques, we present a test procedure that provides accurate 3D temperature maps that could appropriately validate a generic pTx array.Methods
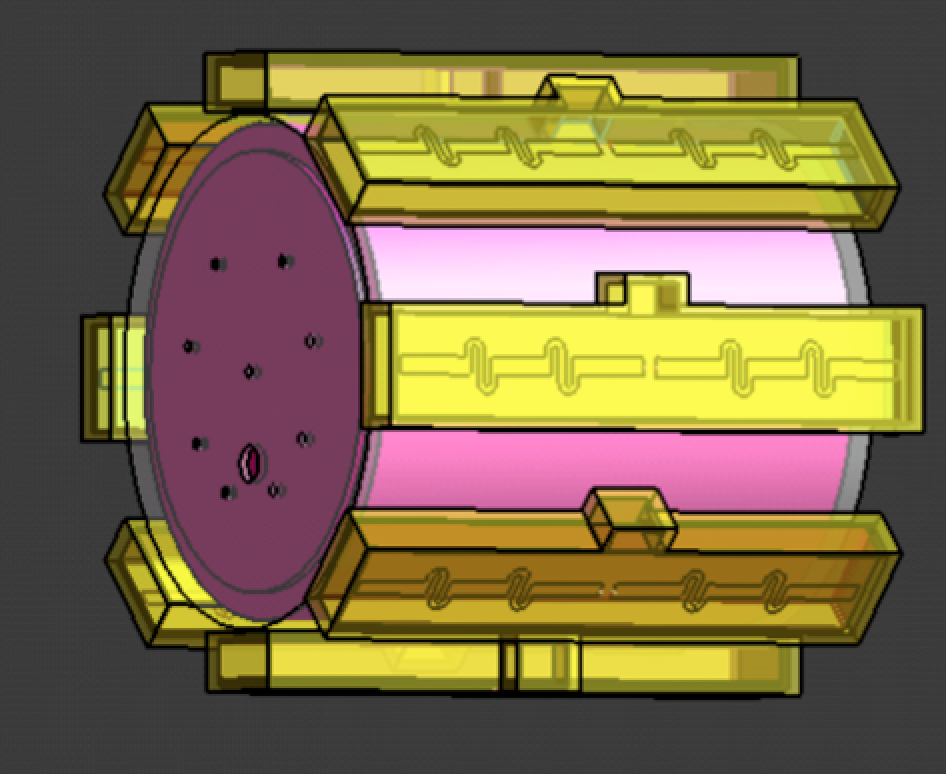
An agar+polyethylene powder (20% PE) cylindrical phantom, with similar dielectric properties to the human brain at 297.2 MHz (εr: 47.76, σ: 0.62 S/m)2,3 was designed to assess a 7T 8-channel dipole array (MR Coils, Utrecht, Netherlands) (Fig. 1). Imaging was performed using a human 7T scanner (Siemens, Germany). Experiment: PRF-based RF heating was measured in the phantom using a 3D GRE sequence, modified to deposit either 0 W or 10 W average power at 10 kHz off resonance on a specified channel of the pTx coil. To achieve robust phase maps over the whole phantom two interleaved RF shim modes were acquired, one in circularly polarised (CP) mode, and one with zero phase on all elements. The PRF sequence had an acquisition resolution of 5x5x10 mm3 and matrix 64x64x32 with elliptical k-space coverage (TR = 14 ms, and TEs ranging from 1.08 ms to 9.26 ms in steps of 2.04 ms, acquiring one dual shim volume pair every 44s). To monitor and calibrate potential B0 field drift due to gradient coil heating, 60 volumes were acquired without RF heating and absolute temperature changes were monitored using a two-channel fibre optic probe (Neoptix, Canada). To assess RF heating, 30 volumes were acquired with no heating, followed by 30 volumes with continuous heating on a single channel of dipole array. A flip angle map was acquired using a pre-pulse method (Siemens-WIP543, TR/TE:10s/1.97ms). Data processing: Channels were combined using receive sensitivities determined by singular value decomposition along all echoes and repetitions4. The echoes were combined by conjugate multiplication of pairs (1-to-2, 2-to-3, 3-to-4, 4-to-5) and averaged. Finally, PRF thermometry values were calculated using the phase difference between the average of two no-heating images and each active-heating image (α: -0.01 ppm/°C)5. The flip angle map was converted to B1 transmit field per unit voltage (μT/V). Simulation: Sim4Life (ZMT, Switzerland) was used to solve Maxwell’s equations in the time-domain, yielding E-field and SAR distributions. The package’s bio-heat equation was then used to simulate the heating profile, using a specific heat capacity assigned from the literature3, and a thermal conductivity calculated from the measured thermal diffusivity (Cp= 3600 J/kg/K, k=0.463W/m/K).Results
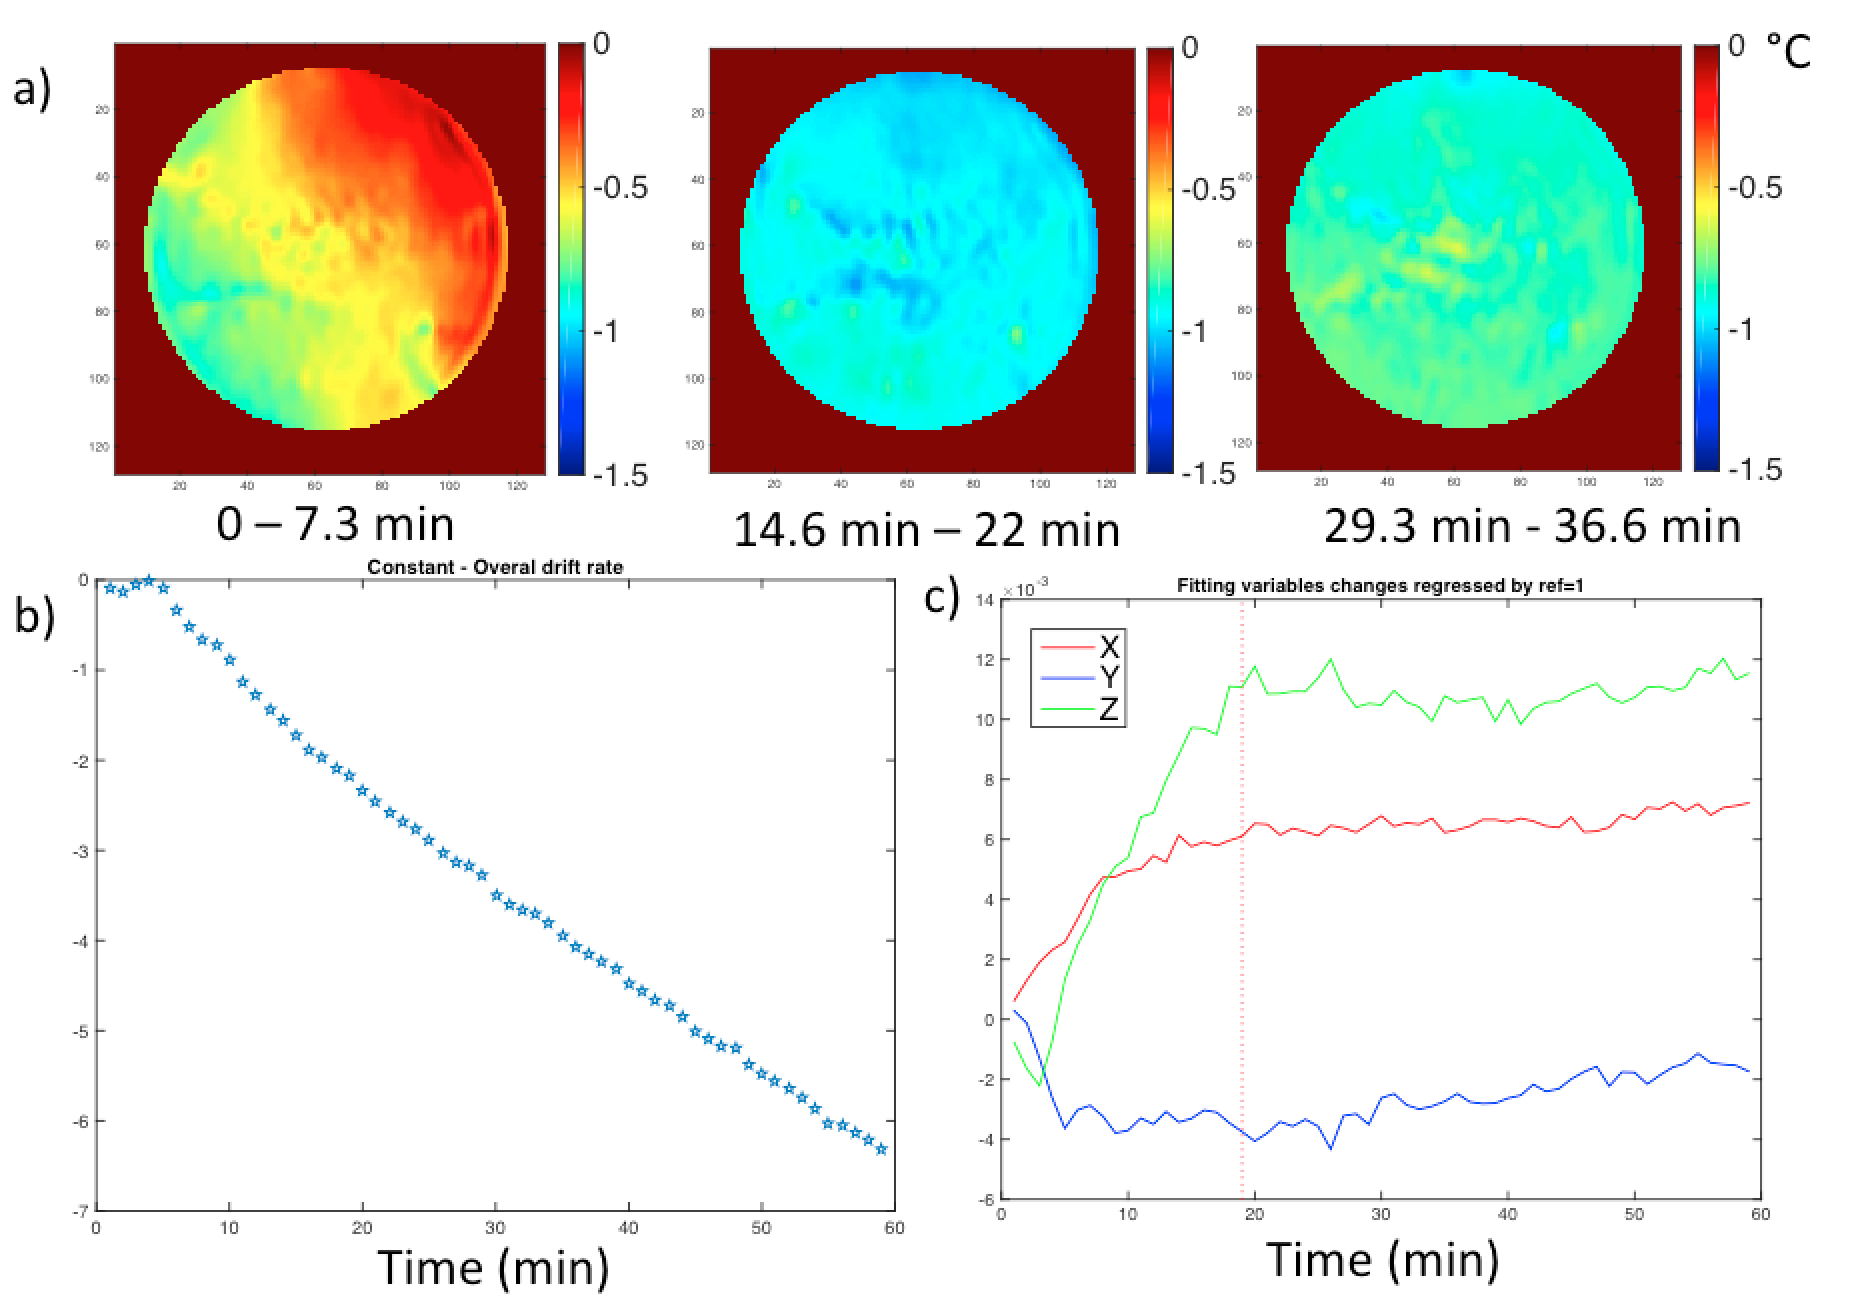
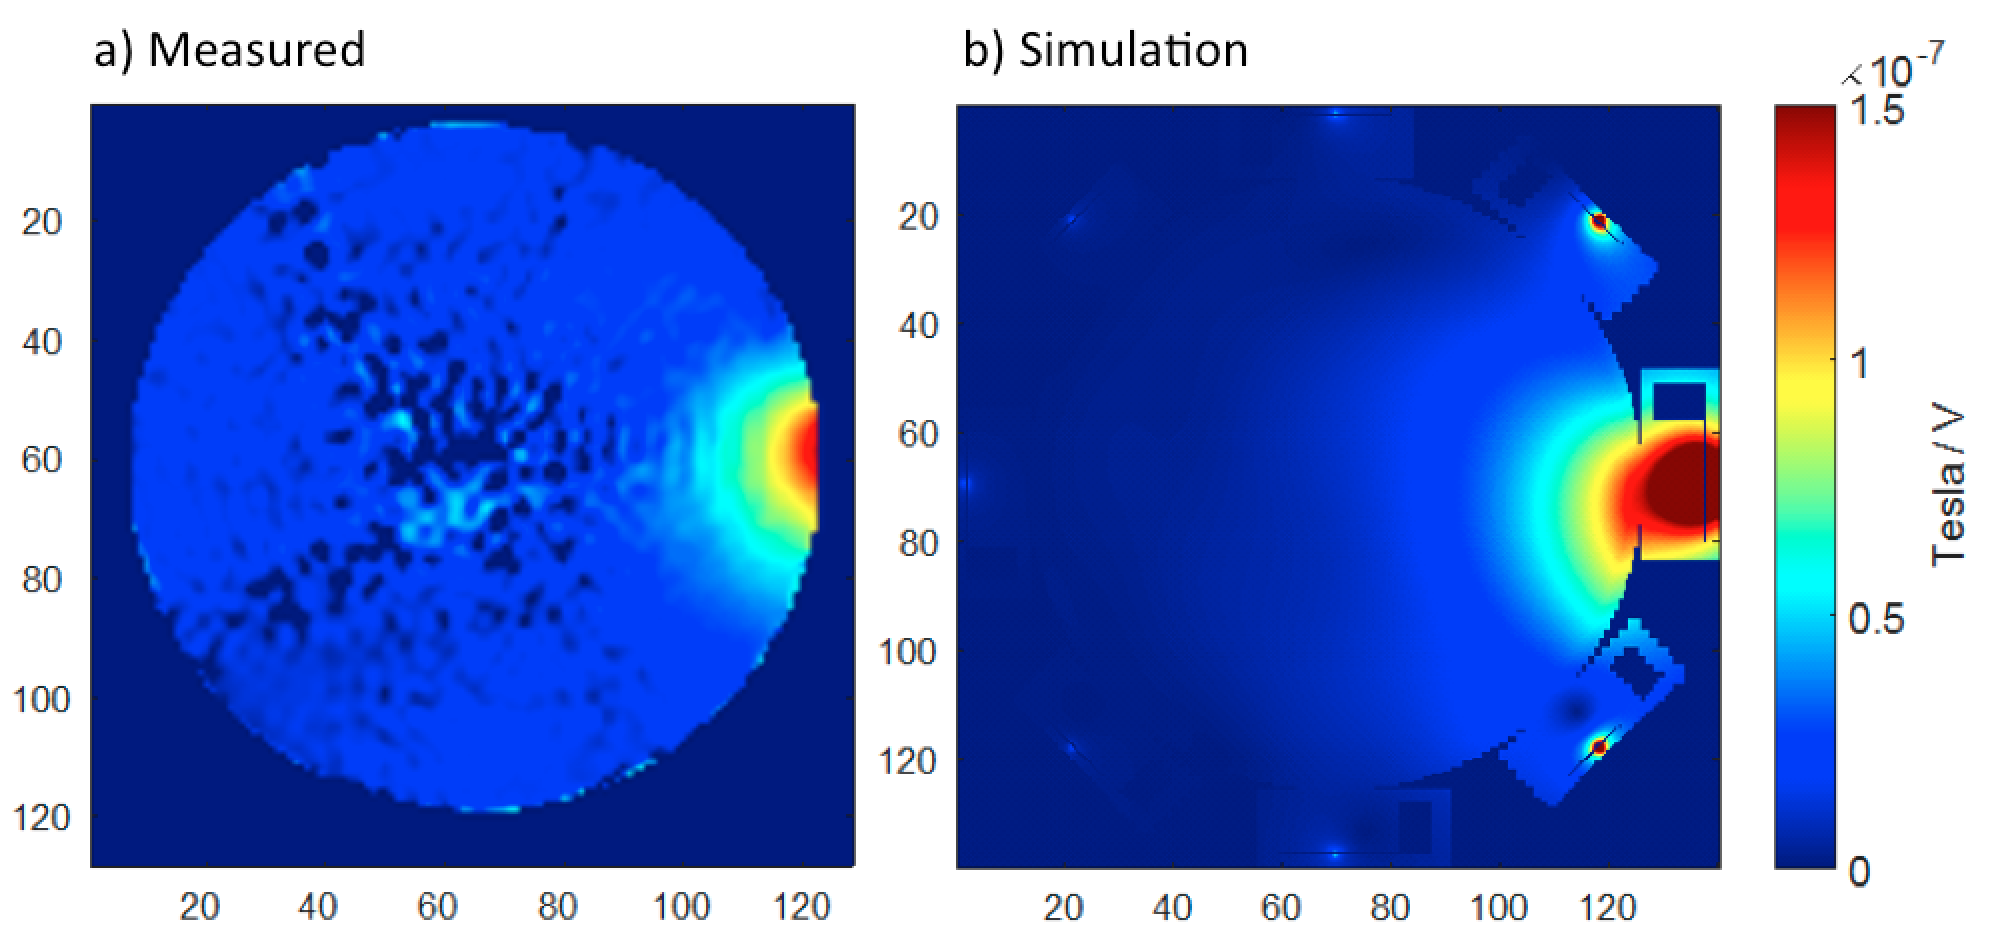
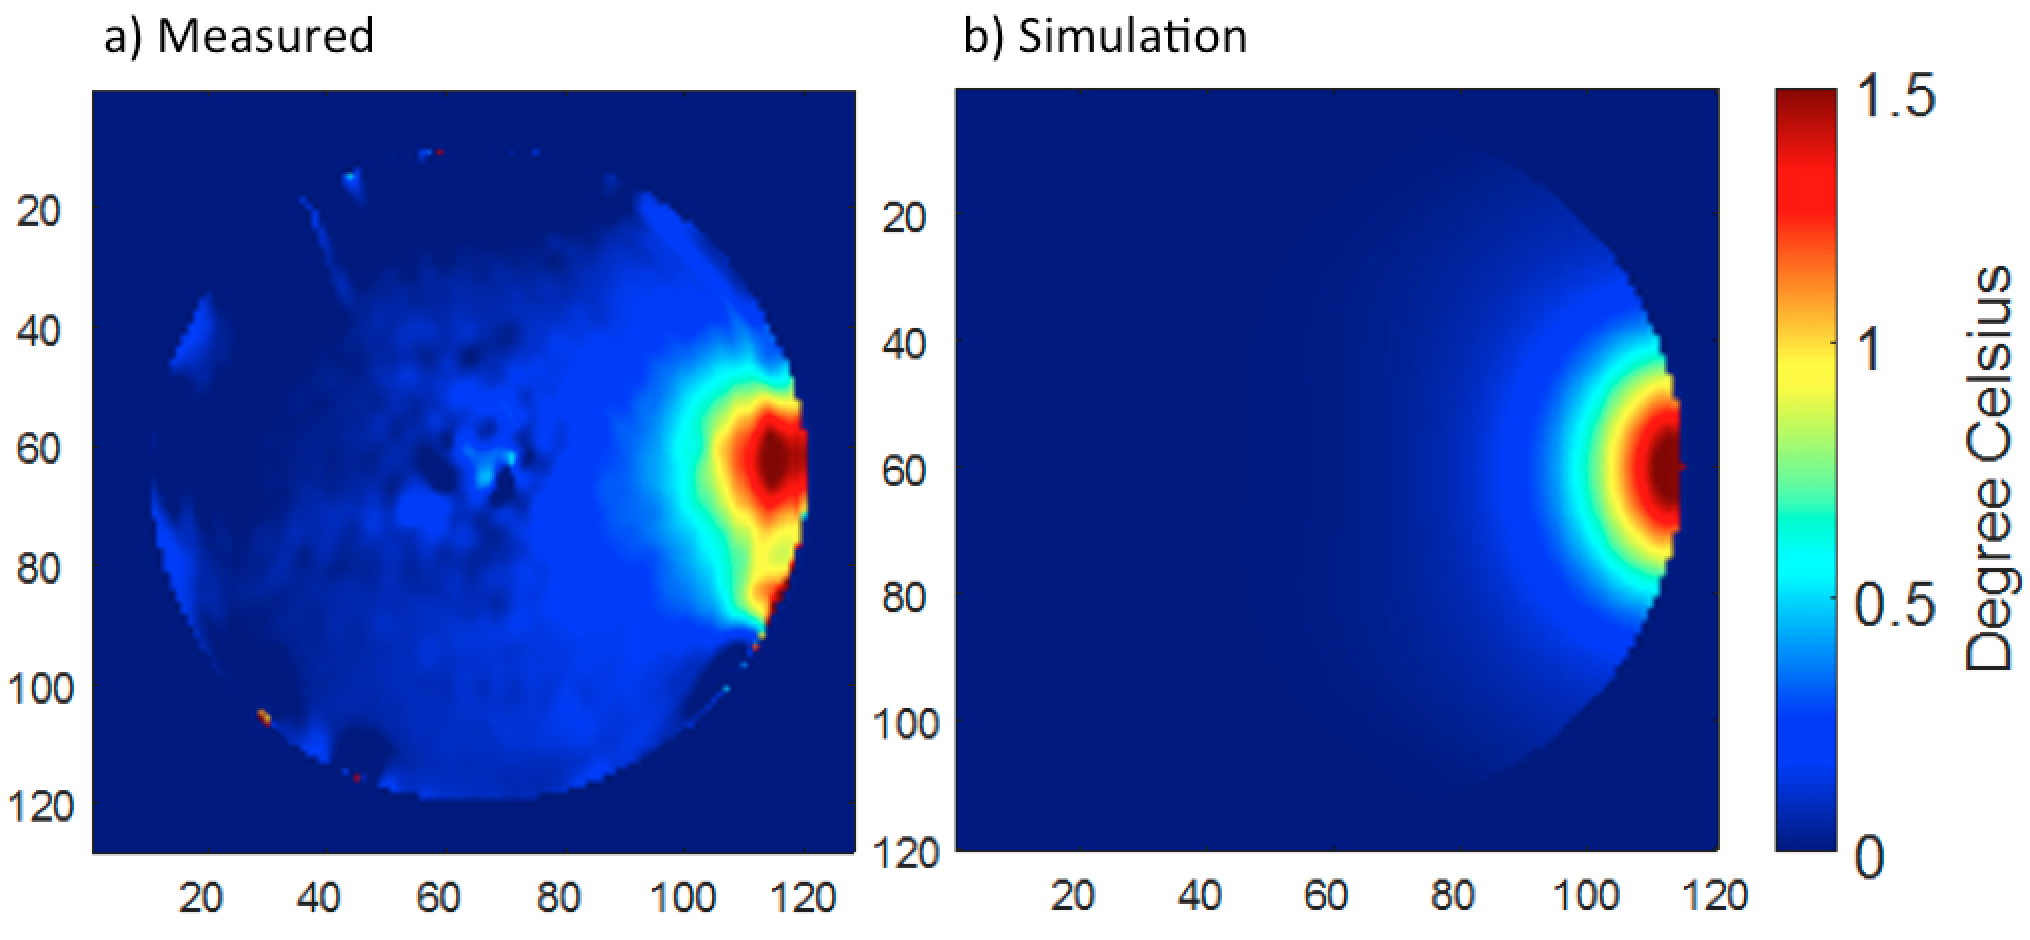
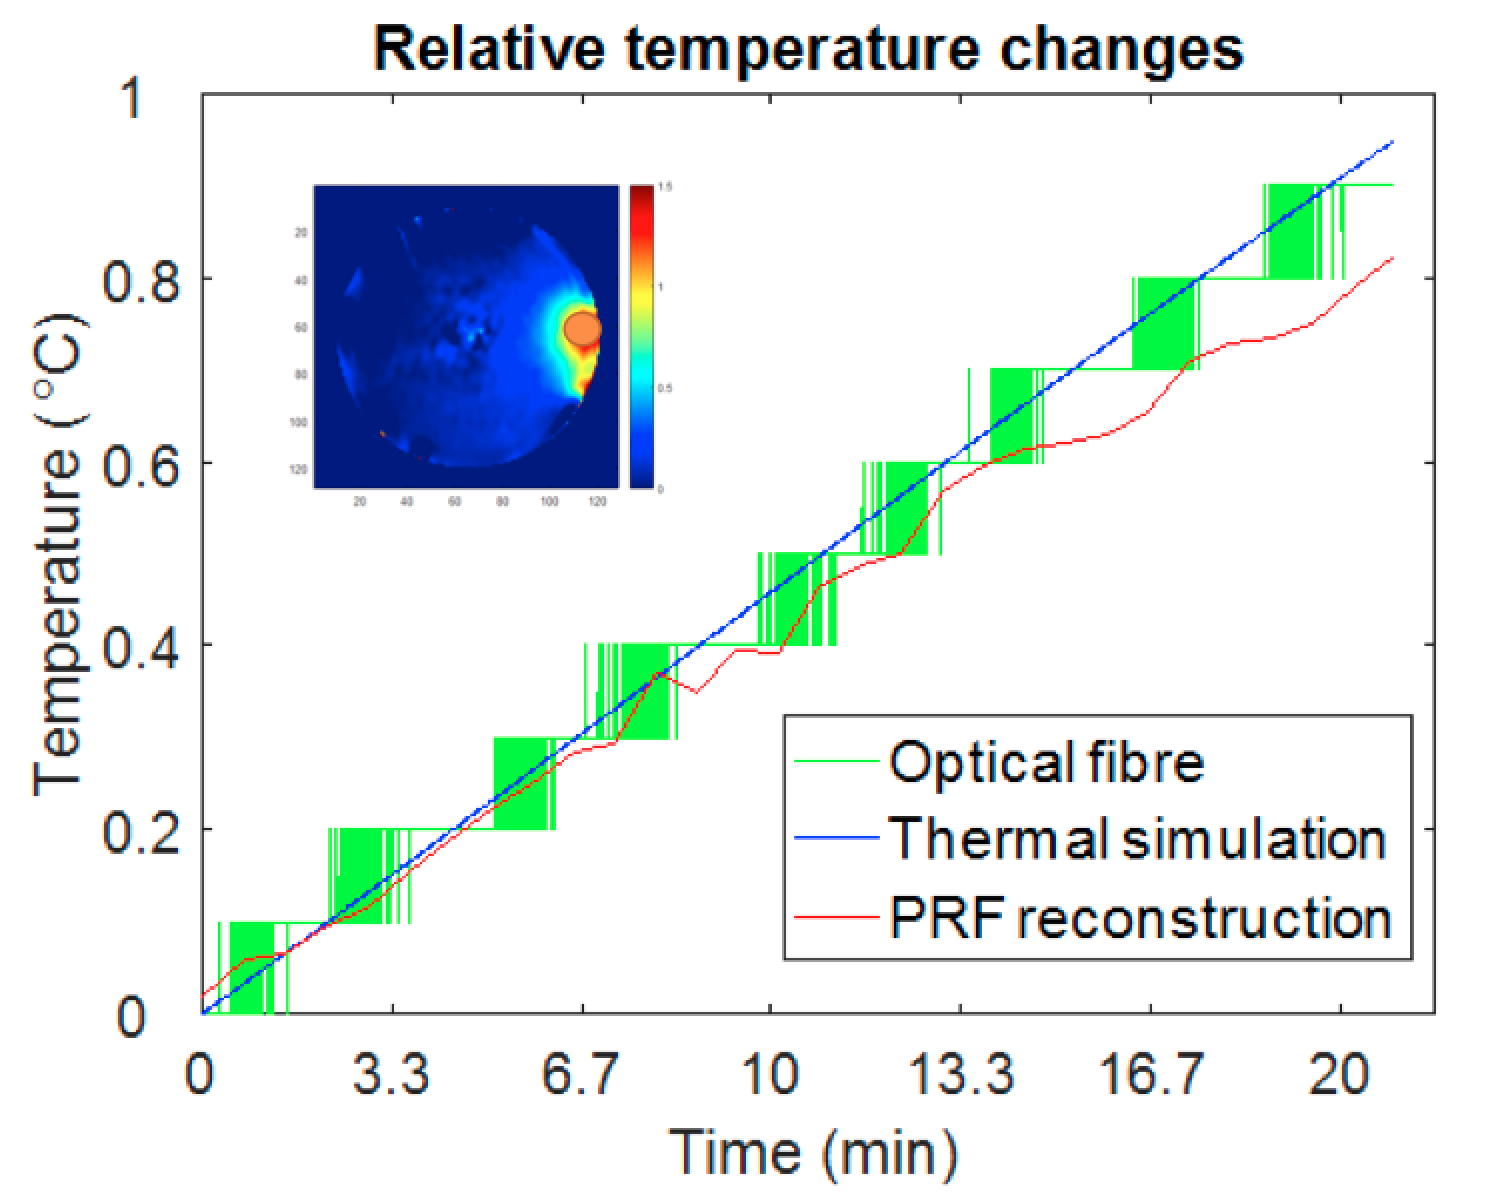
Without additional RF heating, the phase drift due to gradient heating showed a significant spatially dependent B0 drift during the initial 14 mins (20 repetitions) on our scanner, which then stabilized (Fig. 2). Spatial first-order fitting in X, Y, and Z (Fig. 2b) showed that only a constant (spatially invariant) drift remained after 20 repetitions (Fig. 2a). In subsequent RF heating experiments, the ‘baseline’ reference images for PRF calculation were therefore chosen as the 21st and 22nd acquisitions, and subsequent system frequency drift was corrected from the absolute temperature measured in the object centre with a fibre optic probe. The results of the simulated and measured B1 transmit field in a single representative element are compared in Figure 3, showing good agreement provided the experimental reflected power is accounted for. The results of PRF-based MR thermometry are compared with the simulated temperature map in Figure 4. The relative temperature changes at the edge of the phantom, as measured by fibre optic probe, PRF, and simulation are compared in Figure 5.Discussion
A PRF-based method to assess RF heating in a phantom has been demonstrated and compared with thermal measurement and simulation. We found that spatially varying field drift is insignificant on our scanner if a stabilisation period is used, mitigating the need for multiple fibre optic probes, oil references, or magnetic field monitoring6,7. Using two transmit modes for imaging provides whole phantom PRF coverage independent of heating channel.Conclusions
With RF safety playing an important role in pTx applications, this method enables accurate validation of RF heating simulations with minimal additional hardware requirements.Acknowledgements
Thanks to Oxford-Radcliffe Graduate Scholarship (University College Oxford) and Clarendon Fund. British Heart Foundation Centre of Research Excellence (Oxford)References
1. Oh S, Webb AG, Neuberger T, Park B, Collins CM. Experimental and numerical assessment of MRI-induced temperature change and SAR distributions in phantoms and in vivo. Magn Reson Med. 2010. doi:10.1002/mrm.22174.
2. Graedel NN, Polimeni JR, Guerin B, Gagoski B, Wald LL. An Anatomically Realistic Temperature Phantom for Radiofrequency Heating Measurements. Magn Reson Med. 2015;73:442-450. doi:10.1002/mrm.25123.
3. Ito K, Furuya K, Okano Y, Hamada L. Development and characteristics of a biological tissue-equivalent phantom for microwaves. Electron Commun Japan (Part I Commun. 2001. doi:10.1002/1520-6424(200104)84:4<67::AID-ECJA8>3.0.CO;2-D.
4. Brunner DO, Pruessmann KP. SVD based calibration of transmit arrays. In: Proc. Intl. Soc. Mag. Reson. Med. ; 2010.
5. De Poorter J, De Wagter C, De Deene Y, Thomsen C, Stahlberg F, Achten E. Noninvasive MRI Thermometry with the Proton Resonance Frequency (PRF) Method: In Vivo Results in Human Muscle. Magn Reson Med. 1995.
6. Oh S, Ryu Y-C, Carluccio G, Sica CT, Collins CM. Measurement of SAR-Induced Temperature Increase in a Phantom and In Vivo with Comparison to Numerical Simulation. Magn Reson Med. 2014. doi:10.1002/mrm.24820.
7. De Zanche N, Barmet C, Nordmeyer-Massner JA, Pruessmann KP. NMR Probes for measuring magnetic fields and field dynamics in MR systems. Magn Reson Med. 2008. doi:10.1002/mrm.21624.
Figures