4391
Virtual Population Based Correlations between B1+, Whole-Body and Local SAR1ITIS Foundation, Zurich, Switzerland, 2Swiss Federal Institute of Technology (ETH), Zurich, Switzerland
Synopsis
Knowledge about the relationship between B1+rms and SAR is beneficial for the MRI RF safety community, consisting of academic investigators, MRI and implant vendors, and regulatory bodies. While implant manufacturers have already started to shift device-labelling form SAR to B1+rms, there is not yet available a systematic evaluation of their relationship. In this study, we aim to close this gap by presenting a systematic methodology for numerical estimations of an entire exposure-scenario matrix, including various human anatomical models, imaging positions, and MRI body-coil geometries.
Introduction
The root-mean-square (rms) value of the magnetic resonance imaging (MRI) effective component of the radiofrequency (RF) magnetic (B1) field (B1+rms) and whole-body averaged specific absorption rate (wbSAR) are fundamental metrics in MRI RF exposure assessment. These parameters can be determined easily via MRI flip-angle measurements and the power/absorption budget of the body coil, respectively. While MRI manufacturers have their proprietary estimation models, no public domain information is available about the correlation between B1+rms and whole-body or local SAR. The available data often only approximates B1+rms from the field in the empty coil1,2. A limitation regime based on SAR as in the safety standard3 is favorable to prevent excessive RF absorption. This, however, does not limit the RF field strengths directly, which theoretically could rise to B1+rms levels of more than 15 µT for small, light patients, without violating SAR constraints. Alternatively, a B1+ limitation can result in very different SAR values, generally larger for large, heavy patients.
Implant– especially active implanted medical devices (AIMD) – manufacturers are shifting from SAR to B1+rms labeling, which is convenient for the MRI operator, as B1+rms is less dependent on anatomical variation, and MRI sequences below the limitation labelling can be applied to all patients. However, the local fields actually induced and the SAR are still heavily dependent on the patient’s anatomy and placement, as demonstrated in this study. Thus, implant vendors must establish considerably high safety factors.
Note: B1+rms refers to the rms of the B1+ field TIME-averaged, usually over 10 seconds. The B1+ field itself is SPATIALLY averaged over the central axial slab of the patient. This rms should not be confused with the √2 relationship of the magnitude and rms of the B1 field tensor.
Methods
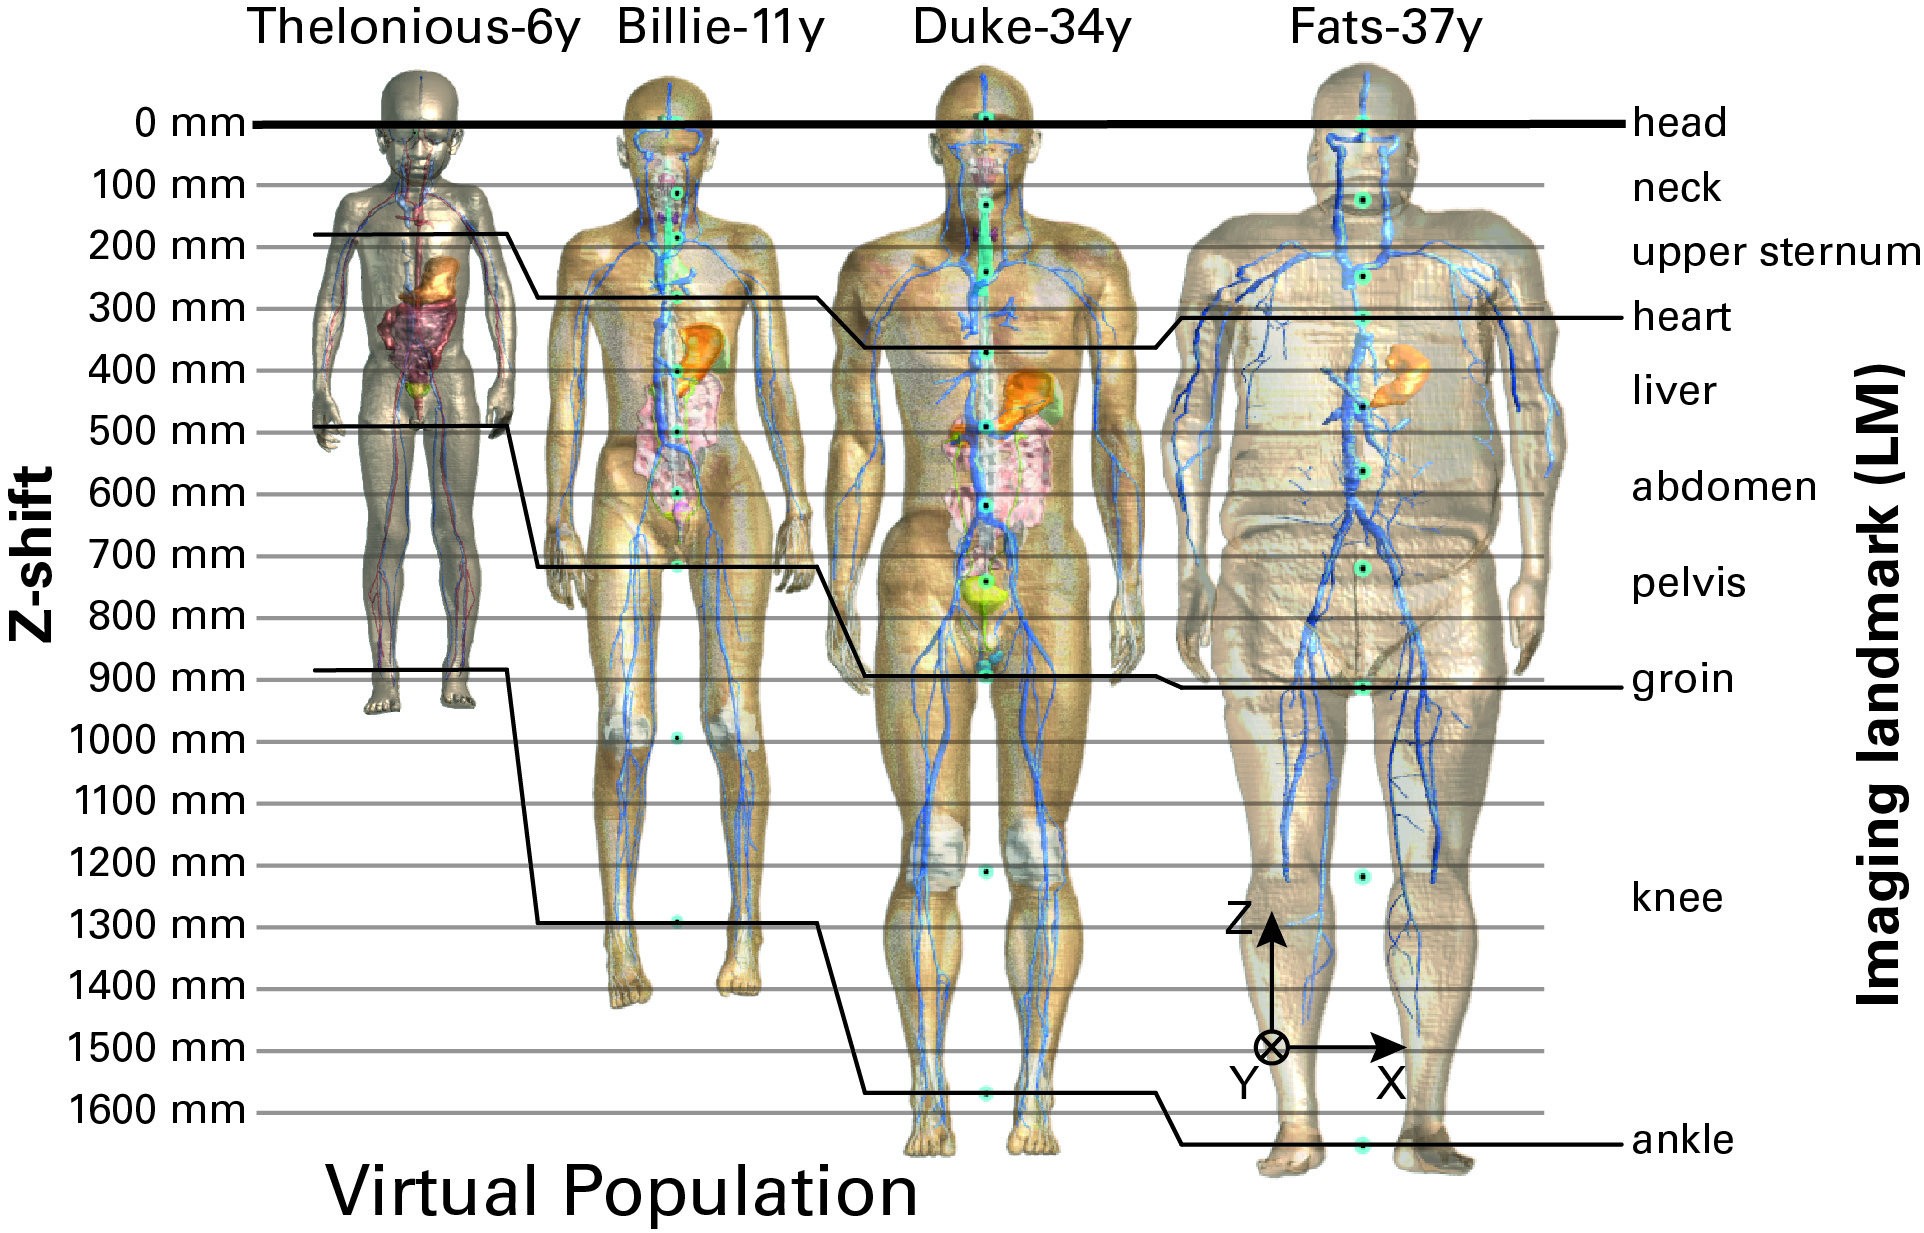
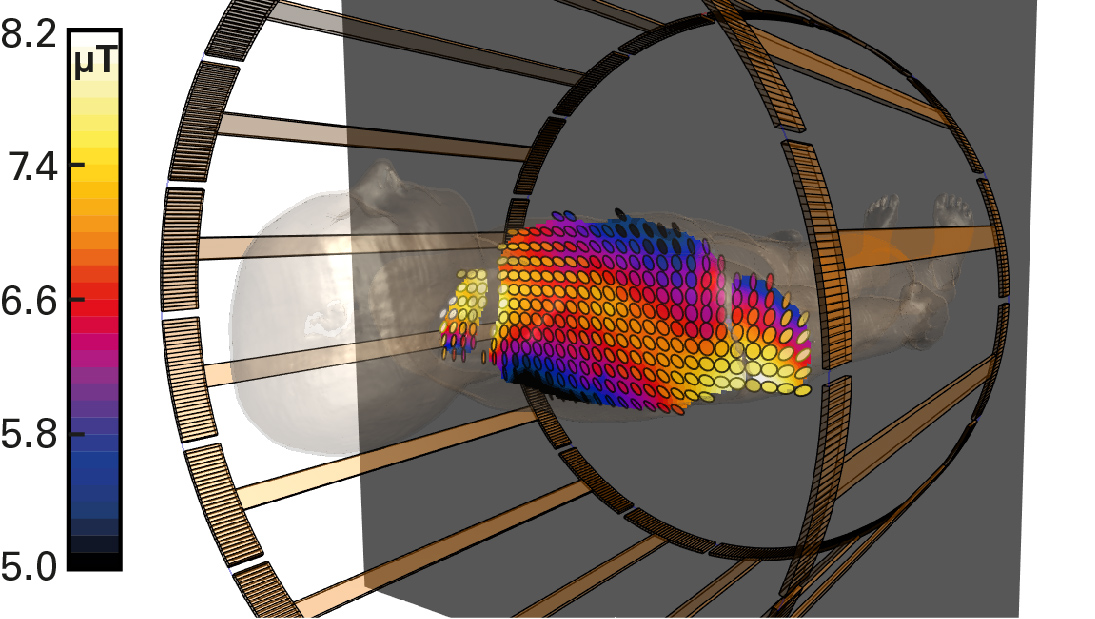
Four anatomical human models from the Virtual Population4 were investigated in various imaging positions (Figure 1) within a generic 1.5T birdcage body coil (70 cm body-coil diameter, 60 cm long). Evaluations will be extended to include other human models and various RF birdcage geometries. SAR levels were evaluated according to the standard. Head-SAR (3.2 W/kg) typically limits the exposure in head-imaging positions, wbSAR (4 W/kg) in torso scanning, and partial-body SAR (up to 10 W/kg) in leg-imaging positions. The local SAR is evaluated as the peak spatial SAR averaged over 10 g of tissue (psSAR10g). Both ISO/TS 109742 and IEC 60601-2-333 define B1+rms as being “derived from the flip angle averaged over an adjustment volume, which is typically represented by the axial central slab”. It is not clear whether the arms are part of the adjustment volume for torso-imaging positions. We use the central axial slab over one voxel-slice (2 mm) in all tissues present within this slab. A typical B1+ distribution is shown in Figure 2. Due to asymmetries in lossy human tissue, the polarization is not perfectly circular throughout the slab (as it would be in an empty coil).Results
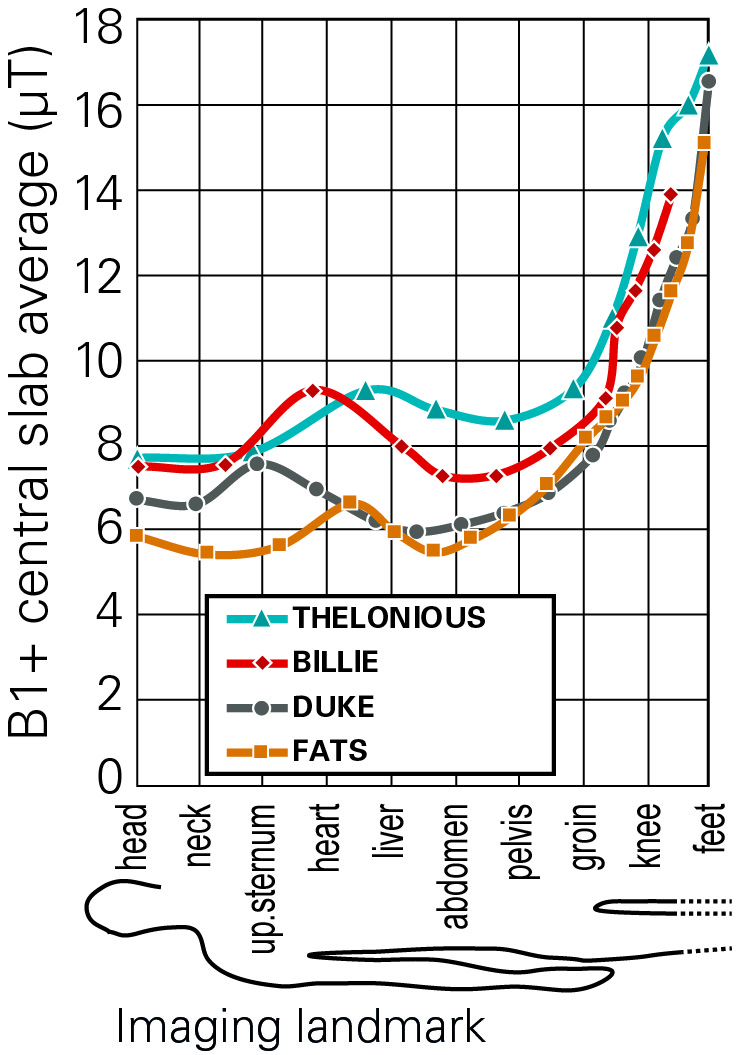
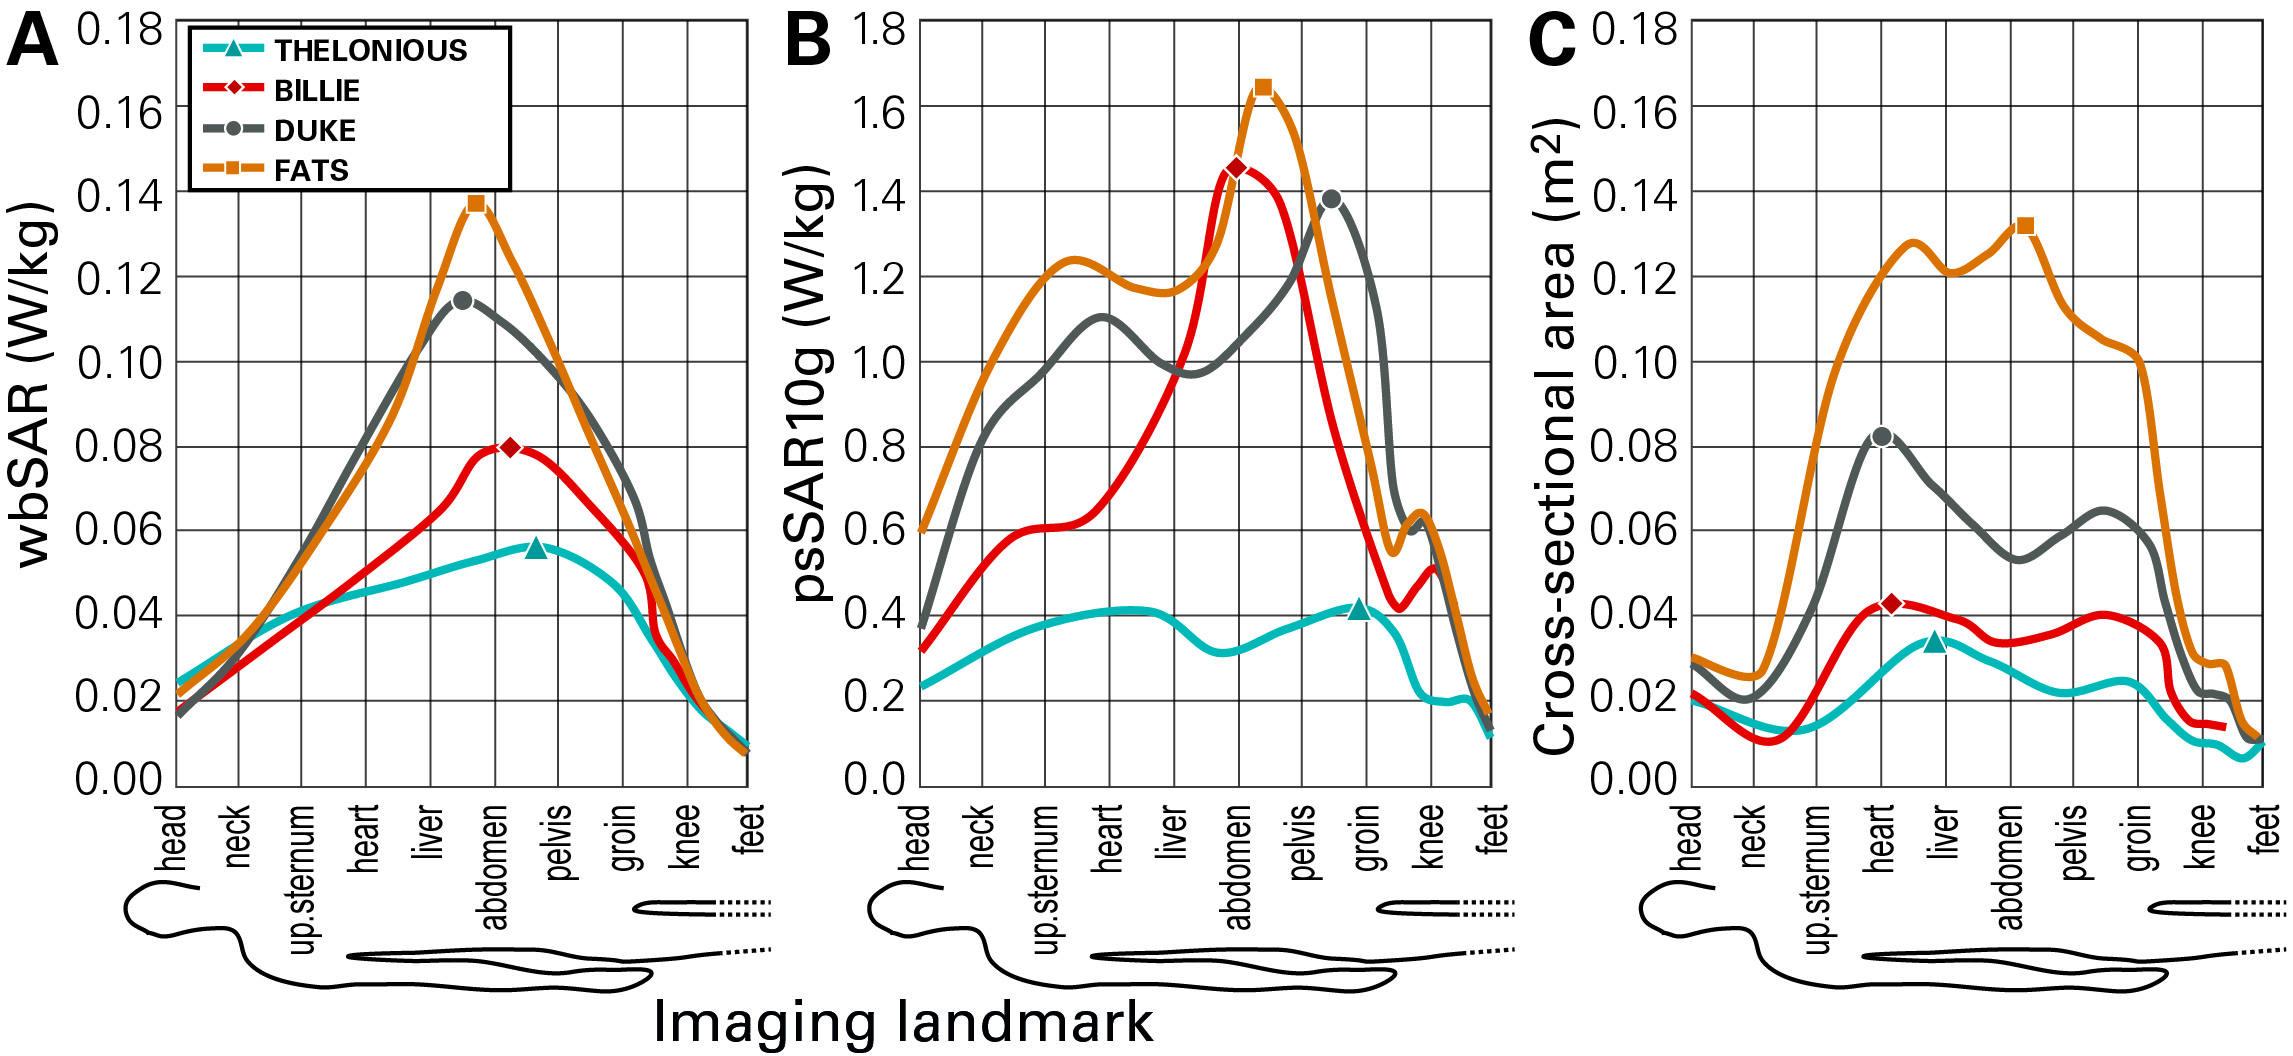
When normalized to the maximum allowance of the first level operating mode, the B1+rms values can vary between 5.5 and 17 μT (Figure 3). The difference between FATS and THELONIOUS is typically around a factor of 1.5 (3 dB) for head and torso imaging. The non-uniformity of the B1+ field remains small for the child model THELONIOUS (SD < 4.6%) and for head imaging (SD < 4.4%). It is highest for FATS in abdominal imaging (SD = 16.0%), as the circularity of the polarization deteriorates. As depicted in Figure 4, wbSAR and psSAR10g do not correlate well with B1+rms, neither with the central axial-slab body cross-section-area, nor with each other, confirming earlier results1.Conclusions
Knowledge about the relationship between B1+rms and SAR is beneficial for MRI RF safety evaluations for the entire patient population. The application of the here-derived evaluation methodology will be applied to the entire Virtual Population and a wide range of MRI body coil geometries, as well as to 3T scanners. This methodology will equip academic investigators, MRI and implant vendors, and regulatory bodies with the necessary background data to further increase both the efficacy and safety of MRI scanning.Acknowledgements
This study was supported in part by the MRInext project.References
1. Murbach M, Neufeld E, Kainz W, Pruessmann KP, Kuster N. Whole-body and local RF absorption in human models as a function of anatomy and position within 1.5T MR body coil. Magn Reson Med 2014;71:839–845.
2. ISO/TS. 10974:2012, Requirements for the safety of magnetic resonance imaging for patients with an active implantable medical device. ISO/TS 10974 2012.
3. IEC. Medical electrical equipment - Part 2-33: Particular requirements for the basic safety and essential performance of magnetic resonance equipment for medical diagnosis, Edition 3.2. IEC 60601-2-33:2010+AMD1:2013+AMD2:2015 CSV 2015.
4. Gosselin M-C, Neufeld E, Moser H, et al. Development of a new generation of high-resolution anatomical models for medical device evaluation: the Virtual Population 3.0. Phys Med Biol 2014;59:5287–5303.
Figures