4388
Diagnostic performance of qualitative and quantitative 3T DCE-MRI parameters of prostate cancer lesions in transition and peripheral zone stratified by pathology Gleason score and PI-RADSv2 score1Radiology, David Geffen school of Medicine at UCLA, LOS ANGELES, CA, United States, 2Radiological Sciences and Bioengineering, David Geffen school of Medicine at UCLA, LOS ANGELES, CA, United States, 3Pathology, David Geffen school of Medicine at UCLA, LOS ANGELES, CA, United States, 4Urology, David Geffen school of Medicine at UCLA, LOS ANGELES, CA, United States
Synopsis
We investigated the diagnostic performance of qualitative and quantitative parameters of dynamic contrast enhanced magnetic resonance imaging (DCE-MRI) of prostate cancer (PCa) in 238 patients with 303 lesions located in transition (TZ) and peripheral zone (PZ) stratified by pathology Gleason score (GS) and PI-RADSv2 score with whole mount histopathology validation. There was a significant difference in qualitative and quantitative values between low and high-grade tumors and PI-RADSv2 scores in PZ PCa lesions. However, for tumors located in TZ, only DCE curve type was significantly different between low and high-grade PCa.
Introduction
This study investigates the role of qualitative and quantitative parameters on DCE-MRI of prostate cancer (PCa) lesions in transition zone (TZ) and Peripheral zone (PZ), stratified by pathology Gleason score (GS) and Prostate Imaging – Reporting and Data System version 2 (PI-RADSv2) with whole mount histopathology (WMHP) validation.Methods
In this HIPAA-compliant, IRB-approved retrospective study, the study cohort included 303 lesions in 238 men with PCa who underwent 3T mutiparametric MRI (mpMRI) from 7/2009 to 12/2016 prior to robotic prostatectomy and whole mount histopathology (WMHP). Clinical, mpMRI and pathologic features were obtained. A genitourinary (GU) radiologist and a GU pathologist jointly matched the Regions of Interest (ROIs) on DCE-MRI with corresponding PCa previously identified on WMHP to determine true and false postives and negatives. PI-RADSv2 defined qualitative DCE curve types for each enhancing ROI included type 1 (progressive enhancement), type 2 (plateau) and type 3 (washout). Quantitative DCE-MRI was computed by a standard two-compartment pharmacokinetic (PK) model 1, using a separate workstation (DynaCAD; Invivo, Gainsville, FL), including (Ktrans (influx volume transfer coefficient), kep (efflux reflux rate constant) and iAUC (initial area under the curve)). DCE-MRI features of true positive PCa lesions were evaluated in TZ and PZ, based on GS grade (low GS =6, high GS> 6) and PI-RADSv2 scores. SPSS v24 was used to assess the significance of discrete & continuous variables by nonparametric tests.Results
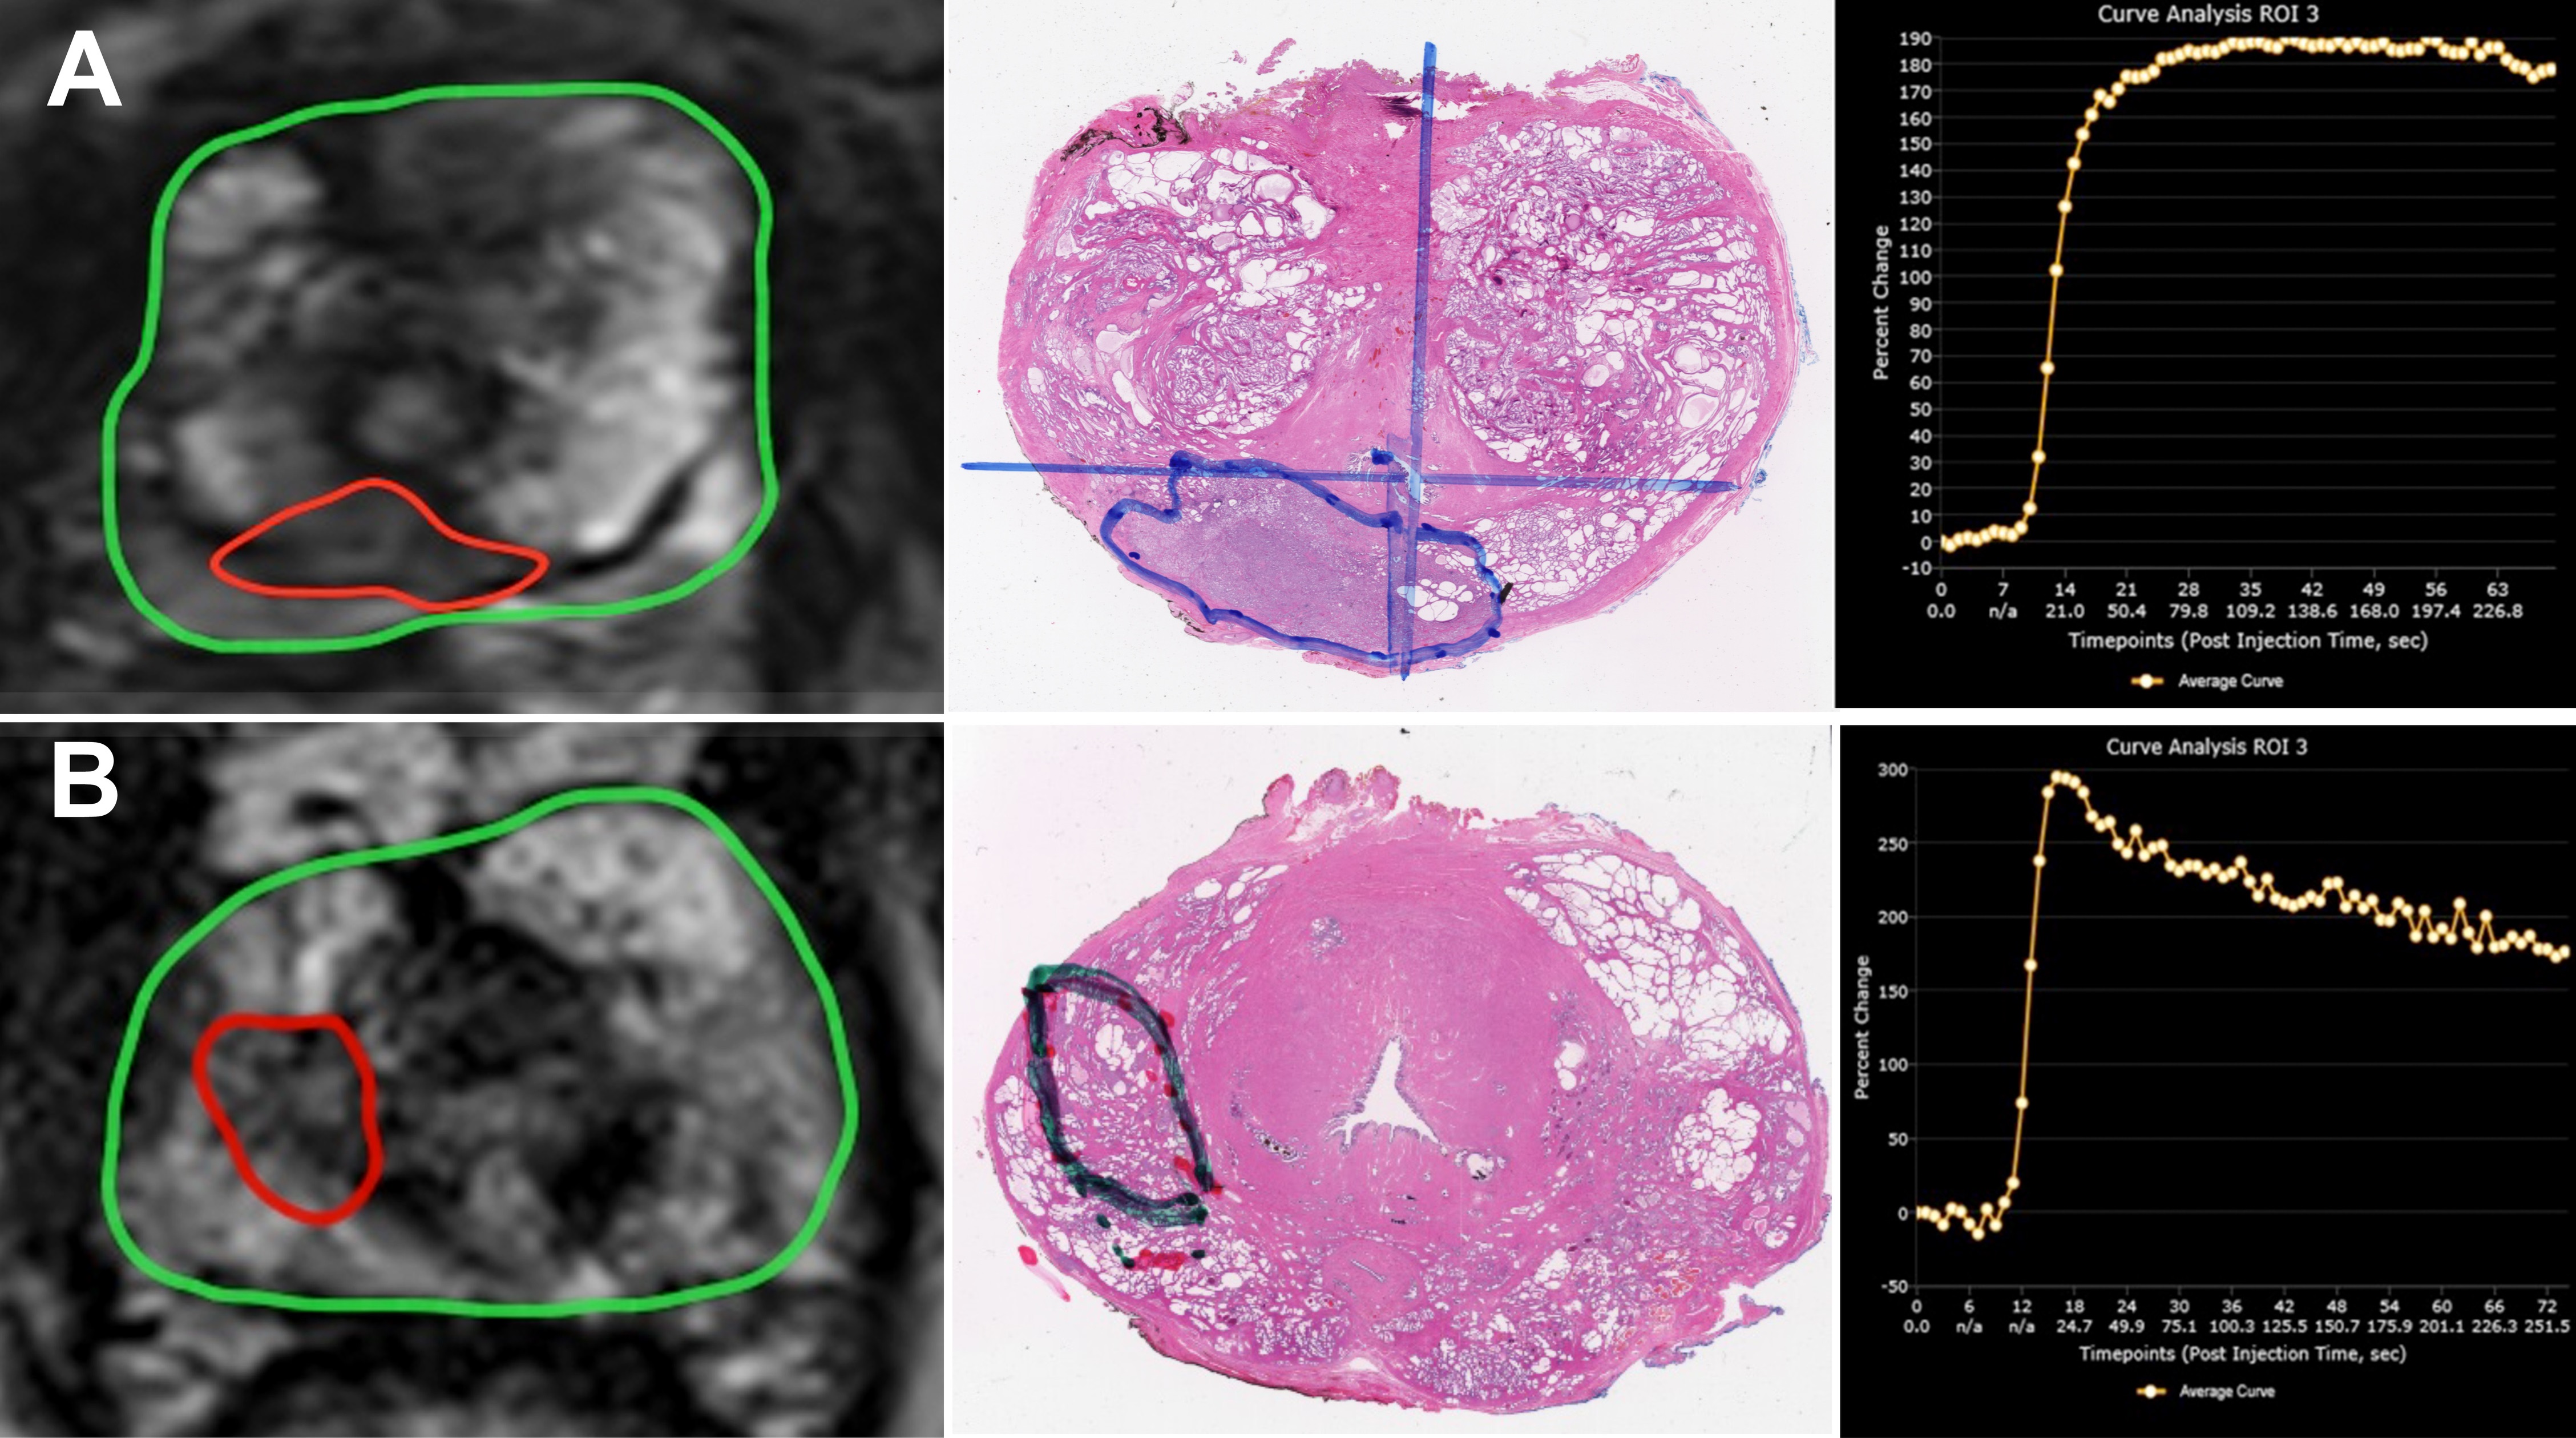
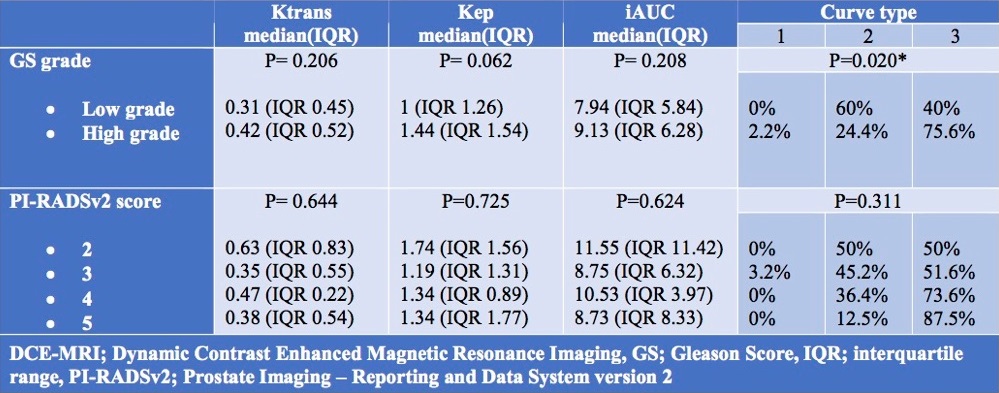
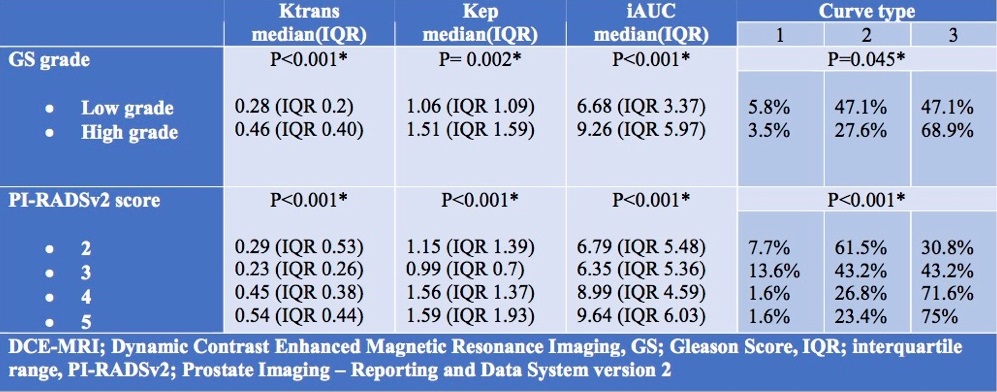
Overall 237 (88.2%) PCa lesions were located in PZ and 66 (21.8%) lesions were located in TZ. In both TZ and PZ, high grade PCa lesions had significantly higher proportion of Type 3 curves and lower proportion of Type 2 curves as compared to low grade tumors (p< 0.05). Figures 1 shows MRI lesions and corresponding WMHP sections in two patients with curve type 2 and low grade PCa lesion (A) and curve type 3 and high grade PCa lesion (B). In both TZ and PZ lesions, as PIRADSv2 scores increased from 2 to 5, the proportion of lesions with type 3 curves increased and type 2 curves decreased, although this was significant for PZ lesions only. In PZ, high grade tumors and PI-RADSv2 score 4 & 5 PCa lesions had higher median of Ktrans, Kep and IAUC compared to low grade tumors and PIRADSv2 score 2 & 3 PCa lesions, respectively. In TZ, there were no differences in PK parameters of PCa lesions based on GS grades and PI-RADSv2 scores (tables 1 and 2).Discussion
DCE MR imaging assesses the permeability of the microcirculation and passive transit of gadolinium chelates from the capillaries to the interstitium. PI-RADSv2 scoring simplifies the interpretation of DCE relying on qualitative enhancement only as an adjunct to DWI and T2WI for PZ and TZ PCa lesions, respectively. Since, some previous studies have shown variable performance of quantitative DCE-MRI parameters in differentiating normal from cancerous prostate tissue 2,3,4. However, enhancement alone may be insufficient since DCE-MRI has been demonstrated to be more robust than T2WI for localization of PCa lesions 3 and for improved tumor staging 5. In this study, we demonstrated that the TZ and PZ, both high PI-RADSv2 score and high Gleason grade PCa lesions were significantly associated with higher qualitative DCE-MRI curve types (2 or 3). In the PZ, DCE quantitative PK parameters were significantly greater for high grade PCa lesions and high PIRADSv2 scoring (4&5) lesions.conclusion
In both TZ and PZ, both high PI-RADSv2 score and high Gleason grade PCa lesions were significantly associated with higher qualitative DCE-MRI curve types (2 or 3). In the PZ, DCE quantitative PK parameters were significantly greater for high grade PCa lesions and high PIRADSv2 scoring (4&5) lesions suggesting that DCE curve types and kinetics may improve discrimination of more aggressive PCa disease.Acknowledgements
No acknowledgement found.References
1. Tofts PS. Modeling tracer kinetics in dynamic Gd-DTPA MR imaging. J Magn Reson Imaging. 1997;7(1):91-101.
2. Bonekamp D, Jacobs MA, El-Khouli R, Stoianovici D, Macura KJ. Advancements in MR imaging of the prostate: from diagnosis to interventions. Radiographics. 2011;31(3):677-703.
3. Futterer JJ, Heijmink SW, Scheenen TW, et al. Prostate cancer localization with dynamic contrast-enhanced MR imaging and proton MR spectroscopic imaging. Radiology. 2006;241(2):449-58.
4. Sanz-Requena R, Marti-Bonmati L, Perez-Martinez R, Garcia-Marti G. Dynamic contrast-enhanced case-control analysis in 3T MRI of prostate cancer can help to characterize tumor aggressiveness. Eur J Radiol. 2016;85(11):2119-26.
5. Barentsz JO, Richenberg J, Clements R, et al. ESUR prostate MR guidelines 2012. Eur Radiol. 2012;22(4):746-57.
Figures