4387
The RadPath Surfer: A Radiologic-Pathologic tool for visualizing prostate cancer histology1Biophysics, Medical College of Wisconsin, Wawautosa, WI, United States, 2Radiology, Medical College of Wisconsin, Wawautosa, WI, United States, 3Urologic Surgery, Medical College of Wisconsin, Wawautosa, WI, United States, 4Medical College of Wisconsin, Wawautosa, WI, United States
Synopsis
Prostate cancer is clinically defined by the Gleason Score (GS), based on the pattern of cells and glands. While imaging is useful for localizing prostate cancer, clinical diagnosis is based only on pathology; as such, tools which combine clinical imaging and pathology are highly useful as training tools. This study combines expert annotated histology aligned with clinical imaging to provide a visualization tool, allowing the user to select a region on the MRI and view the underlying pathology and Gleason annotation.
Purpose
This study aimed to develop a software tool, which allows the user to select a region on the MRI and view the underlying prostate cancer pathology and tumor grade.Methods
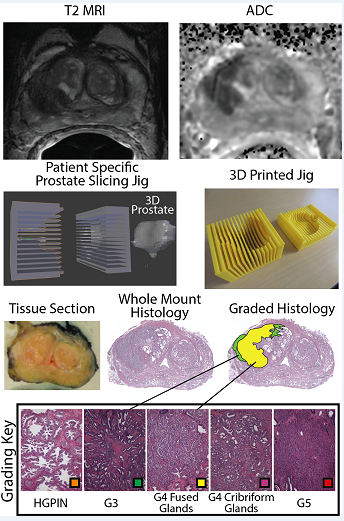
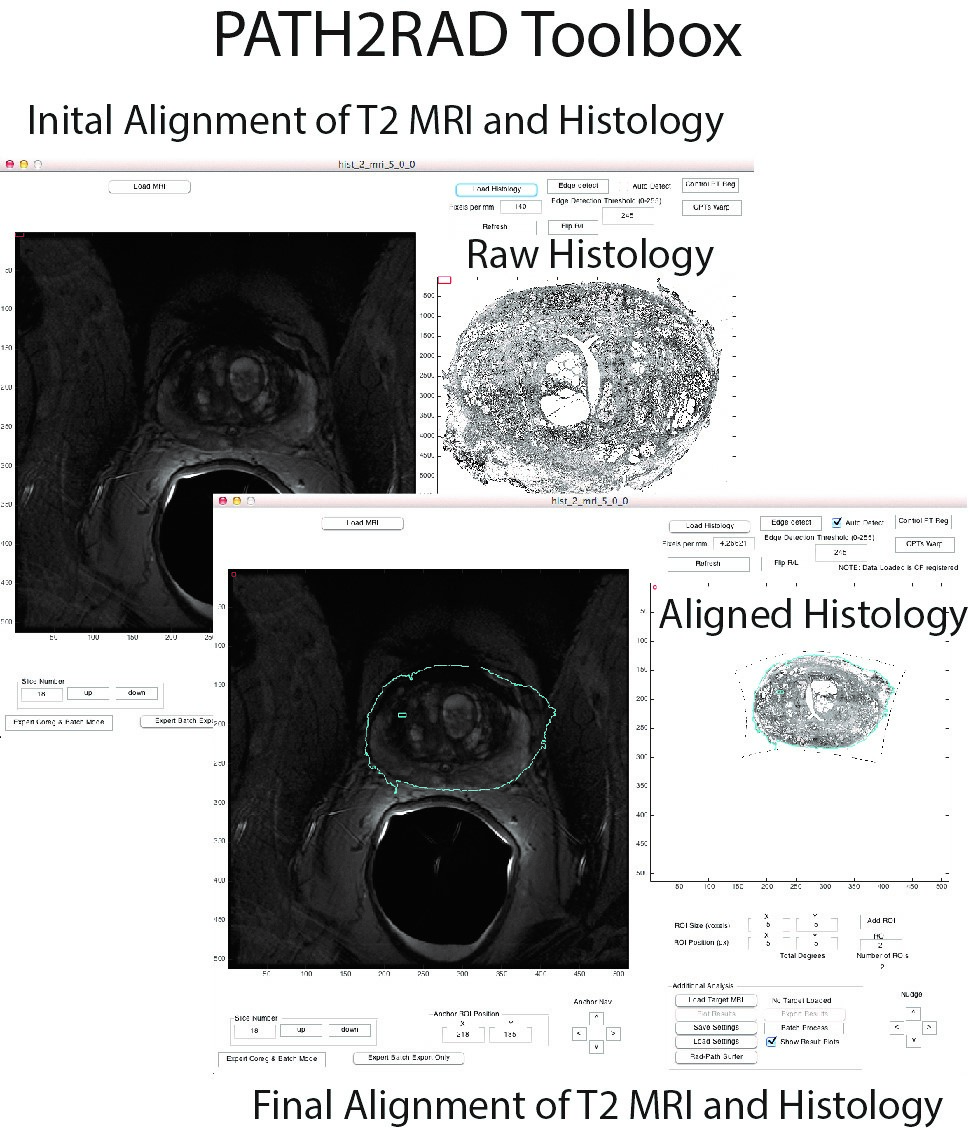
39 Patients underwent MP-MRI prior to prostatectomy on a 3T field strength MRI scanner (General Electric, Waukesha, WI) using an endorectal coil. T2 acquisition parameters were: 3370 ms TR, 120 mm FOV, with voxel dimensions 0.23x0.23x3 mm, 512 acquisition matrix, and 26 slices. Two weeks after imaging patients underwent a radical prostatectomy. A custom 3D printed slicing jig was created from the T2 weighted image in order to slice the tissue in the same orientation as the MRI[1-3]. Whole mount tissue samples were hematoxylin and eosin stained, digitized, and sent to a urological pathologist for annotation using the Gleason scale, including cribriform glands. Digitized slides were then aligned to the T2 weighted MRI using a non-linear control point warping technique. The pathologist annotations were transformed into MRI space using the same transform. The digitized histology was tiled into 1500x1500 pixel squares. Each square was assigned an X and Y coordinate, creating an X and Y coordinate map of histology tiles. The coordinate maps were subsequently transformed into MRI space in order to link the histology tiles to their corresponding locations in MRI space. A user interface was generated in MATLAB allowing the user to select a voxel on the MRI. The patient number, histology slide, and XY coordinates from the previously generated coordinate map are used to load the corresponding tiles underlying that location on the MRI. The tile is cropped and a 400x400 tile is displayed. Additionally, because the expert annotation is transformed into MRI space the user can view the Gleason grade of the underlying pathology.Results and Discussion
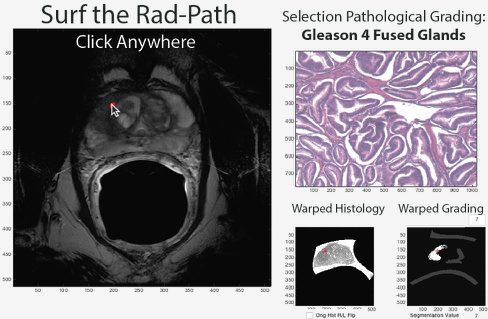
The software functions as intended and displays the correct underlying pathology. The tool functions on MRI slices and prostate regions where tissue samples have been obtained and aligned. An example is shown in Figure 3, where the user clicked on a region, and the underlying histology and tumor grade is displayed. Clinical staging of prostate cancer based on imaging alone has a high sensitivity of 85%, but a relatively low specificity at 55%[4]. The Rad-Path Surfer may aid clinical decision making as a training tool by providing instant feedback regarding the underlying pathology in naïve MRI data, allowing a clinician to better hone their ability to recognize and classify cancer.Conclusion
This study developed a software tool, which allows the user to view the true pathology causing an MRI signal. This may be useful as a training tool for Radiologists.Acknowledgements
Advancing a Healthier Wisconsin and the State of Wisconsin Tax Check off Program for Prostate Cancer Research. National Center for Advancing Translational Sciences, NIH UL1TR001436 and TL1TR001437, and RO1CA218144References
1. Hurrell SL, McGarry SD, Kaczmarowski AL, et al. Optimized b-value selection for the discrimination of prostate cancer grades, including the cribriform pattern, using diffusion weighted imaging. 2017.
2. LaViolette PS, Mickevicius NJ, Cochran EJ, et al. Precise ex vivo histological validation of heightened cellularity and diffusion-restricted necrosis in regions of dark apparent diffusion coefficient in 7 cases of high-grade glioma. Neuro Oncol. 2014;16(12):1599-1606.
3. Nguyen HS, Milbach N, Hurrell SL, et al. Progressing Bevacizumab-Induced Diffusion Restriction Is Associated with Coagulative Necrosis Surrounded by Viable Tumor and Decreased Overall Survival in Patients with Recurrent Glioblastoma. AJNR Am J Neuroradiol. 2016.
4. Muller BG, Shih JH, Sankineni S, et al. Prostate Cancer: Interobserver Agreement and Accuracy with the Revised Prostate Imaging Reporting and Data System at Multiparametric MR Imaging. Radiology. 2015;277(3):741-750.
Figures