4385
Clinical usage and impact of predictive models of prostate cancer on multiparametric MRI: a single-observer exploratory evaluation1Center for Magnetic Resonance Research, University of Minnesota, Minneapolis, MN, United States, 2Department of Radiology, University of Minnesota, Minneapolis, MN, United States
Synopsis
A single-observer, experiential study was conducted to understand how predictive models of prostate cancer on multiparametric MRI can be used clinically, and to determine whether such models have the potential to improve observer performance. A radiologist experienced in prostate MRI was asked to interpret mpMRIs for 34 patients before and after viewing model-generated predictive maps. Results show that the radiologist generally had low confidence in the accuracy of the predictive maps. However, his performance was significantly improved in the cases where he judged the predictive maps to be helpful. A multi-reader iteration of the study is planned.
Introduction
There is significant interest in developing computational models for detection of prostate cancer (PCa) using multiparametric MRI (mpMRI).1-3 However, very few studies have evaluated the effect of predictive models on radiologic diagnosis of PCa.4 Here, we present a single-observer, experiential study that demonstrates how model-generated predictive maps may be integrated into clinical practice as well as their potential effect on observer performance.Methods
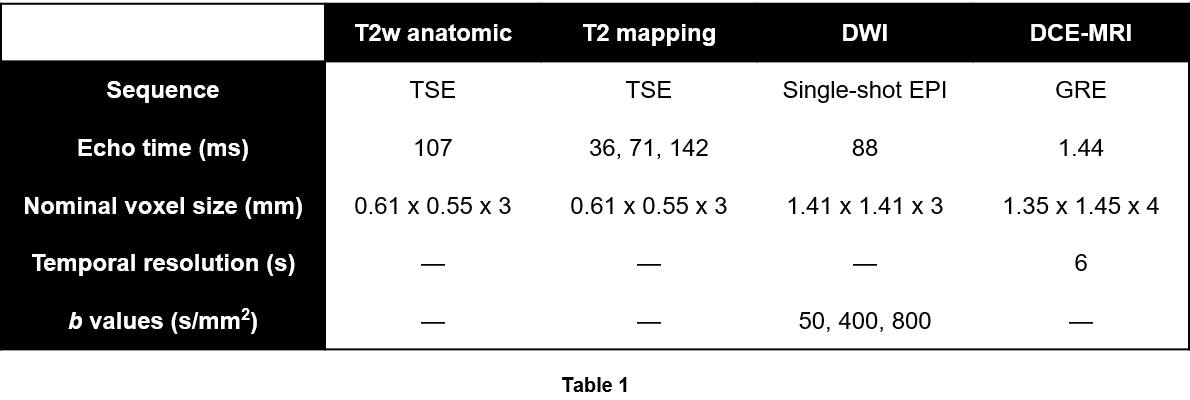
Multiparametric MRI data were acquired following previously described protocols.1 Briefly, 34 patients with known PCa received mpMRI scans at 3T. A combination of a surface array coil and an endorectal coil was used for signal reception. Imaging sequence parameters are shown in Table 1. Imaged patients subsequently underwent radical prostatectomy. Excised prostates were sectioned and stained, then annotated for cancer by pathologists. Slides were then co-registered to the imaging data5 to arrive at the final modeling data, which was composed of 46 annotated axial slices of interest.
A previously-described predictive model, which uses L1-regularized logistic regression to perform voxel-wise classification, was trained on the described data.1,6 Briefly, the predictive features at each voxel (x,y) included the following:
- 5 quantitative mpMR parameters (T2, ADC, Ktrans, Kep, AUGC90)
- The xy-location of the voxel relative to the apparent extent of the prostate within the slice (xr, yr)
- The 5 quantitative mpMR parameters at the voxel (-xr, yr), approximately corresponding to (xr, yr) reflected across the AP axis of the prostate.
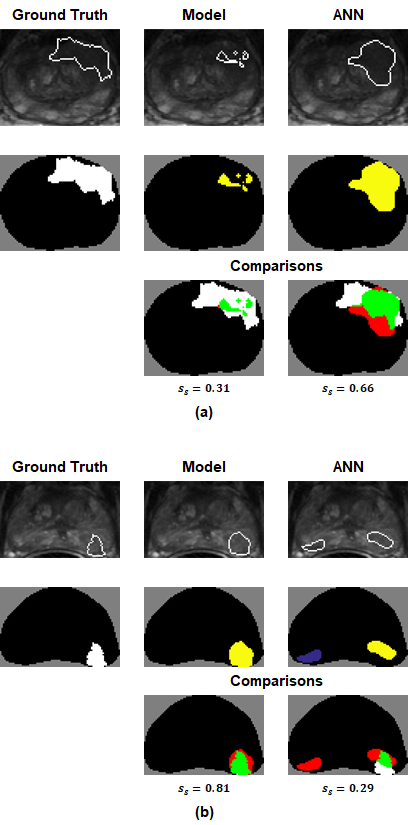
A case-based leave-one-out cross-validation scheme was used to train the model. Lesion-detection performance was evaluated using previous-described lesion-wise metrics.7 Briefly, cancer-labeled voxels in ground-truth maps ($$$m_{tr}$$$s) and model-generated prediction maps ($$$m_p$$$s) were automatically grouped into discrete lesions. A lesion-wise score $$$(s_\ell)$$$ was developed to quantify the accuracy of each predicted lesion. Thresholding $$$s_\ell$$$ allowed for the definition of true-positive and false-negative lesions. A lesion-summary score $$$(s_s)$$$ was defined as a weighted average of $$$s_\ell$$$s and was used to summarize model performance over all $$$m_p$$$s. Note that the metrics satisfy $$$0\leq s_\ell,s_s \leq 1$$$.
For the observer study, the mpMRIs (plus calculated b2000 diffusion-weighted images) for each of the 34 cases were first interpreted in accordance with PI-RADS v.2 guidelines8 by a radiologist (B.S.) with 5 years of experience in prostate MRI. The radiologist was blinded to the patient histories, but was aware that all patients had biopsy-proven PCa and underwent radical prostatectomy. For each case, 0-3 ROIs were drawn using DynaCAD (Invivo) to subjectively outline the maximum extent of disease. Only ROIs receiving a PI-RADS score of ≥3 (at least an intermediate risk of cancer) were annotated.
Next, $$$m_p$$$s were overlaid on the corresponding T2w anatomic series and shown to the radiologist. He was asked to re-read each case using the $$$m_p$$$s in conjunction with the mpMRI data and assign a subjective confidence score (1-3 Likert scale) to each $$$m_p$$$. The confidence score helped quantify the radiologist’s belief in the predictive maps, and was defined as follows:
- 1: The $$$m_p$$$ is inaccurate and/or strictly worse than the original annotation.
- 2: Accuracy of the $$$m_p$$$ is equivocal, or the $$$m_p$$$ is very similar to the original annotation.
- 3: The $$$m_p$$$ is useful for improving the accuracy of the original annotation.
Only $$$m_p$$$s receiving a confidence score of 3 were used by the radiologist to subjectively modify the relevant original ROIs. The accuracy of the original and modified annotations was compared with that of the predictive model using the aforementioned lesion-wise metrics.
Results
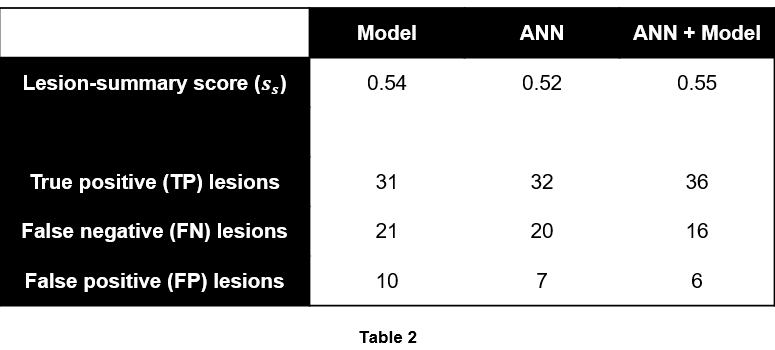
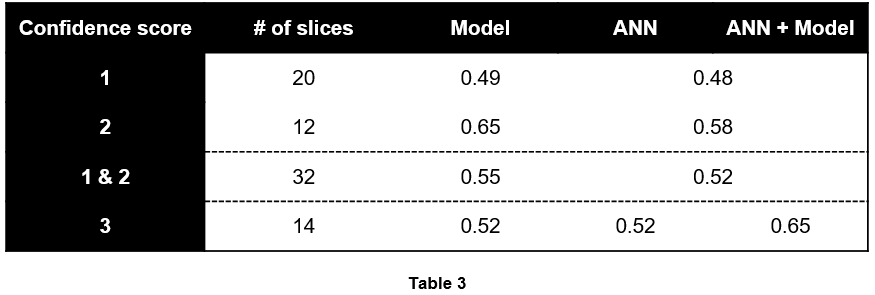
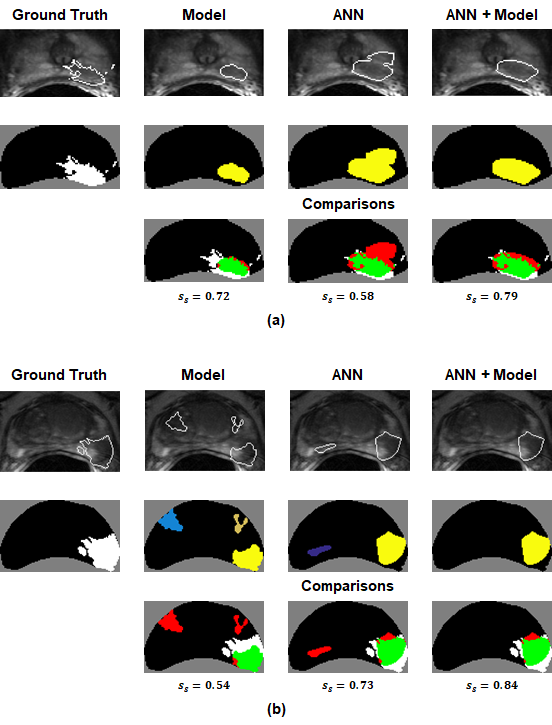
52 lesions were identified in the 46 $$$m_{tr}$$$s. Table 2 summarizes the lesion-detection performance for the predictive model and radiologist annotations. Table 3 breaks down the results in Table 2 by confidence score. Figures 1 and 2 illustrate cases in which radiologist annotations were modified or unmodified, respectively, after viewing the $$$m_p$$$s.Discussion
As shown in Table 2, the addition of the predictive maps led to a small increase in observer performance over all cases. However, Table 3 demonstrates that when the predictive maps were judged to be helpful and subsequently used to guide the adjustment of the original ROIs, observer performance improved significantly. Given these results, it is interesting that annotations were changed in only 14/46 = 30% of cases, even though it appears that more could have been improved by the predictive maps.
Besides the single observer, a major weakness in the current study design is the fact that predictive maps were only available for select slices as opposed to 3D volumes of the prostate, which likely affected the way they were viewed by the observer. We plan to address this issue in the forthcoming multi-reader iteration of this study.
Acknowledgements
This work was supported in part by the National Institutes of Health (R01-CA155268, P41-EB015894, T32-GM008244), Department of Defense (W81XWH-15-1-0477), and the Minnesota Research Evaluation and Commercialization Hub (MN-REACH).References
1. Metzger GJ, Kalavagunta C, Spilseth B, Bolan PJ, Li X, Hutter D, Nam JW, Johnson AD, Henriksen JC, Moench L, Konety B, Warlick CA, Schmechel SC, Koopmeiners JS. Detection of Prostate Cancer: Quantitative Multiparametric MR Imaging Models Developed Using Registered Correlative Histopathology. Radiology. 2016;279(3):805-16.
2. Litjens G, Debats O, Barentsz J, Karssemeijer N, Huisman H. Computer-aided detection of prostate cancer in MRI. IEEE Trans Med Imaging. 2014;33(5):1083-92.
3. Lemaître G, Martí R, Freixenet J, Vilanova JC, Walker PM, Meriaudeau F. Computer-Aided Detection and diagnosis for prostate cancer based on mono and multi-parametric MRI: a review. Comput Biol Med. 2015;60:8-31.
4. Hambrock T, Vos PC, Hulsbergen-van de Kaa CA, Barentsz JO, Huisman HJ. Prostate cancer: computer-aided diagnosis with multiparametric 3-T MR imaging--effect on observer performance. Radiology. 2013;266(2):521-30.
5. Kalavagunta C, Zhou X, Schmechel SC, Metzger GJ. Registration of in vivo prostate MRI and pseudo-whole mount histology using Local Affine Transformations guided by Internal Structures (LATIS). J Magn Reson Imaging. 2015;41(4):1104-14.
6. Leng, E, Jin J, Zhang L, Warlick CA., Spilseth B, Koopmeiners JS, Metzger GJ. Spatially-sensitive model for detection of prostate cancer on multiparametric MRI. ISMRM 25th Annual Meeting & Exhibition. Honolulu, HI. April, 2017.
7. Leng, E, Jin J, Zhang L, Koopmeiners JS, Metzger GJ. Development of a lesionwise metric for evaluation of predictive models of prostate cancer on multiparametric MRI. ISMRM 25th Annual Meeting & Exhibition. Honolulu, HI. April, 2017.
8. Weinreb JC, Barentsz JO, Choyke PL, Cornud F, Haider MA, Macura KJ, Margolis D, Schnall MD, Shtern F, Tempany CM, Thoeny HC, Verma S. PI-RADS Prostate Imaging - Reporting and Data System: 2015, Version 2. Eur Urol. 2016;69(1):16-40.
Figures