4383
Intravoxel Incoherent Motion Diffusion Weighted Imaging of Prostate Cancer1Dana-Farber Cancer Institute, Brookline, MA, United States, 2Brigham and Women's Hospital, Boston, MA, United States, 3Raboud university medical center, Nijmegen, Netherlands, 4Boston Children's Hospital, Boston, MA, United States
Synopsis
Intravoxel Incoherent Motion (IVIM) DWI was acquired with 13 b-values, ranging from 0 to 250 s/mm2. With such low b-values, a short TE results in a better signal-to-noise ratio. Monoexponential fitting was performed to obtain ADC, and biexponential fitting was performed to obtain diffusion D, perfusion fraction f, and perfusion related pseudo-diffusion coefficient D*. In a prostate cancer (PCa) patient cohort, we only found a significant difference between normal and tumor tissue for D, which was absent in ADC, f, and D*. This suggests that IVIM biexponential analysis can help remove perfusion component from diffusion, leading to a more accurate measurement in diffusion coefficient.
INTRODUCTION
Diffusion weighted imaging (DWI) is used to help diagnose and stage prostate cancer. In the peripheral zone, where the majority of PCa occurs, conventional mono-exponential fitted apparent diffusion coefficient (ADC) values of cancer are generally lower than normal tissue. Intravoxel incoherent motion (IVIM) DWI was introduced to separate diffusion and perfusion components1, and has been applied to PCa imaging. However, the perfusion fraction and diffusion coefficient parameters exhibit large variations among reported studies 2 and are highly impacted by the b-values and fitting models3. In this study, we focus on the low b-values and try to obtain more accurate IVIM measurements.METHODS
This was a prospective study approved by the local institutional review board. Fifteen patients with PCa were recruited in the study. All had tumors in the peripheral zone (PZ). DWI acquisition was performed at 3T (General Electric) using an endorectal coil. A single-shot spin-echo echo-planar imaging sequence, with TR 4000ms, TE 52ms, one signal average, acquisition matrix 64*64, and thirteen b-values 0, 10, 20, 30, 40, 50, 60, 70, 80, 90, 100, 120, 250 s/mm2 along three orthogonal directions was used for diffusion imaging. A radiologist fellowship trained in abdominal imaging defined two regions of interest (ROIs) on each patient’s b=250 s/mm2 image, one inside the index lesion and the other within contralateral normal PZ tissue. Conventional monoexponential fitting was performed to obtain ADC using all b-values. Biexponential fitting was also performed to obtain perfusion and diffusion parameters respectively. The biexponential IVIM function is defined as:
Sb=S0·[f·exp(-bD*)+(1-f)·exp(-bD)]
where D is the true diffusion, D* is perfusion-related pseudo-diffusion coefficient, and f is the perfusion fraction. The fitting was carried out in the following steps:
1. Monoexponential fitting of the two largest b-values 120 and 250 s/mm2 to obtain an initial D, where the contribution from pseudo-diffusion to the total signal is expected to be less than 0.1%. Extrapolate the signal to all b-values to obtain SD=S0·(1-f)·exp(-bD) , where SD denotes diffusion component of the signal.
2. Subtract measured signal Sb from SD to obtain perfusion component, SD*=Sb-SD=S0·f·exp(-bD*). Because this is a monoexponential decay, we can obtain D* from the subtracted signal SD*, and the intercept is S0''=S0·f.
3. Subtract SD* from Sb to obtain diffusion component, SD=Sb-SD*=S0·(1-f)·exp(-bD) . Because this is a monoexponential decay, we can refine the initial D from the subtracted signal SD , and the intercept is S0'=S0·(1-f).
4. Go back to step 2 until the change in fitted SD+SD* is negligible.
5. Calculate f= S0''/(S0''+S0').
Paired t-tests were used to compare diffusion and perfusion parameters between normal and tumor tissues. Statistical significance was considered at p<0.05. Fitting with the iterative linear method and statistical analyses were all performed using in-house software developed with Matlab R2013b (Mathworks Inc, Natick, MA).
RESULTS
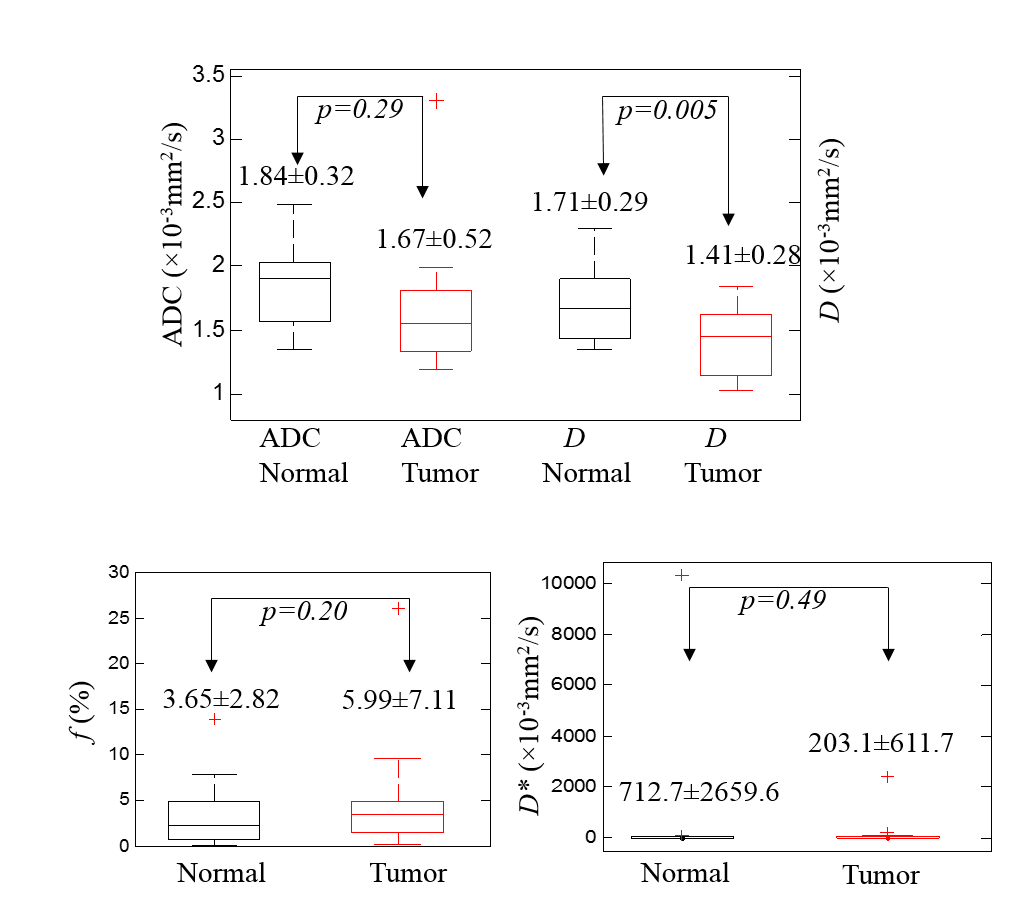
Figure 1 shows example ROI for normal and tumor tissue with corresponding measured mean signal inside the ROI respectively. The final fitted curve plotted on a logarithmic scale does not deviate from a straight line at low b-values, suggesting that the perfusion component in the measured signal is very small. Diffusion D is different between two tissues whereby tumor has a smaller D than normal tissue. In the patient data shown, the perfusion fraction is the same for both tissues, i.e., f=0.071. Figure 2 shows the boxplots of the diffusion and perfusion parameters in the 15 patients. D is smaller than ADC for both tissues. The difference between normal and tumor tissues is only significant in D (p=0.005), but not significant in any other parameters. The very large standard deviation and outliers of D* suggests that it is not a reliable parameter.DISCUSSION
Different b-values have been used for IVIM acquisitions with large ranges of diffusion and perfusion parameters reported2-5. Clearly the selection of b-values has a large effect in reported results. In this study, we focused only on b-values less than 250 s/mm2, so that we were able to minimize TE to acquire at higher signal-to-noise ratios. The perfusion fraction f was not significantly different between normal and tumor tissue. Neither was ADC with the effect of perfusion present. However, the diffusion coefficient D was able to differentiate normal vs tumor tissue well. This suggests that to measure reliable diffusion, biexponential fitting IVIM is better than monoexponential fitting.CONCLUSION
IVIM biexponential analysis can help extract the perfusion component from the diffusion coefficient, leading to a more accurate measurement of the latter in the setting of PCa.Acknowledgements
The study is supported by NIH R01 CA160902, NIH U01 CA151261 and P41 EB015898.References
1. Le Bihan D, Breton E, Lallemand D, Aubin ML, Vignaud J, Laval-Jeantet M. Separation of diffusion and perfusion in intravoxel incoherent motion MR imaging. Radiology. 1988;168: 497-505.
2. Riches SF, Hawtin K, Charles-Edwards EM, de Souza NM. Diffusion-weighted imaging of the prostate and rectal wall: comparison of biexponential and monoexponential modelled diffusion and associated perfusion coefficients. NMR in Biomedicine. 2009;22: 318-325.
3. Pang Y, Turkbey B, Bernardo M, et al. Intravoxel incoherent motion MR imaging for prostate cancer: an evaluation of perfusion fraction and diffusion coefficient derived from different b-value combinations. Magn Reson Med. 2013;69: 553-562.
4. Mulkern RV, Barnes AS, Haker SJ, et al. Biexponential Characterization of Prostate Tissue Water Diffusion Decay Curves Over an Extended b-factor Range. Magnetic Resonance Imaging. 2006;24: 563-568.
5. Ueda Y, Takahashi S, Ohno N, et al. Triexponential function analysis of diffusion-weighted MRI for diagnosing prostate cancer. J Magn Reson Imaging. 2016;43: 138-148.
Figures