4379
Use of Texture Analysis to Predict Prostate Artery Embolization Outcomes with MR imaging1Warwick Medical School, University of Warwick, Coventry, United Kingdom, 2Radiology Department, University Hospitals Coventry & Warwickshire NHS Trust, Coventry, United Kingdom, 3Radiology Department, University Hospital Southampton NHS Foundation Trust, Southampton, United Kingdom
Synopsis
Pre-prostate artery embolization (PAE) magnetic resonance images (MRI) from patients with benign prostatic hypertrophy (BPH) were segmented and analysed using two different texture analysis software, qMaZda and TexRad. Percentage reduction in prostate volume and percentage reduction in the International Prostate Symptom Score (IPSS) were used as MRI based outcome measures to build models to be able to predict outcomes from PAE. MRI texture analysis using qMaZda with a linear regression model is able to somewhat predict the percentage prostate volume reduction three months after PAE but not the percentage reduction in IPSS.
Introduction
According to a recent systematic review prostate artery embolization (PAE) improves lower urinary tract symptoms (LUTS) secondary to benign prostatic hypertrophy (BPH) in short- and mid-term follow-up periods but more evidence is required from long-term studies 1. Transurethral resection of the prostate (TURP) and open prostatectomy (OP) are currently considered the standard surgical procedures for treatment of severe LUTS secondary to BPH. PAE is a promising minimally invasive procedure especially suited for patients unsuitable for major surgical procedures or do not wish major surgery 1. Currently there is no clear evidence as to which patients with BPH might benefit from PAE. In this study we explore the possibility of predicting PAE outcomes using magnetic resonance (MR) imaging. The images were analysed using TexRAD, a commercial research software (TexRAD Ltd, www.texrad.com; Feedback Plc, Cambridge, UK) as well as using qMaZda 2, a free online software. Both programs are quantitative texture analysis packages that produce a statistical characterisation of the images. TexRad and qMaZda differ insofar as qMaZda generates a large number of textural parameters, while TexRAD applies a filter to images to enhance small lesions and reduce noise. Texture analysis has been used correlate features of MRI with prostate cancer aggressiveness 3 or outcomes after treatment 4 but neither qMaZda nor TexRAD has been used for this purpose.Methods
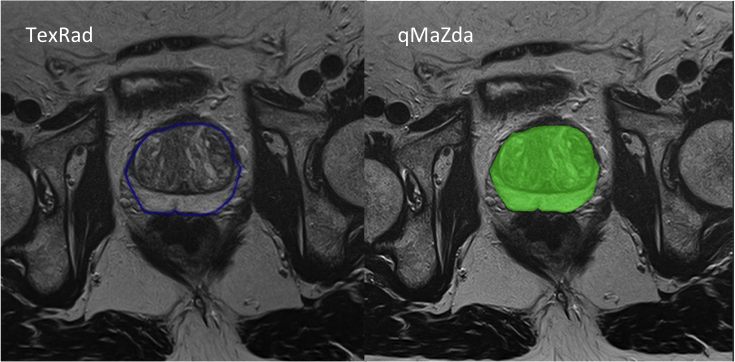
Pre-embolization T2-weighted MR images from 25 patients who participated in UK-ROPE (NCT02434575) were used for the study. Regions of interest tracing the prostate capsule encompassing the whole prostate were manually defined on axial MR images (Figure 1). Texture analysis was done using TexRAD and qMaZda. The data from TexRAD and qMaZda was separately analysed using data-mining software, Weka (Waikato Environment for Knowledge Analysis v 3.8.1; University of Waikato) 5. Percentage reduction in prostate volume and percentage reduction in the International Prostate Symptom Score (IPSS) three months after prostate artery embolization were used as independent outcome measures for analysis. As IPSS was only available for 19 patients, six were omitted from percentage IPSS reduction analysis. Age at the time of pre-embolization MRI was included as an attribute. Data from 1/3 of the slices were used as a test set while the model was built on the remaining 2/3 of the data sets. The test sets were randomly picked from the data by two methods: by randomly assigning all slices from a patient to the test set, or by randomly assigning 1/3 of slices from all patients to the test set. Linear regression was used for model building to identify whether it is possible to predict outcomes from texture analysis.Results
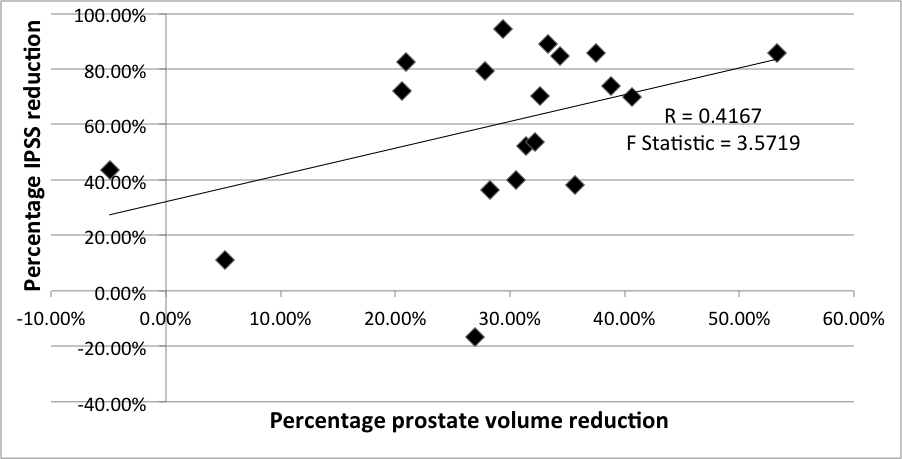
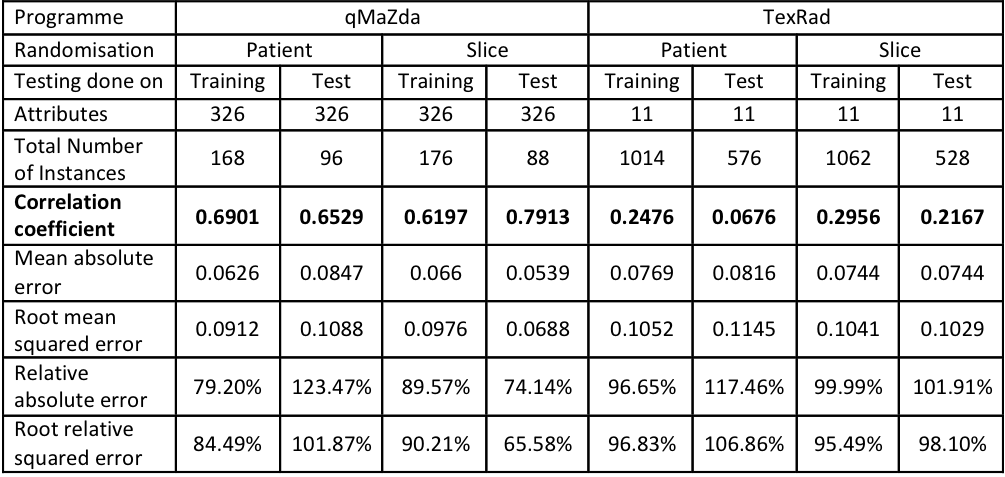
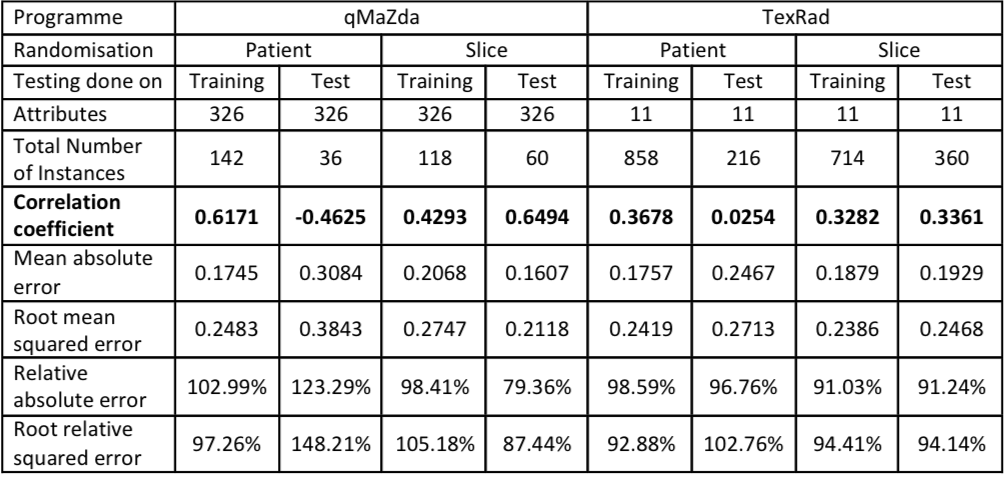
For the two outcome measures, percentage reduction in prostate volume and percentage reduction in IPSS, the correlation coefficient was 0.4167 showing little linear correlation between the two outcomes (Figure 2). For 19 data points, if F statistic is higher then 4.451 the result is significant at 5% level. The F statistic was 3.5719 showing there is no significant correlation between the outcomes. Linear regression models were built to predict outcomes based on qMaZda and TexRad, and the training set outcomes data for percentage prostate volume reduction (Table 1). qMaZda modelled outcomes show reasonable correlation with actual outcomes, with correlation coefficients consistently above 0.6 regardless of whether the data is being tested on the training data or the test data, or whether the data sets were picked randomly based on patients or based on slices. Data from TexRad shows little and inconsistent correlation. The results from the linear regression analysis of qMaZda and TexRad data for percentage IPSS reduction are shown in Table 2. Data from qMaZda model outcomes do not consistently show correlation with percentage IPSS reduction. Data from TexRad shows again no correlation.Discussion
Based on the results of the current study, it may be possible to predict the percentage of prostate volume reduction a patient will experience post-PAE using MRI based texture analysis parameters obtained from qMaZda. However, the reduction in prostate volume does not correlate with a reduction in prostate symptoms, and it was not possible based on the current study to predict percentage reduction in IPSS using texture analysis of pre-embolization MR images.Conclusion
The results of the study are limited by the amount of data available. This is in part due to MR imaging of prostate not being routine prior to prostate artery embolization. Larger studies are needed to determine whether it is possible to predict which patients would have a poor response to PAE based on lack of improvement in their quality of life and prostate symptoms.Acknowledgements
No acknowledgement found.References
1. Pyo JS, Cho WJ. Systematic review and meta-analysis of prostatic artery embolisation for lower urinary tract symptoms related to benign prostatic hyperplasia. Clin Radiol. 2017;72(1):16-22.
2. Materka A. Texture analysis methodologies for magnetic resonance imaging. Dialogues Clin Neurosci. 2004;6(2):243-50.
3. Nketiah G, Elschot M, Kim E, Teruel JR, Scheenen TW, Bathen TF, et al. T2-weighted MRI-derived textural features reflect prostate cancer aggressiveness: preliminary results. Eur Radiol. 2017;27(7):3050-9. 4. Gnep K, Fargeas A, Gutiérrez-Carvajal RE, Commandeur F, Mathieu R, Ospina JD, et al. Haralick textural features on T2 -weighted MRI are associated with biochemical recurrence following radiotherapy for peripheral zone prostate cancer. J Magn Reson Imaging. 2017;45(1):103-17.
5. Hall M, Frank E, Holmes G, Pfahringer B, Reutemann P, Witten IH. The WEKA data mining software: an update. SIGKDD Explor Newsl. 2009;11(1):10-8.
Figures