4376
Does Machine Learning, As An Independent Arbitrator Of MR Contrast-Ranking In Prostate Cancer Exams, Agree With PI-RADS version 2?1Steve Patterson, Nova Scotia Health Research Foundation, Halifax, NS, Canada, 2Faculty of Computer Science, Dalhousie University, Halifax, NS, Canada, 3Diagnostic Radiology, Dalhousie University, Halifax, NS, Canada, 4Biomedical Translational Imaging Centre, Nova Scotia Health Authority, Halifax, NS, Canada, 5Physics and Atmospheric Science, Dalhousie University, Halifax, NS, Canada, 6Anatomical Pathology, Dalhousie University, Halifax, NS, Canada
Synopsis
We show that a simple machine learning algorithm validated most, but not all, aspects of the Prostate Imaging Reporting and Data System (PI-RADS) version 2 formalism derived exclusively from clinical perspectives. Specifically, the value of diffusion-weighted imaging (DWI) and dynamic contrast-enhanced (DCE) sequences in the peripheral zone was confirmed. In contradistinction to PI-RADS, DWI was found to be more valuable in the transition zone than T2 weighted imaging; however, a T2 texture feature afforded a small but significant increase in classifier accuracy in this zone.
Introduction
Prostate cancer is the second most common cancer affecting men worldwide1 and has a significant socioeconomic impact2,3. Multi-parametric magnetic resonance imaging (mp-MRI) is increasingly utilized for detection and staging of prostate cancer4,5. The mp-MRI examination typically includes T2-weighted (T2w), high b-value diffusion weighted imaging (DWI), an apparent diffusion coefficient (ADC) map and dynamic contrast enhanced (DCE) sequences. Interpretation of these examinations requires considerable expertise and is subject to inter-observer variability6,7. For this reason, the Prostate Imaging Reporting and Data System (PI-RADS) version 2, an international consensus document, was created to guide radiologists’ interpretation and reporting of prostate mp-MRI8. Machine learning (ML) applied to computer assisted diagnostic development in prostate exams has rapidly progressed to the point of inevitability9-11. This prompts two questions: Do ML algorithms agree with the PI-RADS ranking of relevant contrasts, and what quantitative value is provided by giving contrast agents in prostate exams?
We hypothesized that ML would independently rank the value of the contrasts similar to PI-RADS, thus providing independent validation of the choices made in the paradigm.
Methods
Fifteen subjects referred for clinically indicated mp-MRI who subsequently underwent radical prostatectomy were prospectively recruited. Subjects were scanned on a 3T MR750 (General Electric Healthcare, Milwaukee, WI, USA) with a 32 channel phased array receive coil (Invivo Corp, Gainesville, FL, USA) and no endorectal coil. Axial T2w, DWI, and DCE sequences were acquired through the prostate as per institutional protocol. The ADC and Ktrans maps were created with the vendor’s software.
Radiology - Pathology Correlation
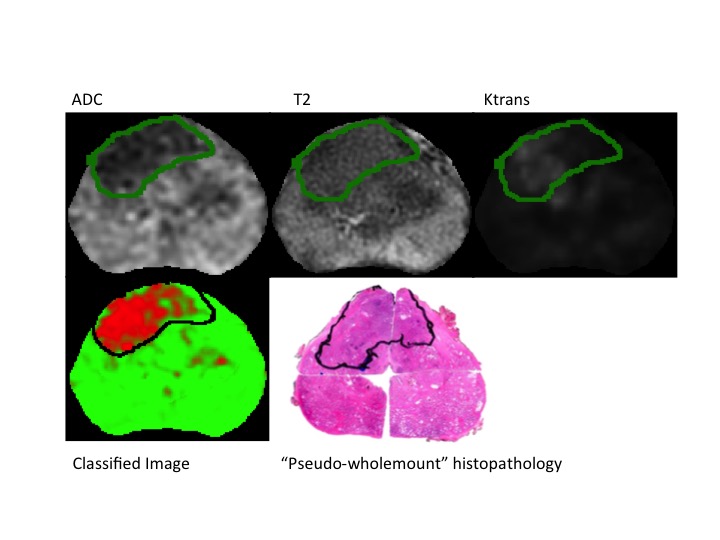
Prostatectomy specimens were grossed and the corresponding slides annotated by one of two genitourinary pathologists (JM or CW) who were blinded to the MRI data. Annotated slides outlining the tumour were scanned and digitally reconstructed to create pseudo-wholemount specimens. A fellowship trained abdominal radiologist (SC) correlated the histopathological sections with the MR images and manually delineated the tumour margins on either T2w or ADC maps, according to PIRADS 2.
Model Development and Validation
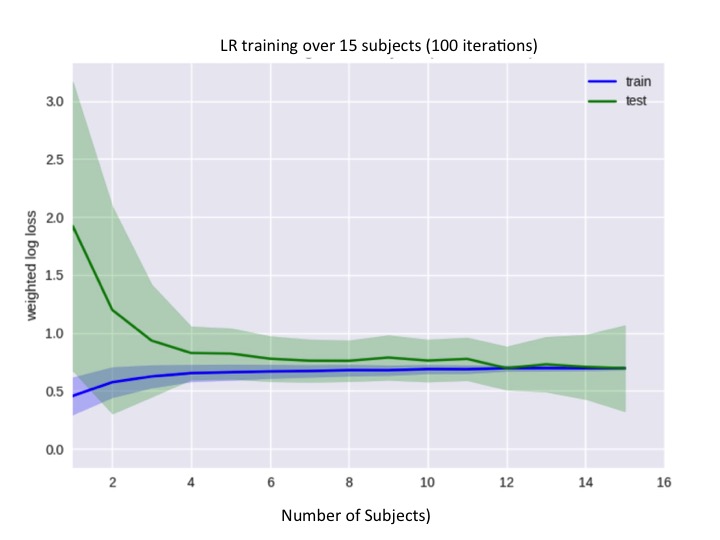
A logistic regression (LR) model was used for this analysis because it is a low-variance model suitable for small training sets; learning curves were examined to verify that our dataset was sufficiently large for a stable model fit (Figure 1), and LR is an interpretable model that allows for the relative importance of different contrasts (or features) to be determined. The set of features used was ADC, T2w, T2 spatial standard deviation (T2std) as a simple measure of texture, and Ktrans.
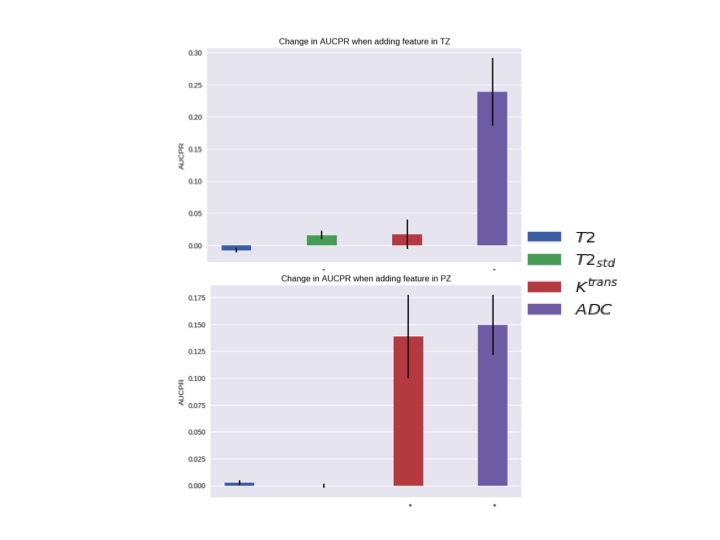
Model performance was evaluated using leave-one-subject-out cross validation and the fitted model was evaluated using the area under the precision-recall curve (AUPRC). Precision and recall are also known as positive predictive value and sensitivity, respectively. AUPRC is more sensitive than area under the receiver operating characteristic curve (AUROC) to improvements in model performance when AUROC is high (> 0.8) and class imbalance is large12. The importance of individual contrasts was determined by computing the change in AUPRC when that contrast was left out of the model. The Wilcoxon signed rank test was used to evaluate the significance of the change in AUPRC caused by leaving out a contrast.
Results
The LR model performed well with an average AUROC of 0.89 + 0.015 (standard error) across left-out subjects. An example of model performance is shown in Figure 2. The effect of each MR feature on AUPRC for both the peripheral zone (PZ) and transition zone (TZ) is shown in Figure 3.Discussion
Our simple ML algorithm, as an independent arbitrator, has validated several aspects of the PI-RADS formalism derived exclusively from clinical perspectives. For example, both found that 1) ADC is more important than T2w in the PZ (noted by others13) and 2) DCE MRI is valuable in the PZ but not the TZ. In fact, Ktrans provided nearly the same average AUPRC benefit in PZ tumours as ADC, supporting continued use of contrast in MR prostate exams. However, the model suggests that ADC is the also the most important sequence in the TZ, unlike PI-RADS 2, where T2 is considered the dominant sequence. A possible explanation is that both TZ tumours and stromal benign prostatic hyperplasia (BPH) nodules are hypo-intense on T2w images; however, BPH nodules are typically well-circumscribed and encapsulated, while tumours are homogenous with an “erased charcoal” appearance8. Given that T2std significantly increased AUPRC in the TZ, we conclude that image texture is more important than T2 intensity. More sophisticated algorithms, such as convolutional neural networks, may inherently incorporate texture features and thus provide improved performance.Conclusion
An ML approach confirmed most, but not all, aspects of the PI-RADS 2 paradigm. Discrepancies may help to inform future ML models or PI-RADS updates.Acknowledgements
This work is supported by the Atlantic Innovation Fund, an Investigator Sponsored Research Agreement with GE Healthcare and the Radiology Research Foundation.References
1. Ferlay J, Soerjomataram I, Dikshit R, et al. Cancer incidence and mortality worldwide: Sources, methods and major patterns in GLOBOCAN 2012. Int J Cancer 2014; 136: E359–86.
2. Krahn MD, Zagorski B, Laporte A, et al. Healthcare costs associated with prostate cancer: estimates from a population-based study. BJU Int 2010; 105: 338–46.
3. Roehrborn CG, Black LK. The economic burden of prostate cancer. BJU Int 2011; 108: 806–13.
4. Salami SS, Vira MA, Turkbey B, et al. Multiparametric magnetic resonance imaging outperforms the Prostate Cancer Prevention Trial risk calculator in predicting clinically significant prostate cancer. Cancer 2014; 120: 2876–82.
5. Litwin MS, Tan H-J. The Diagnosis and Treatment of Prostate Cancer. JAMA 2017; 317: 2532–42.
6. Hambrock T, Vos PC, Hulsbergen-van de Kaa CA, Barentsz JO, Huisman HJ. Prostate Cancer: Computer-aided Diagnosis with Multiparametric 3-T MR Imaging--Effect on Observer Performance. Radiology 2013; 266: 521–30.
7. Rosenkrantz AB, Ginocchio LA, Cornfeld D, et al. Interobserver Reproducibility of the PI-RADS Version 2 Lexicon: A Multicenter Study of Six Experienced Prostate Radiologists. Radiology 2016; 280: 793-804.
8. Weinreb JC, Barentsz JO, Choyke PL, et al. PI-RADS Prostate Imaging – Reporting and Data System: 2015, Version 2. European Urology 2016; 69: 16–40.
9. Litjens G, Debats O, Barentsz J, Karssemeijer N, Huisman H. Computer-Aided Detection of Prostate Cancer in MRI. IEEE Trans Med Imaging 2016; 33: 1083–92.
10. Erickson BJ, Korfiatis P, Akkus Z, Kline TL. Machine Learning for Medical Imaging. Radiographics 2016; 37: 505-515.
11. Metzger GJ, Kalavagunta C, Spilseth B, et al. Detection of Prostate Cancer: Multiparametric MR Imaging Models Developed by Using Registered Correlative Histopathologic Results. Radiology 2016; 279: 805-16.
12. Davis J, Goadrich M. The relationship between Precision-Recall and ROC curves. New York, New York, USA: ACM, 2006.
13. Greer MD, Shih JH, Lay N, et al. Validation of the Dominant Sequence Paradigm and Role of Dynamic Contrast-enhanced Imaging in PI-RADS Version 2. Radiology 2017; 161316–11.
Figures