4375
Quantitative T2 values for Detection and Grading of Prostate Cancer1Department of Radiology, University Hospital Jena, Jena, Germany, 2Department of Pathology, Universitiy Hospital Jena, Jena, Germany, 3Department of Statistics, University Hospital Jena, Jena, Germany, 4Siemens Healthcare AG, Erlangen, Germany, 5Department of Urology, University Hospital Jena, Jena, Germany
Synopsis
Purpose: Determination of quantitative T2 values in prostate tissue and their evaluation for detection and grading of prostate cancer.
Methods: 3T T2 maps and ADC maps of 75 patients with 857 prostate areas (378x normal, 177x cancer, 150x BPH, 119x prostatitis and 33x precancer) were determined.
Results: T2 values differed significantly between cancer and normal (AUC=0.871), between cancer and BPH (AUC=0.827) and between cancer with GleasonScore 6 and ≥ 7 (AUC=0.742). T2 relaxivities decreased with increasing GleasonScore and correlated significantly with ADC-values (r=0.772).
Conclusion: T2 values seem to be adequate for the differentiation between prostate cancer and normal tissue or BPH.
Introduction
The aim of the study was the determination of quantitative T2 values in prostate tissue and their evaluation for the detection and grading of prostate cancer.
Material and Methods
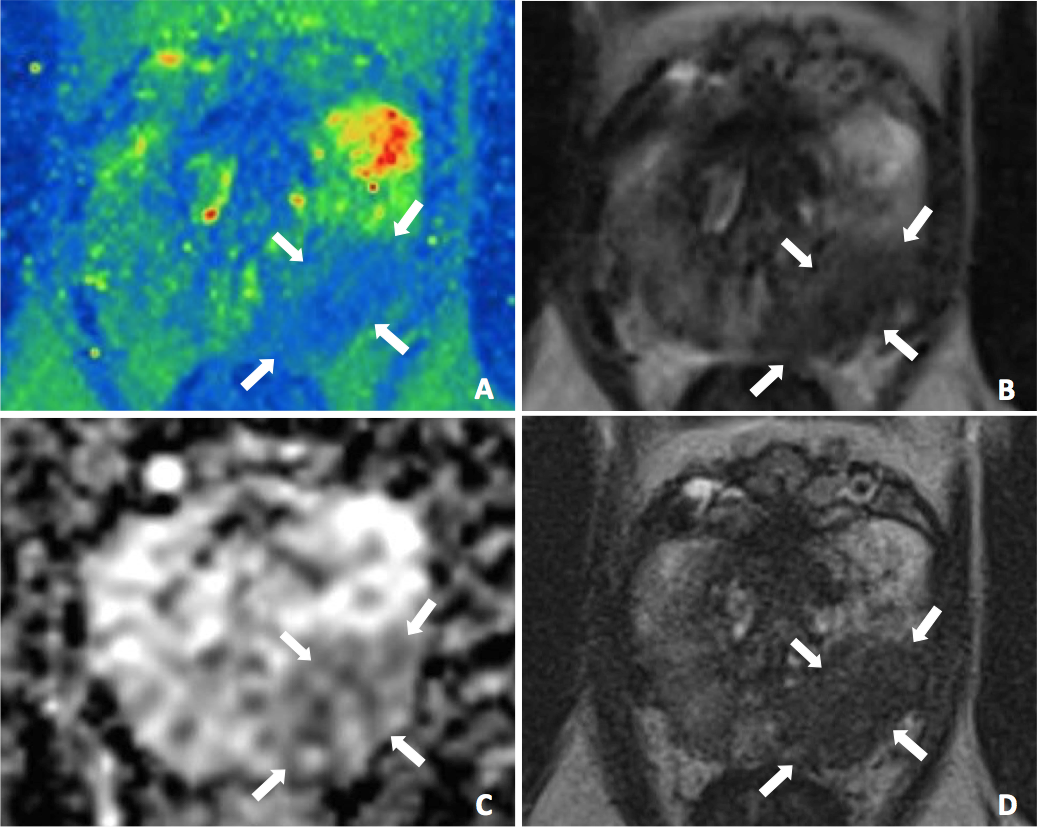
After ethical approval of the local Internal Review Board 75 men (median age: 66.3 years; median PSA: 8.2 ng/ml) with suspected prostate cancer underwent prostate MRI on a 3T MR system (MAGNETOM PRISMA, Siemens Healthcare, Erlangen, Germany). Morphological T2w-images (TR 8430ms, TE 142ms, ETL 25, voxel size 0.5x0.5x3.0mm3), ADC maps derived from diffusion-weighted images (TR 4000ms, TE 58ms, b-values 50 and 1000, voxel size 0.9x0.9x3.0mm3), T2 values obtained from a prototype multi-echo spin-echo sequence1 (TR 6820ms, TE 10-160ms in steps of 10ms, voxel size 0.8x0.8x3.0mm3) and corresponding calculated T2w-images with TE 142ms were analyzed and the diagnostic accuracies for the differentiation between prostate pathologies were evaluated. For this purpose T2 values and the ADC-values of 378 areas with normal prostate tissue, 177 areas with prostate cancer (54x GleasonScore 6, 98x GleasonScore 7, 25x GleasonScore 8), 150 areas with BPH-nodules, 119 areas with prostatitis and 33 areas with precancerous tissue (27x PIN, 6x ASAP) were determined. In a second step an experienced reader assessed the detection of prostate cancer using the morphological and the calculated T2w-images. Therefore the prostate was divided into 36 regions. For each region the reader, who was blinded for the histology results, provided a sore for the presence of cancer on a five-point PI-RADS v2 scale. Gold standard were the histology results of whole-mount pathology specimens (16 patients), MRI-guided in-bore biopsies (32 patients), MRI/TRUS fusion biopsies (15 patients) and systematic twelve-core TRUS-guided biopsies (12 patients). Significance was presumed with p<0.05.
Results
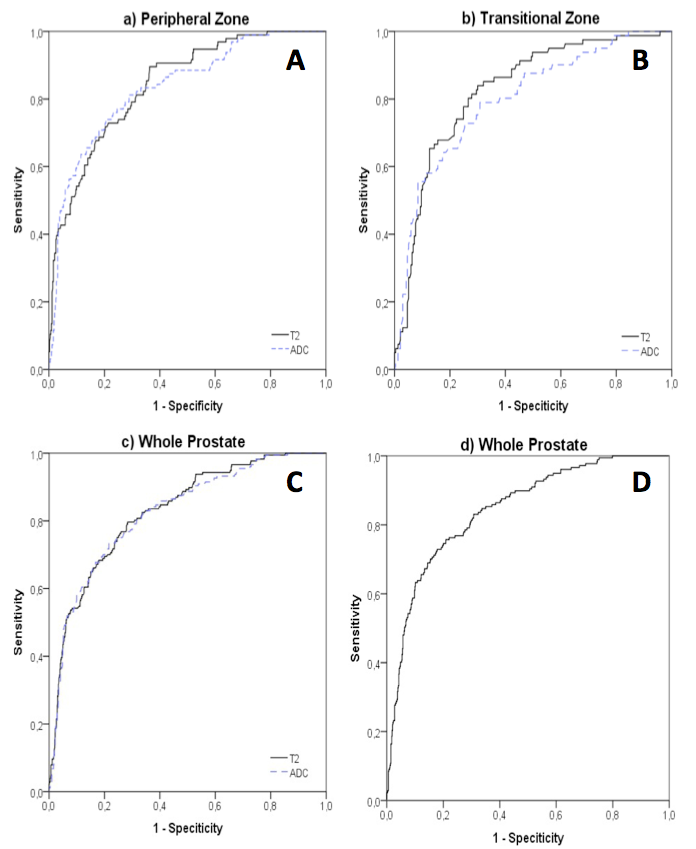
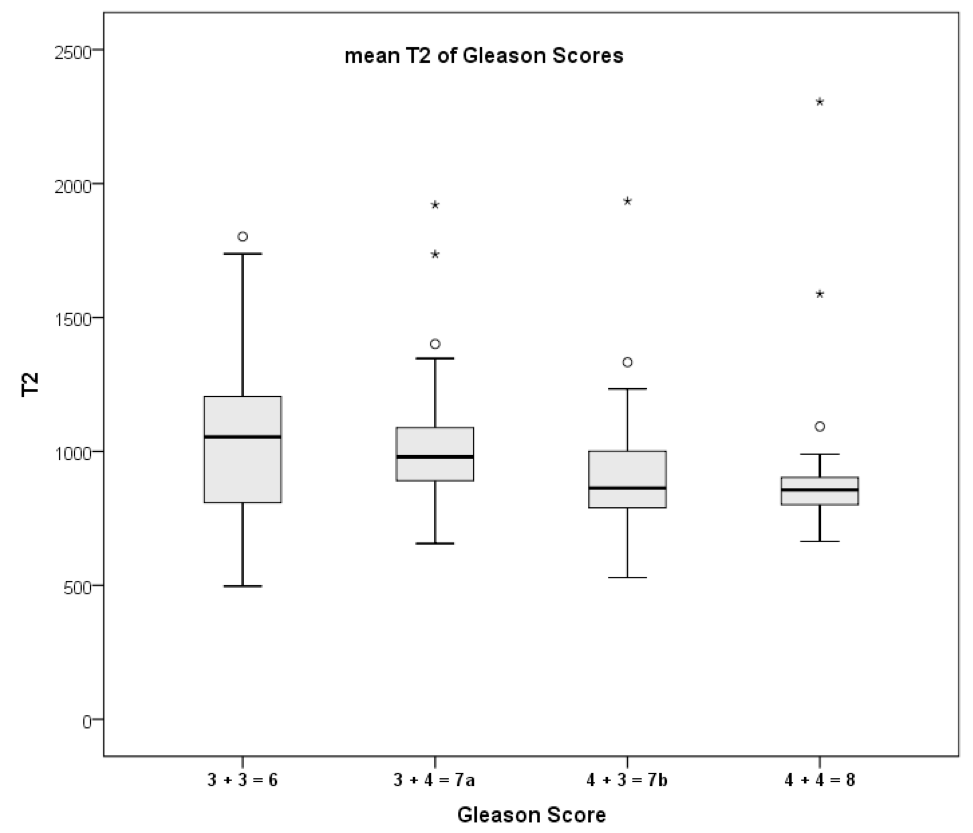
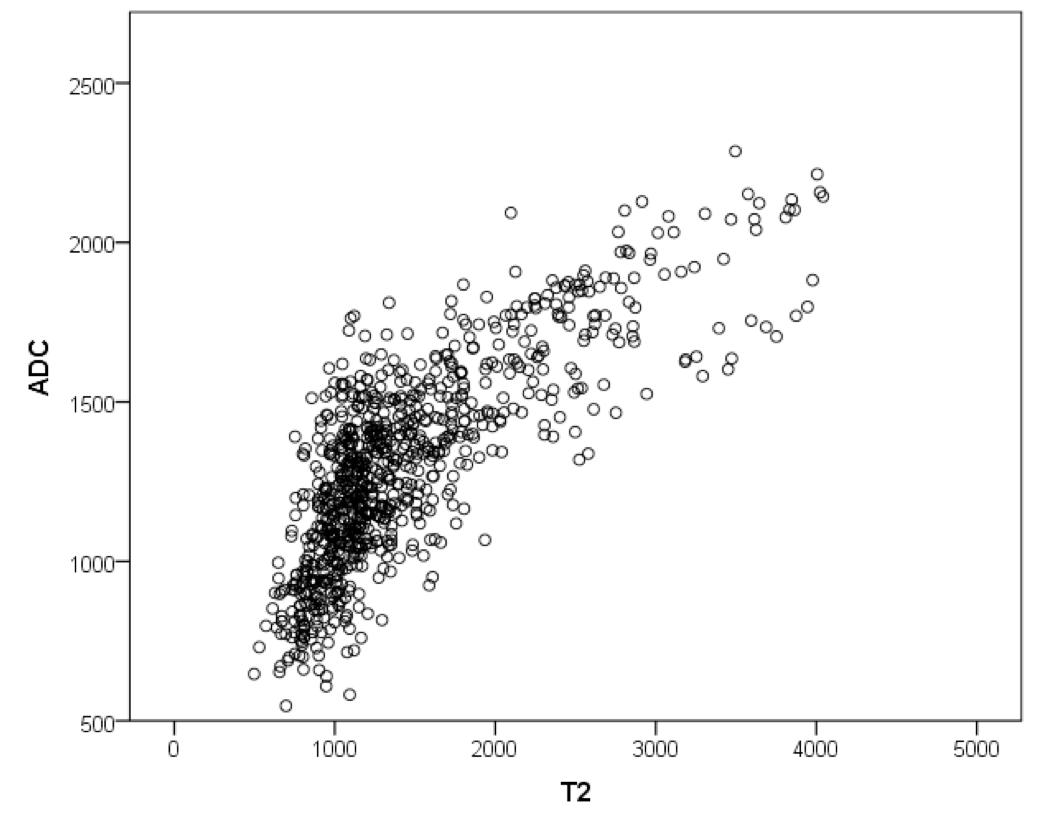
T2 values differed significantly between prostate cancer and normal prostate tissue (AUC=0.871, p<0.01), between prostate cancer and BPH-nodules in transition zone (AUC=0.827, p<0.01) and between prostate cancer with GleasonScore 6 and ≥ 7 (AUC=0.742, p<0.01) (figure 1, 2). The combination of T2 values and ADC-values showed a slightly statistically not significant increase of AUC of ROC analysis (AUC=0.877, 0.859 and 0.755 respectively). The T2 values decreased with increasing GleasonScore (r=-0.261, p<0.01) and correlated significantly with the ADC-values (r=0.772, p<0.01) (figure 3, 4). The detection accuracy of prostate cancer on morphological T2w-images (AUC=0.658) and calculated T2w images (AUC=0.682) was not significantly different statistically (p=0.14).Discussion
T2 maps in the peripheral and transition zone are suitable for the detection of prostate cancer. Prostate cancer can be distinguished from normal prostate tissue as well as from benign changes of the prostate and precancerous tissue. T2 values also allow the differentiation between low and intermediate/ high-grade prostate cancers in the peripheral zone. In the transition zone, the differentation between low and intermediate/ high-grade prostate cancers with T2 values is not possible. T2 values and ADC values show a high correlation with r = 0.772 (p <0.01), therefore the combination of the two parameters lead only to a small diagnostic benefit. Just like for the ADC values, there is a significant inverse correlation between T2 values and Gleason Score, although there is a considerable overlap between the different Gleason Score groups.Conclusion
T2 values seem to be adequate for the differentiation between prostate cancer and normal prostate tissue or BPH nodules. Similar to the ADC-values, they provide valuable information about the aggressiveness of prostate cancer.Acknowledgements
No acknowledgement found.References
1 Hilbert T, Kober T, Sumpf TJ, et al. MARTINI and GRAPPA - When Speed is Taste. Proc Intl Soc Ma Reson Med. 2014Figures