4374
The effects of dutasteride on quantitative T2 and T2-weighted imaging in men on active surveillance for prostate cancer: results from a placebo-controlled, randomized clinical trial1Radiology, University College London Hospital NHS Foundation Trust, London, United Kingdom, 2Division of Surgery & Interventional Science, University College London, London, UK, London, United Kingdom, 3INSERM, U1099, Rennes, France, 4Université de Rennes 1, LTSI, Rennes, F-35000, France, 5Urology, University College London Hospital NHS Foundation Trust, London, United Kingdom
Synopsis
We investigated MRI changes in quantitative T2 parameters in lesions and healthy tissue in men on active surveillance (AS) for prostate cancer (PCa) taking dutasteride or placebo for six months. The protocol included a multi-echo sequence for quantification of the T2 relaxation times. A synthetic signal contrast (T2Q) between lesion and healthy tissue was assessed using quantitative T2 values. Signal contrast was calculated using T2-weighted sequence (T2W contrast). No differences for T2W contrast were observed. A significant correlation between T2Q and T2W contrast was shown. Dutasteride does not influence T2 contrast and relaxation in men on AS for PCa.
INTRODUCTION
Multiparametric magnetic resonance imaging (mpMRI) plays a crucial role in the diagnosis and risk stratification of men with prostate cancer (PCa). High resolution T2-weighted imaging (T2-WI) is employed in the mpMRI protocol for detection of lesions. Quantitative measurements of tissue T2 relaxation time – which are not typically used in prostate mpMRI - can be of interest when evaluating the tumor response to therapy, since they can provide additional insight into the changes in tumor microenvironment. Dutasteride reduces prostate volume, and there is evidence that it may delay the rate of progression in men on active surveillance (AS) for PCa1. Our aim was to evaluate the role of quantitative T2 outputs in men on AS exposed to dutasteride2.METHODS
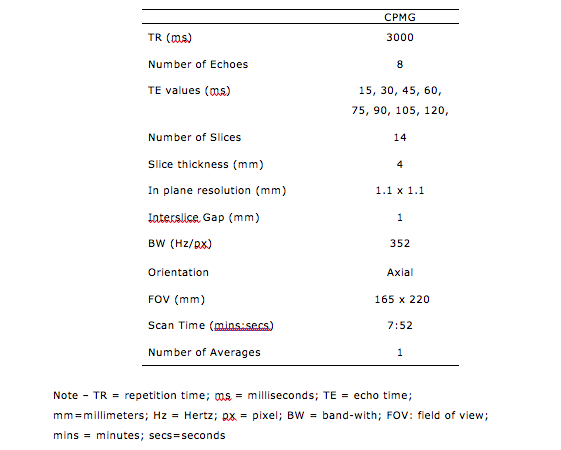
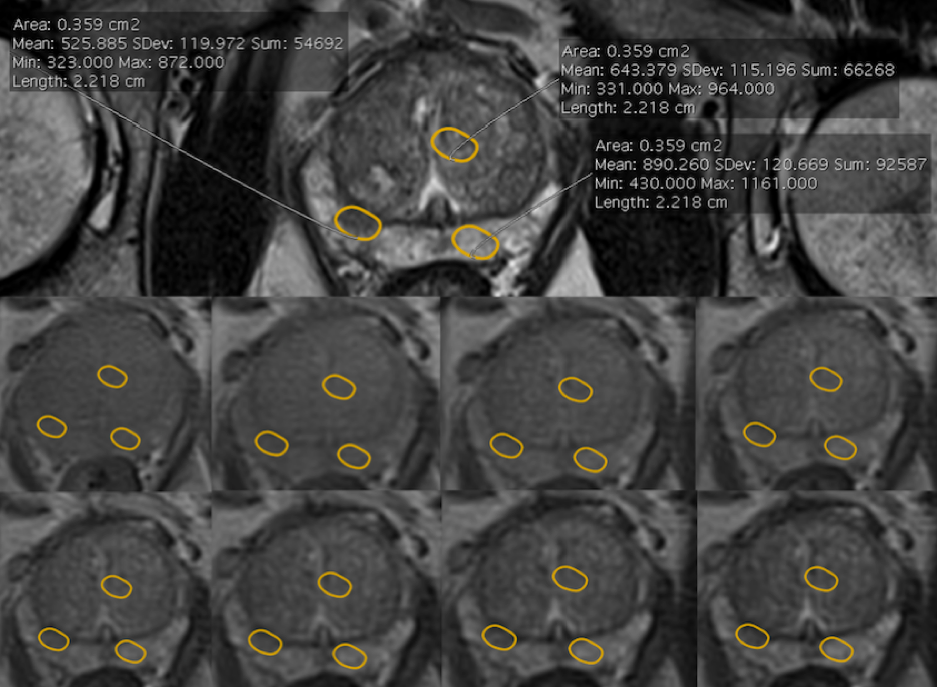
Forty men with PCa on AS were individually randomized (1:1) to daily placebo or dutasteride for 6 months. 3T mpMRI was performed at baseline and after 6 months. In addition to the standard mpMRI protocol, quantitative T2 imaging was performed with a multi-echo approach based on the Carr-Purcell-Meibom-Gill (CPMG) imaging sequence3. The CPMG protocol was optimized to ensure a good compromise between in-plane spatial resolution, the sampling of the T2 relaxation decay and the signal-to-noise ratio (Table 1). Regions of interest (ROIs) on the index lesion on the T2-weighted high-resolution images were chosen. The ROI was copied and pasted in the non-cancerous peripheral (PZ) and transitional (TZ) zone, in mirror position to the lesion (Fig. 1). The signal values from this sequence were defined as T2-weighted (T2W). The three ROIs were copied and pasted on the multi-echo CPMG sequence. T2 data fitting was performed using MATLAB. For each patient, we measured the signal intensity of the lesion (SL) and compared it to the signal intensity of presumed non-cancer tissue in mirror position on T2-WI. T2W contrast between a lesion in the PZ and the non-cancerous tissue was defined as (SPZ - SL)/SPZ . To investigate whether there was a correlation between the T2-weighted and the quantitative T2 imaging data, we calculated a ‘synthetic’ contrast (T2Q contrast) using the T2 values obtained from the CPMG data fitting. Median baseline and 6-month T2 values and contrast were compared for each arm (Wilcoxon and Mann-Whitney tests). The relationship between T2W and T2Q contrast was assessed (Spearman’s correlation).RESULTS
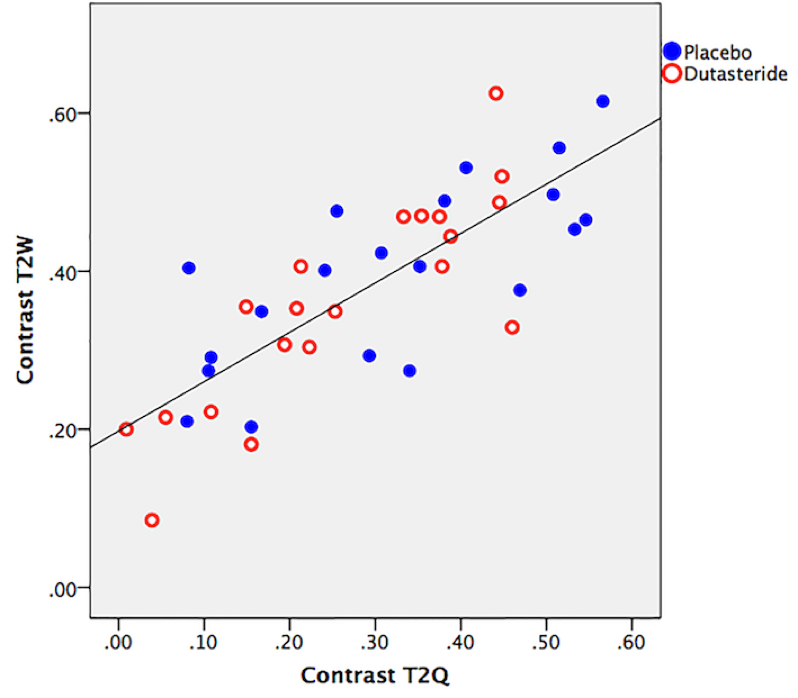
The value of T2 relaxation time in healthy prostate and in lesions did not change following dutasteride [baseline T2 lesion: 80.5 ms (74.2-89.5 ms); at 6 months: 81.9 ms (72.4-85.8 ms]. Furthermore, no significant differences for T2W contrast at baseline and after 6 months were observed, both in the placebo [0.40 (0.29-0.49) vs 0.43 (0.25-0.49); p=0.881] and dutasteride arm [0.35 (0.24-0.47) vs 0.37 (0.22-0.44); p = 0.668]. Additionally, there were no significant differences in T2W contrast between the placebo and the dutasteride arm at baseline [0.40 (0.29-0.49) vs 0.35 (0.24-0.47); p = 0.409] and after 6 months [0.43 (0.25-0.49) vs 0.37 (0.22-0.44); p=0.372]. There was a significant, positive correlation between T2W and T2Q contrast values (r=0.786; p < 0.001), as shown in Fig. 2.DISCUSSION
It is known that antiandrogen therapy affects prostatic tissues, which inevitably affects the interpretation of mpMRI studies. Our study indicated that the tissue T2 relaxation time, T2Q contrast and T2W contrast values appear to be unaffected by exposure to dutasteride. Considerable variability of the contrast in the T2-WI was observed; same consideration applies to quantitative T2 measurements, where different T2 values were measured in different patients. The correlation found between the contrast measured on the T2-weighted images and the “synthetic” contrast calculated from the quantitative T2 measurement indicates that the variability could be partly explained by inter-individual differences. Following our definition of contrast, we could consider this parameter as a surrogate of the conspicuity of the lesion on T2-WI. It follows that the use of dutasteride does not seem to influence lesion conspicuity on T2-WI (i.e. the lesion is still detectable after treatment). This suggests that the drug may not impair our ability to measure and monitor tumor volume in AS.Acknowledgements
The authors are indebted to all the men who greatly contributed to the realization of this study.
ME is a UK National Institute of Health Research (NIHR) Senior Investigator. In addition, he receives research support from the UCLH/UCL NIHR Biomedical Research Centre. AK receives research support from the UCLH/UCL NIHR Biomedical Research Centre.
The study was investigator-led and sponsored by UCL. The study was supported financially by GSK who also provided supplies of both drug and placebo. GSK had no input into the design, conduct and analysis of the study. The manuscript has been reviewed by GSK but final editorial control rests with the principal investigator (ME), who serves as guarantor of the study.
References
1. Fleshner E, Lucia MS, Egerdie B et al. Dutasteride in localised prostate cancer management: the REDEEM randomised, double blind, placebo-controlled trial. Lancet 2012;379:1103–1111.
2. Robertson NL, Moore CM, Ambler G, et al. MAPPED study design: A 6-month randomised controlled study to evaluate the effect of dutasteride on prostate cancer volume using magnetic resonance imaging. Contemp Clin Trials 2013;34:80-89.
3. Roebuck JR, Haker SJ, Mitsouras D, Rybicki FJ, Tempany CM, Mulkern RV. Carr-Purcell-Meiboom-Gill imaging of prostate cancer: quantitative T2 values for cancer discrimination. Magn Reson Imaging 2009;27:497-502.
Figures