4373
Diagnosis of Prostate Cancer using MRI derived quantitative Risk Maps1Department of Radiology, University of Chicago, Chicago, IL, United States, 2Sino-Dutch Biomedical and Information Engineering School, Northeastern University, Shenyang, China, 3Department of Pathology, University of Chicago, Chicago, IL, United States, 4Philips Research North America, Cambridge, MA, United States
Synopsis
This study develops a new tool that estimates the risk map for prostate cancer using quantitative mpMRI metrics and investigates the feasibility of this tool in screening for PCa. Quantitative mpMRI parameters: ADC, T2 and DCE signal enchantment values were calculated and subsequently cancer presence was predicted based on estimated risk scores. The sensitivity, specificity, positive predictive value and negative predictive value for PCa detection using a sector based analysis were 75.0%, 88.6%, 84.7% and 80.8% respectively. The area under the curve in ROC analysis was 0.818. Importantly, all the index lesions were identified by the risk map tool.
Introduction
Multiparametric MRI (mpMRI) is increasing being used for prostate cancer diagnosis. While mpMRI is very good at detecting the index lesion, many cancers are missed. In addition, benign conditions such as benign prostatic hyperplasia, prostatitis, etc. can mimic PCa (1). Computer aided diagnosis (CAD) tools have been shown to be effective in aiding radiologists in PCa diagnosis (2,3). However, CAD systems are not suitable for independent PCa diagnosis, especially since they have low specificity and high false positives. This study develops a new tool that estimates the risk map for prostate cancer using quantitative mpMRI metrics and investigates the feasibility of this tool in screening for PCa.Methods
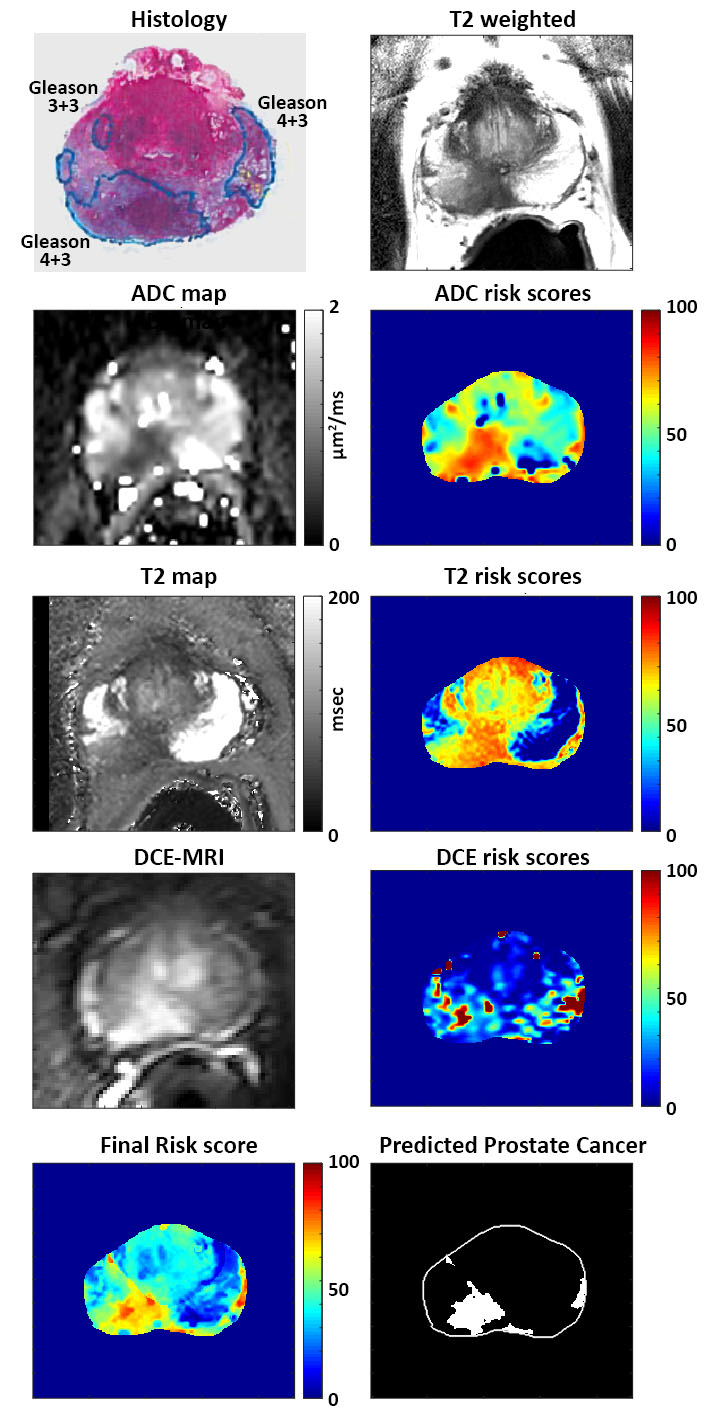
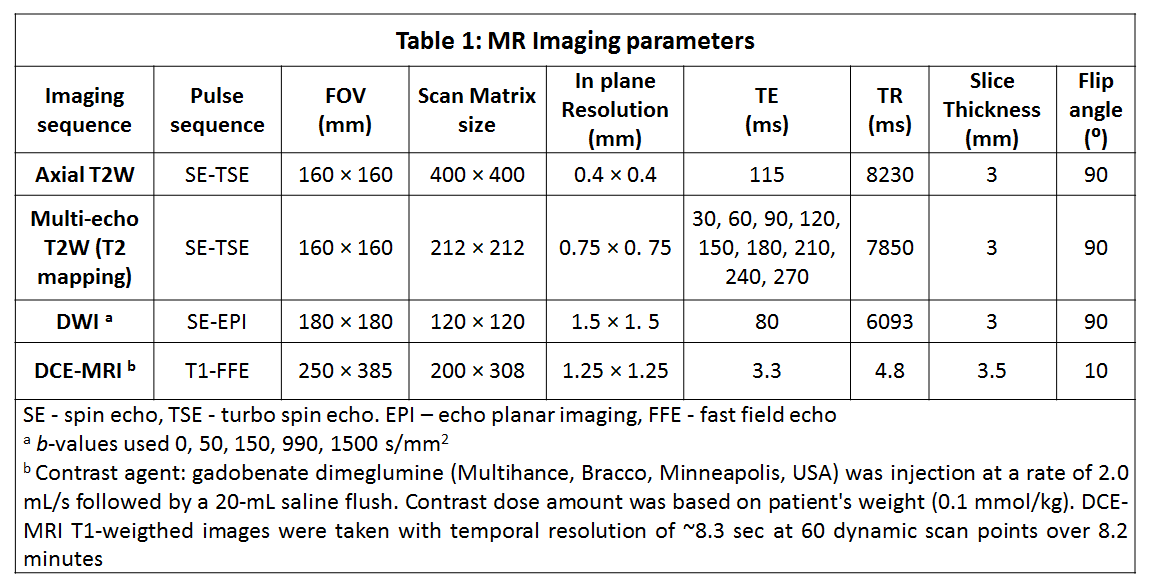
Patients (n=22) with histologically confirmed PCa underwent preoperative prostate mpMRI on 3T Philips Achieva scanner using a 6-channel cardiac phased array coil placed around the pelvis combined with an endorectal coil (Medrad, Bayer Healthcare) prior to undergoing radical prostatectomy. The protocol included T2-weighted (T2W), multi-echo T2-weighted, diffusion weighted and dynamic contrast enhanced (DCE) images (see Table 1). Quantitative mpMRI metrics: ADC, T2, signal enhancement rate (α) from DCE were calculated on a voxel-by-voxel basis for the whole prostate. A custom MATLAB software co-registered these three maps to T2-weighted images matching the resolution, FOV, slice thickness, etc. The whole prostate and central gland (CG) were marked by a radiologist. A normalized risk value (0-100) for each mpMRI parameters were obtained with high risk values associated with low T2 and ADC, and high α.
ADC Risk score = 100 × (maximum_ADC – voxel_ADC) / maximum_ADC [1]
T2 Risk score = 100 × (maximum_T2 – voxel_T2) / maximum_T2 [2]
DCE Risk score = 100 × voxel_α / maximum_α [3]
where maximum_ADC = 3.0 µm2/ms, maximum_T2 = 250 msec and maximum_α = 10% per sec, and voxel_ADC, voxel_T2 and voxel_ α are the ADC, T2 and α values for the voxel for which the risk is estimated.
Since, CG is a region that typically has false positives on DCE due to high α (similar to PCa), the DCE risk scores are halved. The final risk map which is a weighted sum of the risk scores (ADC 40%, T2 40%, DCE 20%) is displayed. Five patients were used as test set to find the threshold for predicting PCa using Youden’s index from ROC analysis and visual inspection of a radiologist. In the subsequent 17 patients, any voxel with risk score above the threshold final risk score was considered cancer. The final predicted PCa map was displayed after using a filter where any region with a minimum of 30 conjoint voxels (~4.8 mm2) was predicted to be a cancer lesion. Each prostate was divided into 18 sectors: 6 sectors each (CG, anterior and posterior peripheral zones in the left and right) in apex, mid and base of the prostate. A sector based analysis was performed by matching prostatectomy verified malignancy and PCa predicted by the risk analysis tool. In addition, the sensitivity for detecting the index lesion was also calculated.
Results
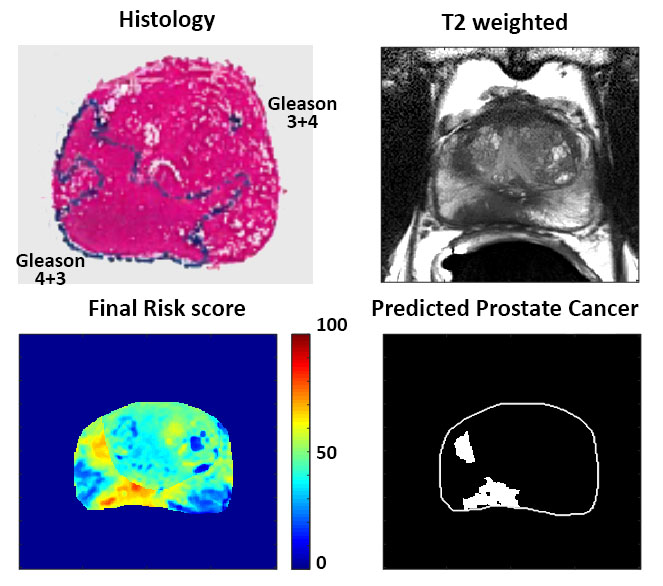
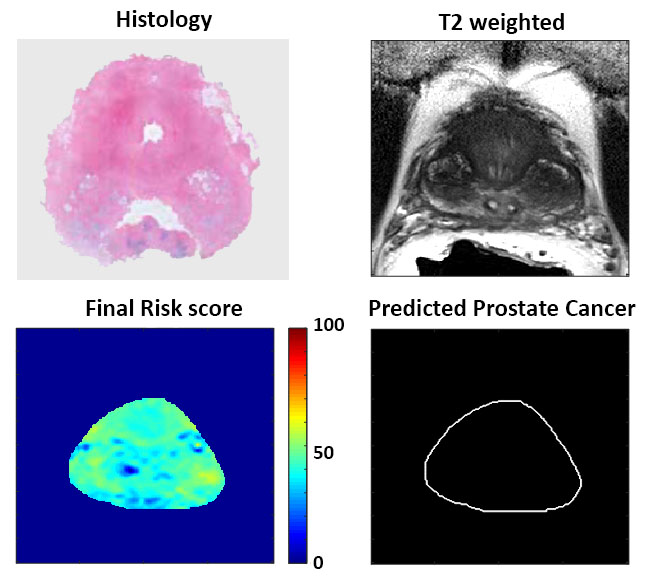
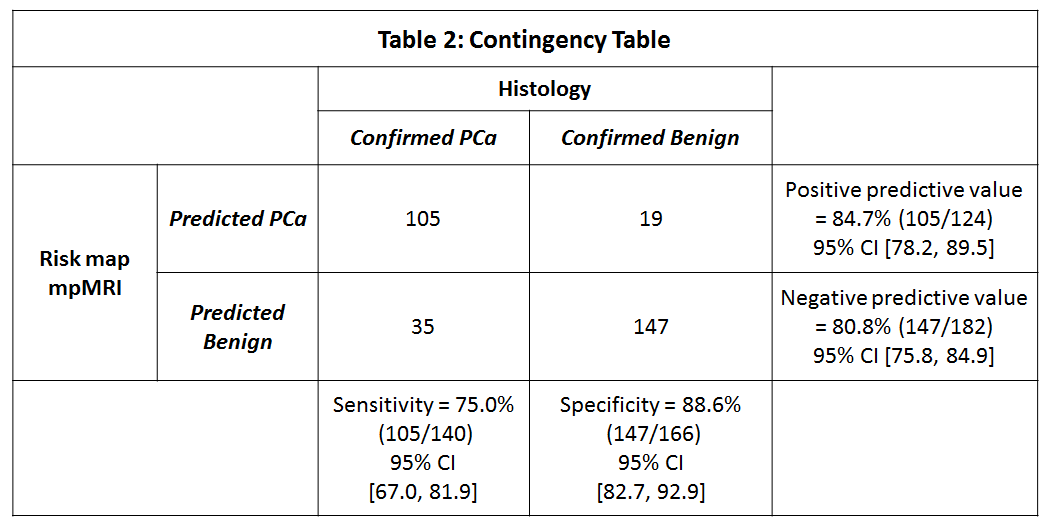
The optimal threshold for predicting PCa was found to be any value of final risk score above 60. Figure 1-3 show representative examples of risk map analysis for detecting PCa. The sensitivity, specificity, positive predictive value (PPV) and negative predictive value (NPV) for PCa detection using a sector based analysis were 75.0% (105/140), 88.6% (147/166), 84.7% (105/124) and 80.8% (147/182) respectively. The detailed contingency table is shown in Table 2. The area under the curve in ROC analysis was 0.818 (95% CI [0.767, 0.869], p=9.9×10⁻²²). Importantly, all the index lesions were identified (17/17) by the risk map tool (sensitivity=100%).Discussion
The proposed CAD system using risk map analysis shows great promise for improving PCa detection. The diagnostic accuracy is very similar to results from observer studies involving experienced radiologists using mpMRI (4). In addition, this tool has very high specificity and NPV, and thus avoids a critical drawback of most CAD tools. Importantly, the tool is able to detect the all the index lesions. The index lesions along with the Gleason score are indicators of cancer aggressiveness. Therefore, this tool can be used to guide targeted biopsies and decisions regarding treatment, and has the potential to reduce the number of unnecessary procedures and increase treatment efficiency and efficacy. This will result in significant benefits for patients while dramatically reducing costs. The predicted PCa volume is underestimated compared to histology. It is well known that mpMRI underestimates tumor volume (5) and therefore this tool has scope for improvement.Conclusion
This study demonstrates a new risk analysis tool that can effectively detect PCa and guide targeted biopsies, resulting in improved PCa diagnosis.Acknowledgements
The study was funded by Philips Healthcare and National Institutes of Health (NIH R01 CA172801 and NIH 1S10OD018448-01).References
1. Kitzing YX, Prando A, Varol C, Karczmar GS, Maclean F, Oto A. Benign Conditions That Mimic Prostate Carcinoma: MR Imaging Features with Histopathologic Correlation. RadioGraphics 2016;36(1):162-175.
2. Wang S, Burtt K, Turkbey B, Choyke P, Summers RM. Computer aided-diagnosis of prostate cancer on multiparametric MRI: a technical review of current research. Biomed Res Int 2014;789561(10):1.
3. Litjens G, Debats O, Barentsz J, Karssemeijer N, Huisman H. Computer-Aided Detection of Prostate Cancer in MRI. IEEE Transactions on Medical Imaging 2014;33(5):1083-1092.
4. Niaf E, Lartizien C, Bratan F, Roche L, Rabilloud M, Mège-Lechevallier F, Rouvière O. Prostate Focal Peripheral Zone Lesions: Characterization at Multiparametric MR Imaging—Influence of a Computer-aided Diagnosis System. Radiology 2014;271(3):761-769.
5. Isebaert S, Van den Bergh L, Haustermans K, Joniau S, Lerut E, De Wever L, De Keyzer F, Budiharto T, Slagmolen P, Van Poppel H, Oyen R. Multiparametric MRI for prostate cancer localization in correlation to whole-mount histopathology. J Magn Reson Imaging 2013;37(6):1392-1401.
Figures