4372
Differentiating prostate cancer from benign prostatic hyperplasia using multiparametric MRI1Department of Radiology, University of Chicago, Chicago, IL, United States, 2Department of Pathology, University of Chicago, Chicago, IL, United States, 3Sino-Dutch Biomedical and Information Engineering School, Northeastern University, Shenyang, China
Synopsis
This study investigates multiparametric MRI (mpMRI) appearance of different types of BPH and whether quantitative mpMRI is effective in differentiating between PCa and BPH in 60 patients. mpMRI and specifically quantitative ADC values can be used for differentiating PCa and BPH, improving PCa diagnosis in the transition zone. However, DCE-MRI metrics are not effective in distinguishing PCa and BPH. In contrast to previous understanding, glandular BPH has short T2 values (hypointense on T2-weighted images), demonstrates restricted diffusion, and may have similar quantitative mpMRI measurements to stromal BPH. Additionally, glandular and cystic BPH appear differently on mpMRI and are histologically different.
Introduction
While the majority of prostate cancers (PCa) occur in the peripheral zone, up to 30% may reside in the transition zone (TZ) (1). The TZ is also the site of benign prostatic hyperplasia (BPH), a non-cancerous, often nodular increase in prostatic glands and stroma which can result in urinary obstruction, and is a common condition in older men with a prevalence of pathological BPH in over 50% of men by the age of 60 years, and over 90% in men over 80 years (2). BPH can mimic PCa on multi-parametric MRI (mpMRI) (3) and there is a clear lack of understanding and uncertainty regarding the MR features of different BPH types and the utility of mpMRI for PCa diagnosis. This study investigates the mpMRI appearance of different types of BPH and whether quantitative mpMRI is effective in differentiating between PCa and BPH.Methods
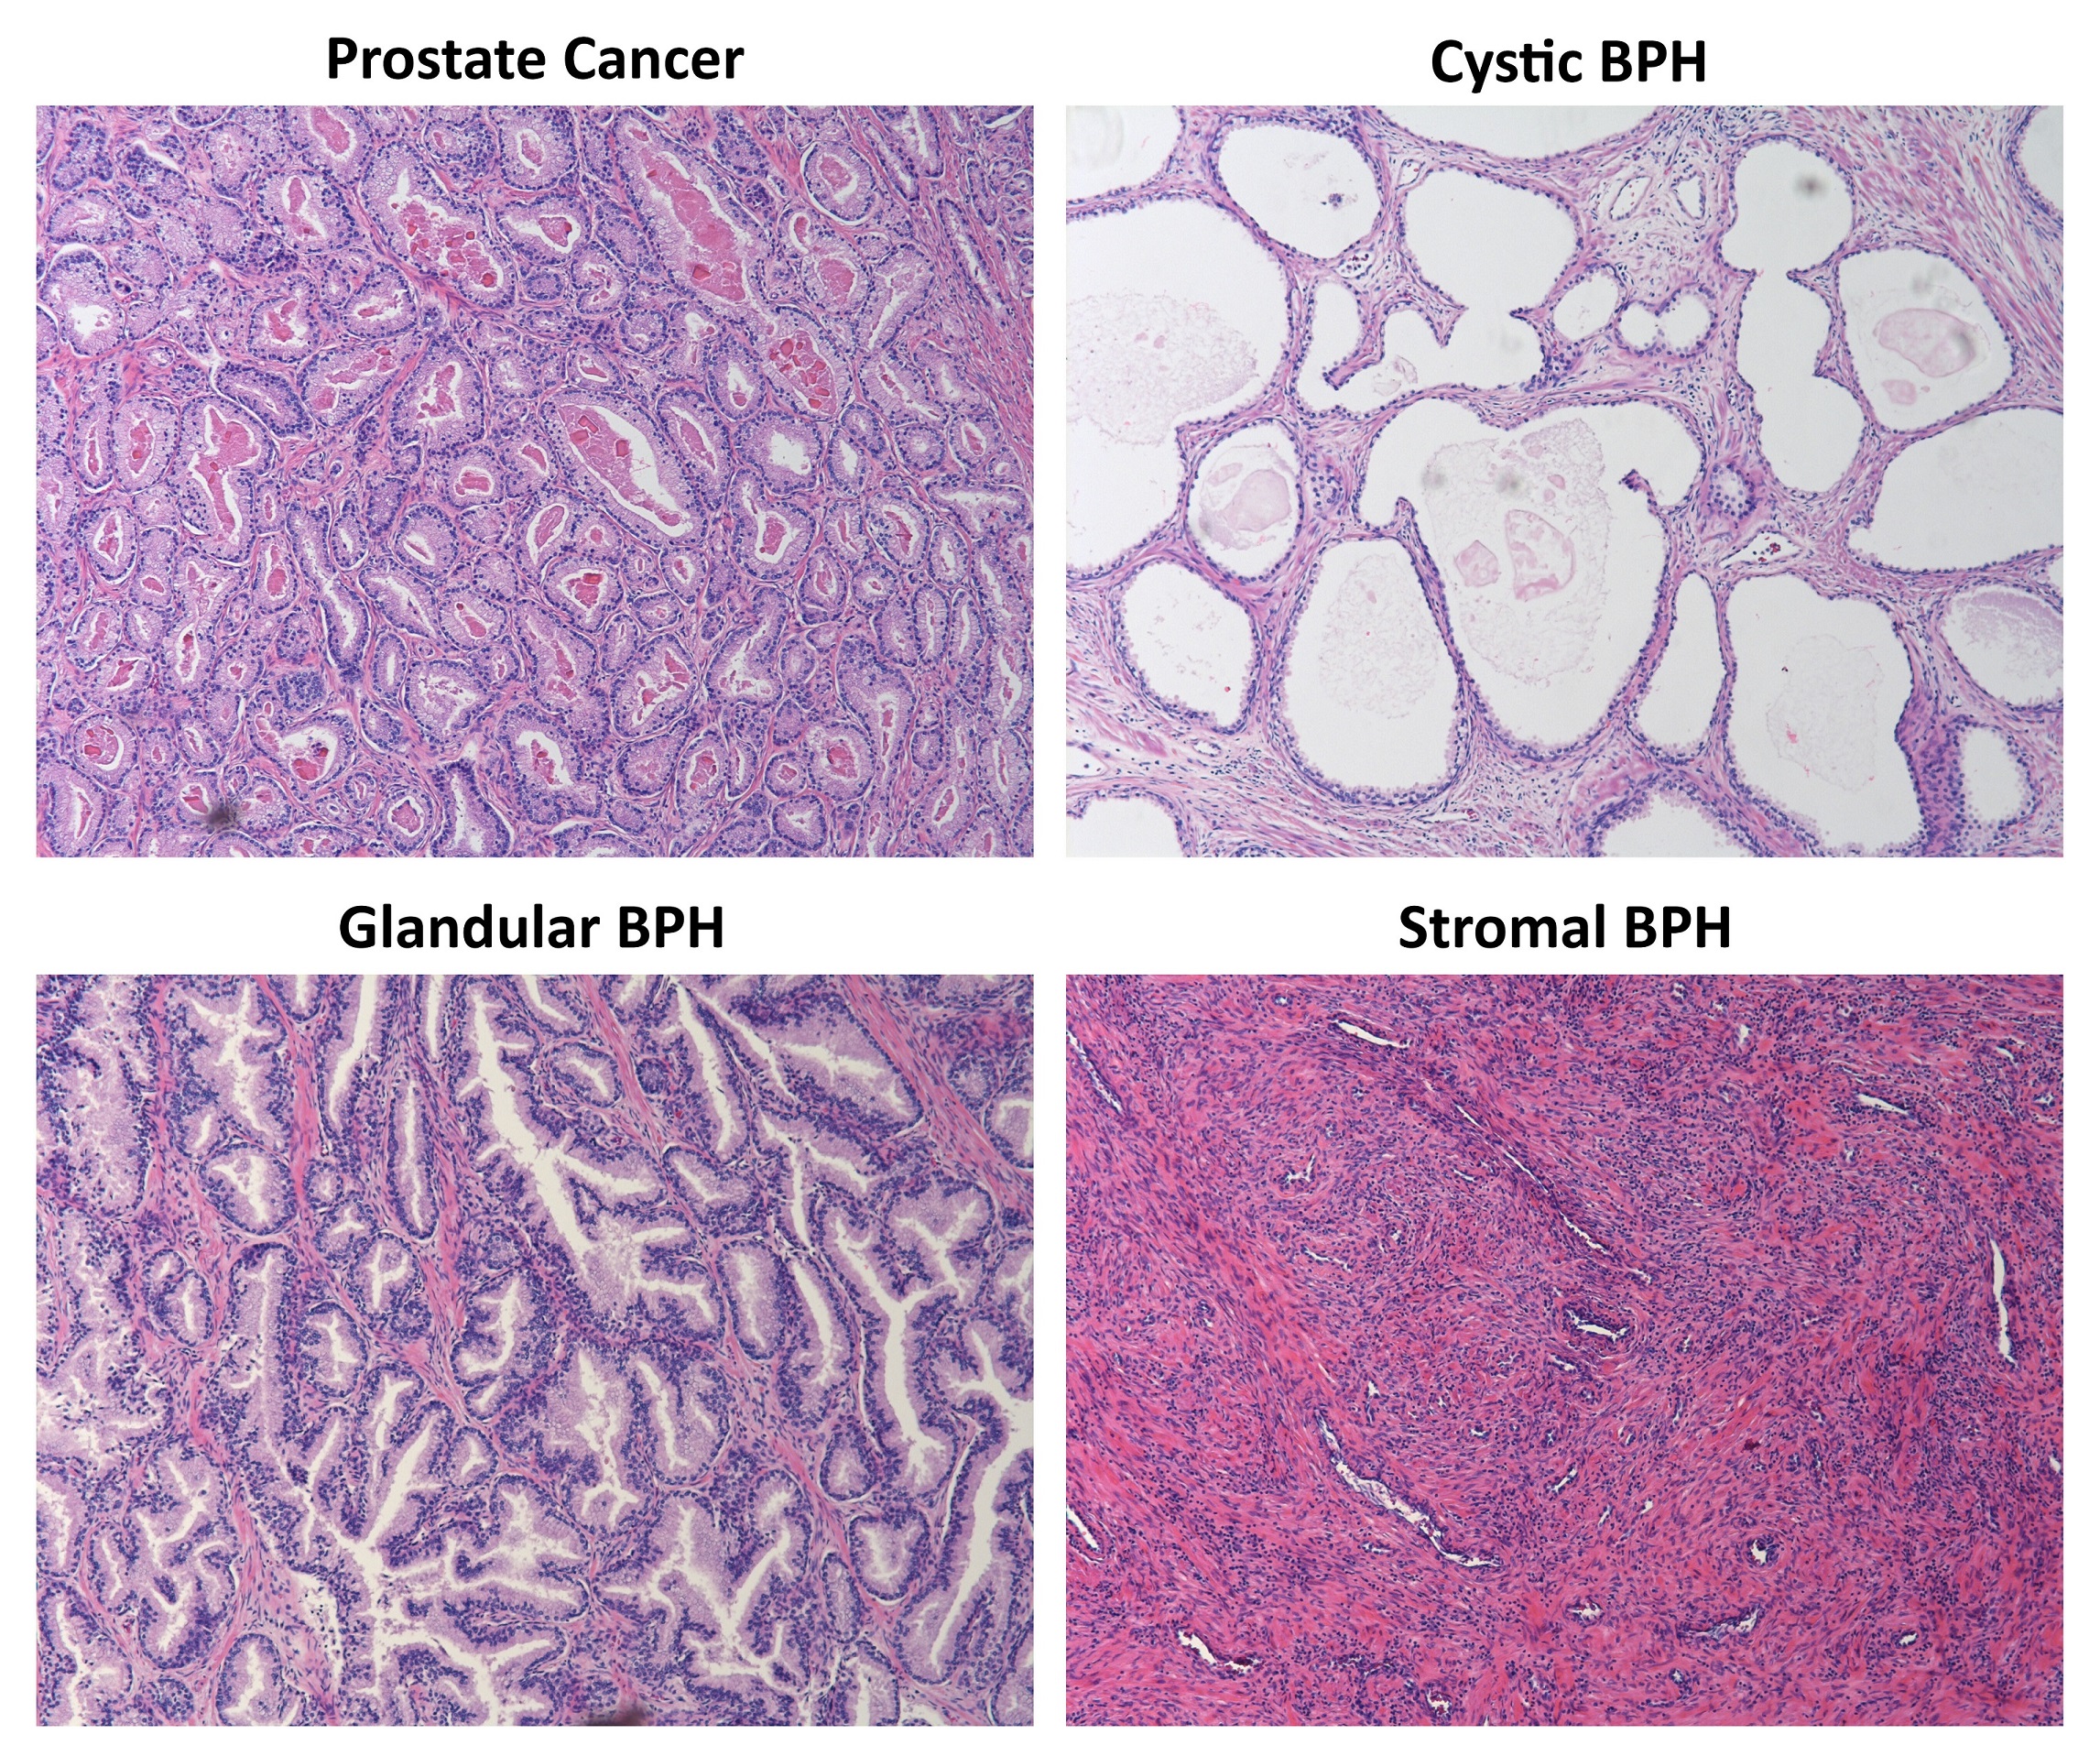
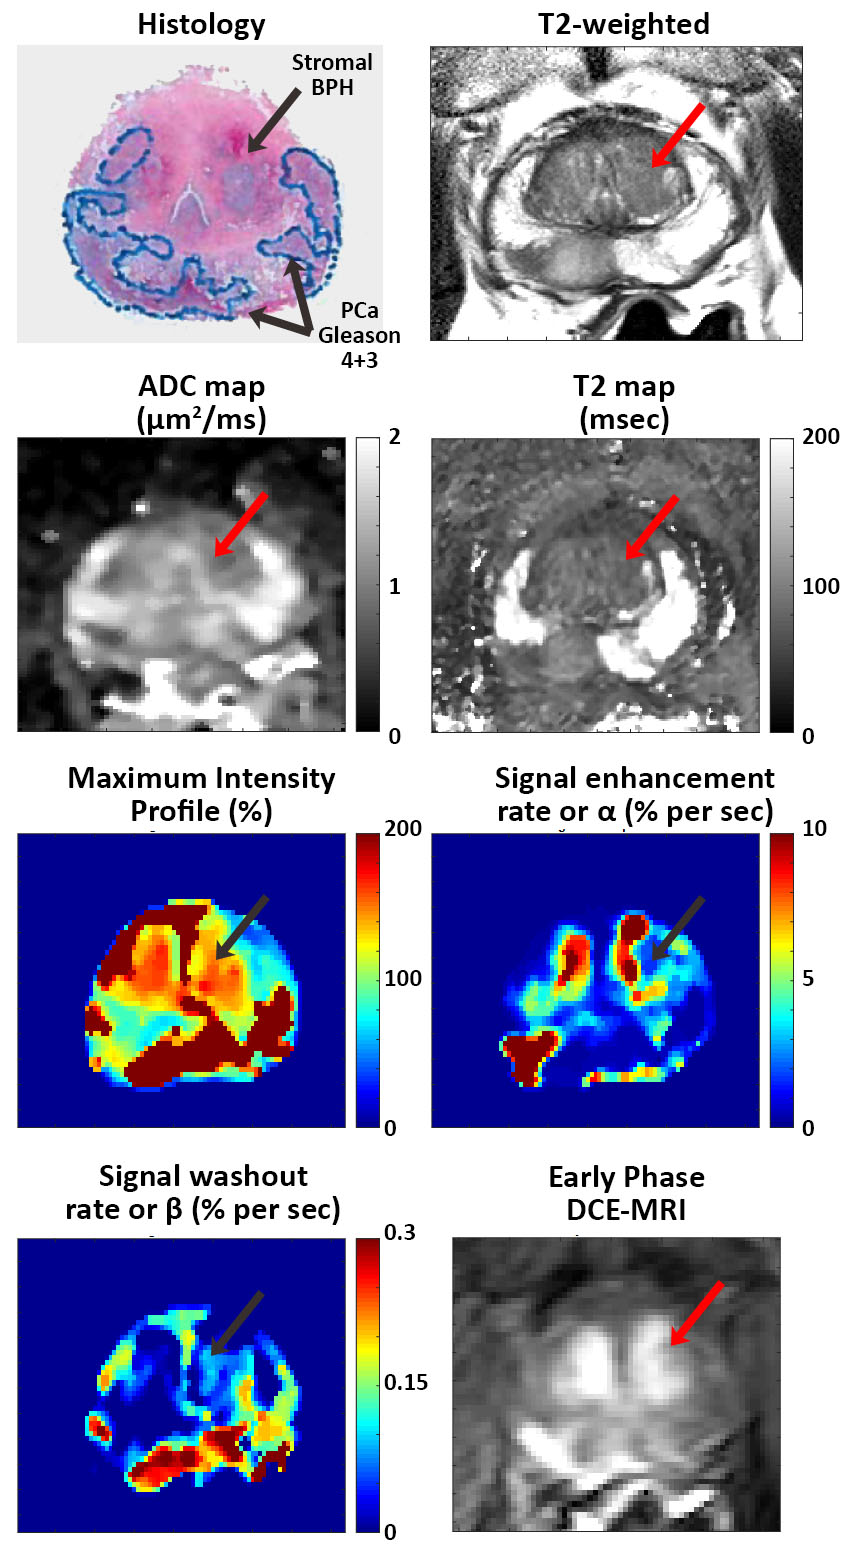
Patients (n=60) with confirmed PCa underwent preoperative 3T MRI in this prospective study with IRB approval and informed patient consent. T2-weighted, multi-echo T2-weighted, diffusion weighted and dynamic contrast enhanced images (DCE) were obtained prior to undergoing prostatectomy. PCa and BPH were identified in the transition zone and matched with MRI. BPH lesions were categorized as either predominantly cystic, glandular or stromal BPH (Figure 1). Cystic BPH have nodular, predominantly cystically dilated glands with low glandular density and minimal intervening stroma. Glandular BPH have nodular, glandular-predominant composition with gland-to-stroma ratio of 51-100%. Stromal BPH have nodular, stroma-predominant composition with gland-to-stroma ratio of 0-50%. Quantitative mpMRI metrics: T2, ADC and DCE-MRI parameters (signal enhancement rate - α, signal washout rate or β) using an empirical mathematical model (4) were measured. The difference between means of measured mpMRI parameters was assessed by ANOVA with post hoc Tukey’s HSD test. Receiver operating characteristic (ROC) analysis was used to evaluate the performance of the various mpMRI parameters in differentiating PCa from BPH.Results
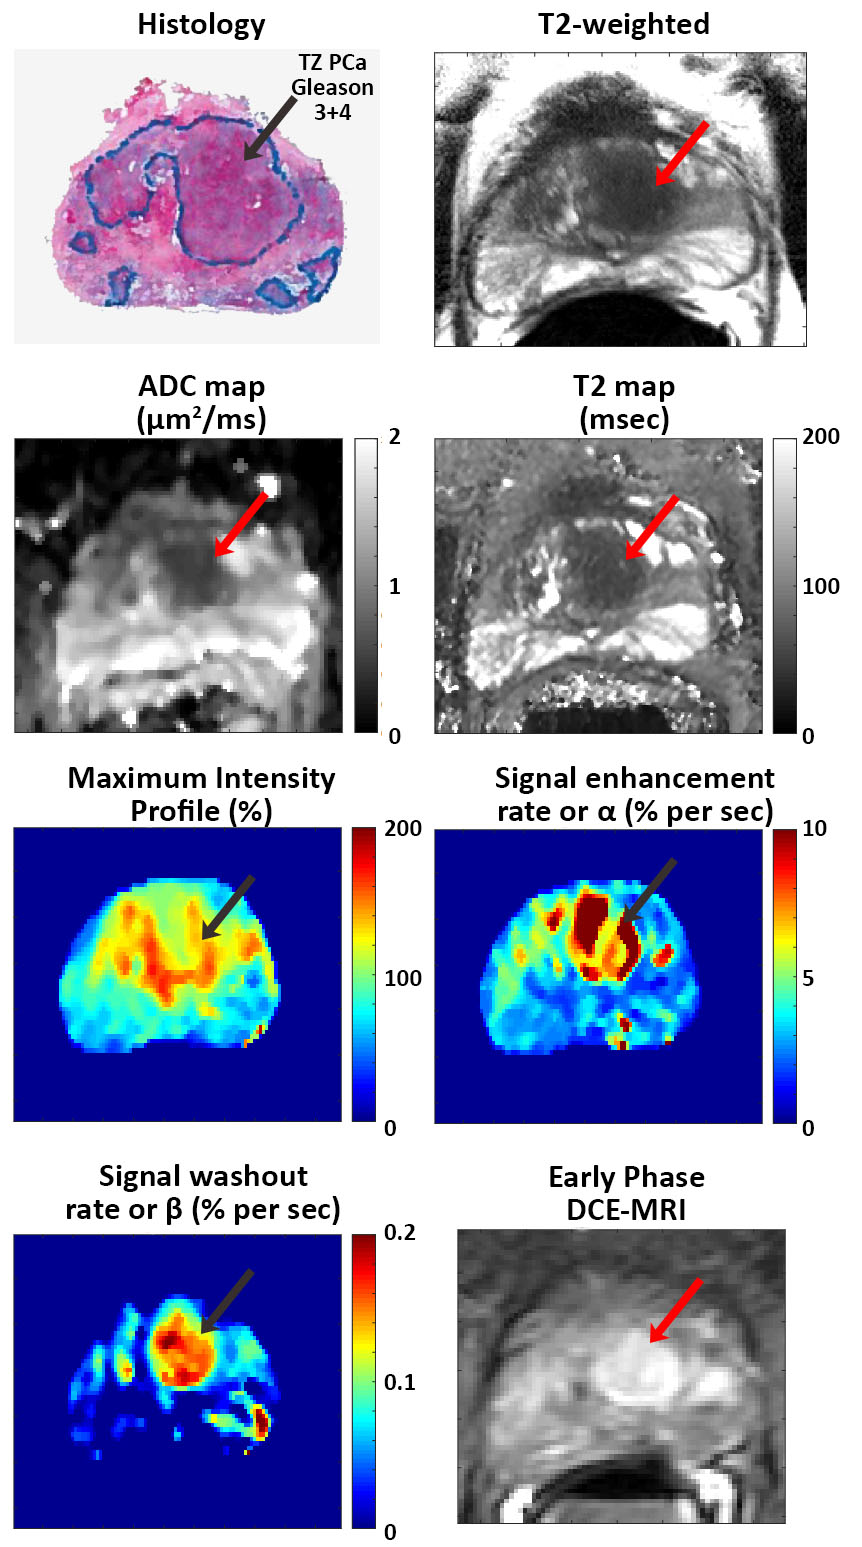
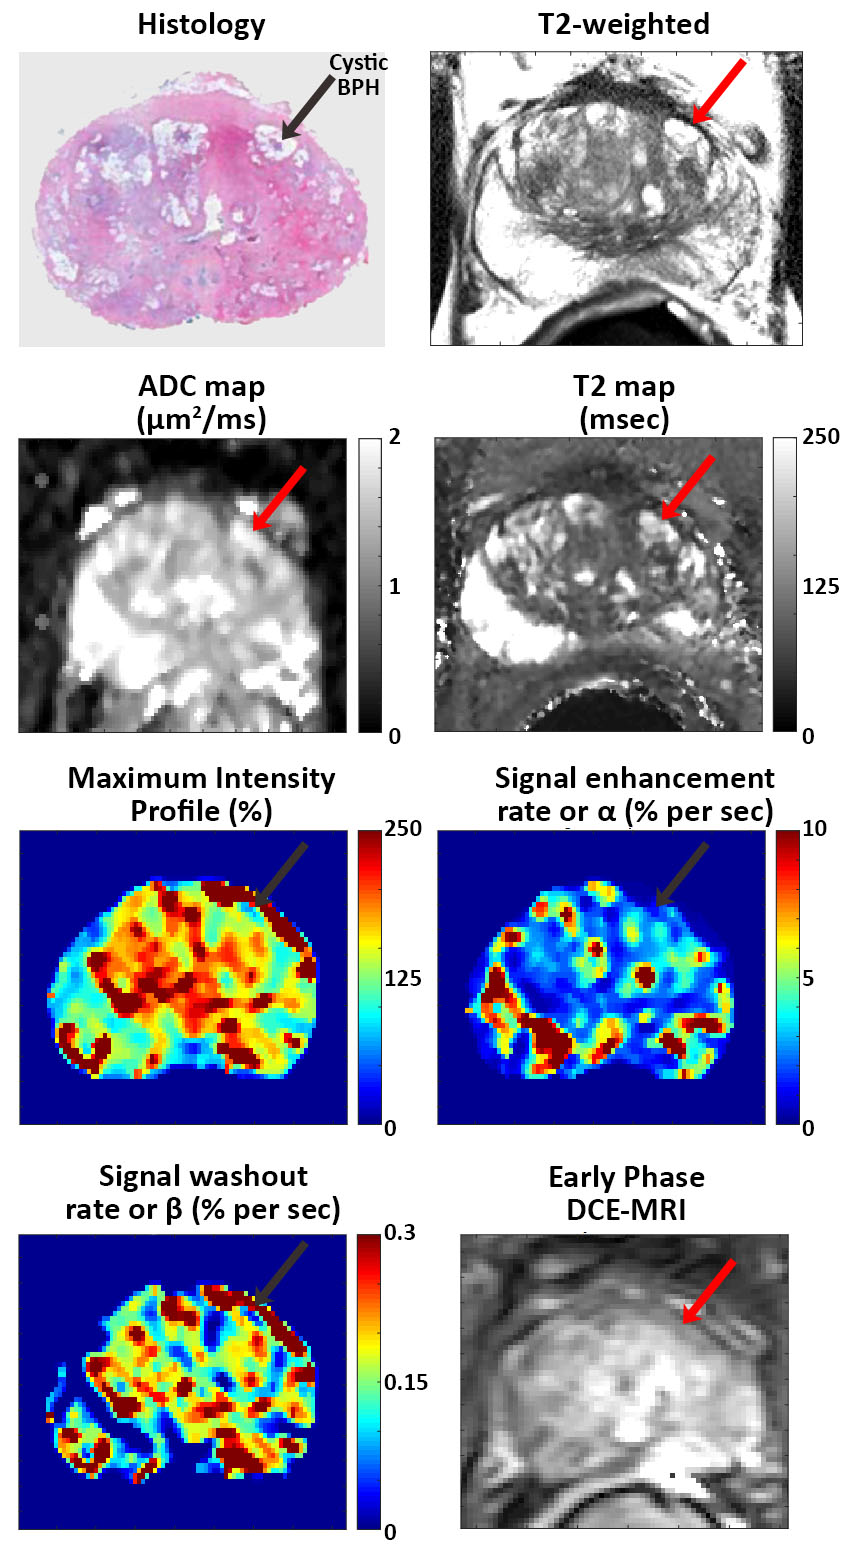
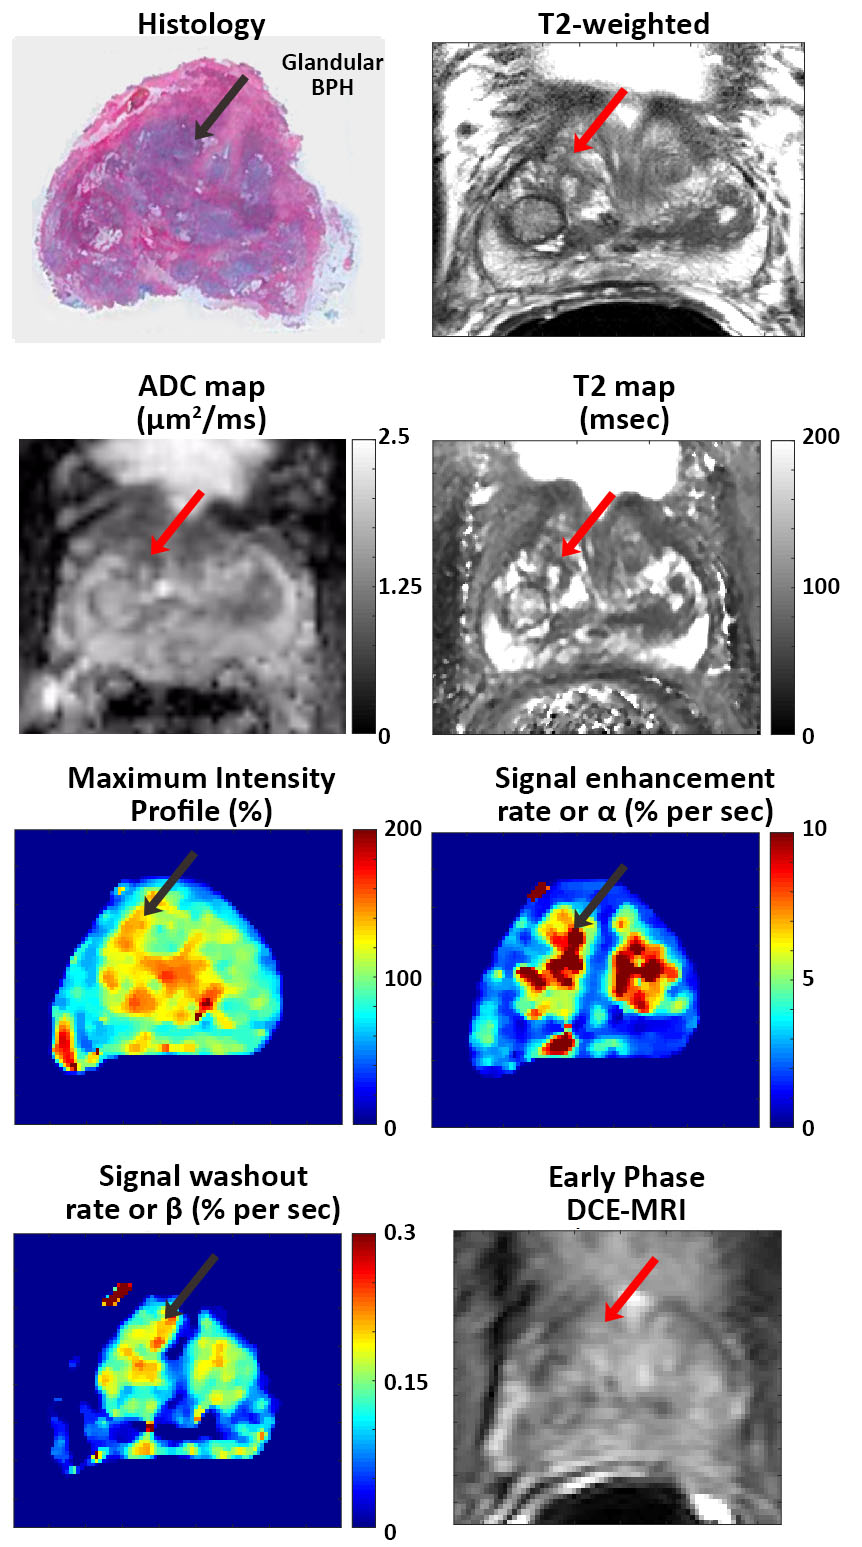
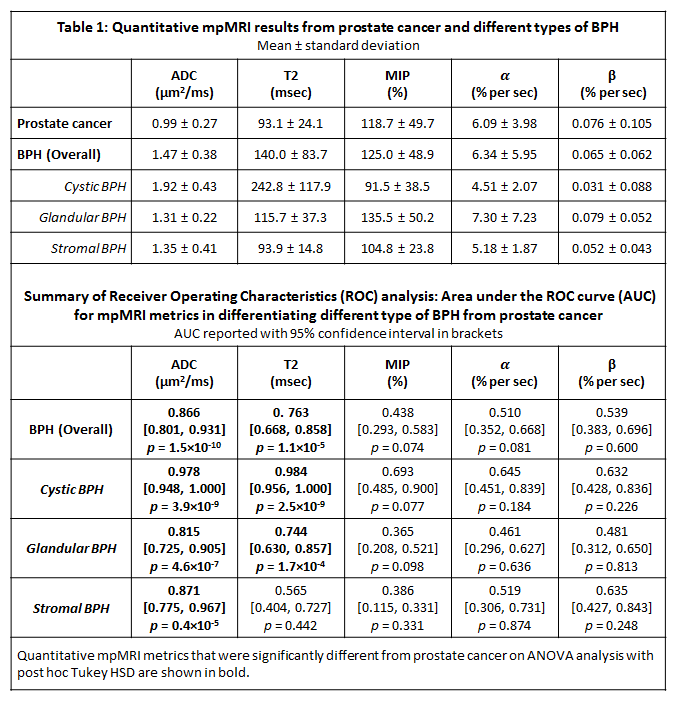
A total of 106 BPH nodules were identified in the 60 patients included in this study. They were categorized as either predominantly cystic BPH (n = 25), glandular BPH (n = 60) or stromal BPH (n = 21). In addition, a total of 34 prostate cancer lesions were identified in the transition zone, with 12 Gleason 3+3, 19 Gleason 3+4, 2 Gleason 4+3 and 1 Gleason 4+5. Representative images of TZ PCa and BPH types can be seen in Figures 2-5 respectively. ADC values were significantly lower (p=4.1×10⁻²²) in PCa compared to all BPH types and can differentiate between PCa and BPH with high accuracy (AUC=0.866, p=1.5×10⁻¹⁰). T2 values were significantly lower (p=4.7×10⁻¹³) in PCa compared to cystic BPH only, while glandular (p=0.271) and stromal BPH (p=0.999) showed no significant difference from PCa. There was no significant difference in ADC (p=0.723) and T2 (p=0.458) between glandular and stromal BPH. BPH mimics PCa in the transition zone on DCE-MRI evidenced by no significant difference between them, and therefore DCE-MRI metrics are not effective in distinguishing PCa and BPH.Discussion
The results from this study highlight the highly heterogeneous nature of the transition zone evidenced by the different histology and quantitative mpMRI parameters seen in different BPH histology types (Table 1). Previous literature considered cystic and glandular BPH to be similar (5). The results from this study show that glandular and cystic BPH appear differently on mpMRI and are histologically different. Cystic BPH are characterized by high ADC and T2 values, and glandular BPH have moderately higher ADC and T2 than PCa. Stromal BPH have moderately higher ADC but similar T2 values to PCa. Quantitative ADC values derived from diffusion weighted imaging remains the most effective parameter in differentiating BPH from PCa. These results are similar to a few previous studies (5). Quantitative T2 values are effective in the distinction of PCa from cystic and glandular BPH, however differentiating stromal BPH and PCa is problematic. Glandular BPH are not hyperintense on ADC and T2 as previously thought, and have similar quantitative mpMRI measurements to stromal BPH. BPH have similar quantitative mpMRI measures, especially DCE-MRI parameters and therefore mimic PCa.Conclusion
Multiparametric MRI and specifically quantitative ADC values can be used for differentiating PCa and BPH, improving PCa diagnosis in the transition zone. However, DCE-MRI metrics are not effective in distinguishing PCa and BPH. Glandular BPH are not hyperintense on ADC and T2 as previously thought, and have similar quantitative mpMRI measurements to stromal BPH. Glandular and cystic BPH appear differently on mpMRI and are histologically different.Acknowledgements
The study was funded by Philips Healthcare and National Institutes of Health (NIH R01 CA172801 and NIH 1S10OD018448-01).References
1. McNeal JE, Redwine EA, Freiha FS, Stamey TA. Zonal distribution of prostatic adenocarcinoma. Correlation with histologic pattern and direction of spread. The American journal of surgical pathology 1988;12(12):897-906.
2. Berry SJ, Coffey DS, Walsh PC, Ewing LL. The development of human benign prostatic hyperplasia with age. J Urol 1984;132(3):474-479.
3. Kitzing YX, Prando A, Varol C, Karczmar GS, Maclean F, Oto A. Benign Conditions That Mimic Prostate Carcinoma: MR Imaging Features with Histopathologic Correlation. RadioGraphics 2016;36(1):162-175.
4. Fan X, Medved M, River JN, Zamora M, Corot C, Robert P, Bourrinet P, Lipton M, Culp RM, Karczmar GS. New model for analysis of dynamic contrast-enhanced MRI data distinguishes metastatic from nonmetastatic transplanted rodent prostate tumors. Magnetic Resonance in Medicine 2004;51(3):487-494.
5. Oto A, Kayhan A, Jiang Y, Tretiakova M, Yang C, Antic T, Dahi F, Shalhav AL, Karczmar G, Stadler WM. Prostate Cancer: Differentiation of Central Gland Cancer from Benign Prostatic Hyperplasia by Using Diffusion-weighted and Dynamic Contrast-enhanced MR Imaging. Radiology 2010;257(3):715-723.
Figures