4368
MR texture analysis: potential imaging biomarker for prediction of chemotherapy response in patients with colorectal liver metastases1Department of Radiology, Fudan University Shanghai Cancer Center; Department of Oncology, Shanghai Medical College, Fudan University, Shanghai, China, 2Department of Medical Oncology, Fudan University Shanghai Cancer Center; Department of Oncology, Shanghai Medical College, Fudan University, Shanghai, China
Synopsis
The aim of this study was to determine if pre-treated MR texture features of colorectal liver metastases (CRLMs) are predictive of chemotherapy response after the first-line chemotherapy. The results indicate that MR texture features on pre-treated T2 images seem to be a promising tool for predicting the chemotherapy response of patients with colorectal liver metastases.
Background and Purpose
Recent studies proved to show that CT texture analysis was feasible and had certain practical value to assess the response of colorectal liver metastases (CRLMs) to chemotherapy, but there has been very little work regarding the role of MR texture features in CRLMs until now.1-5 Our study aimed to determine if pre-treated MR texture features of CRLMs are predictive of chemotherapy response after the first-line chemotherapy.Methods
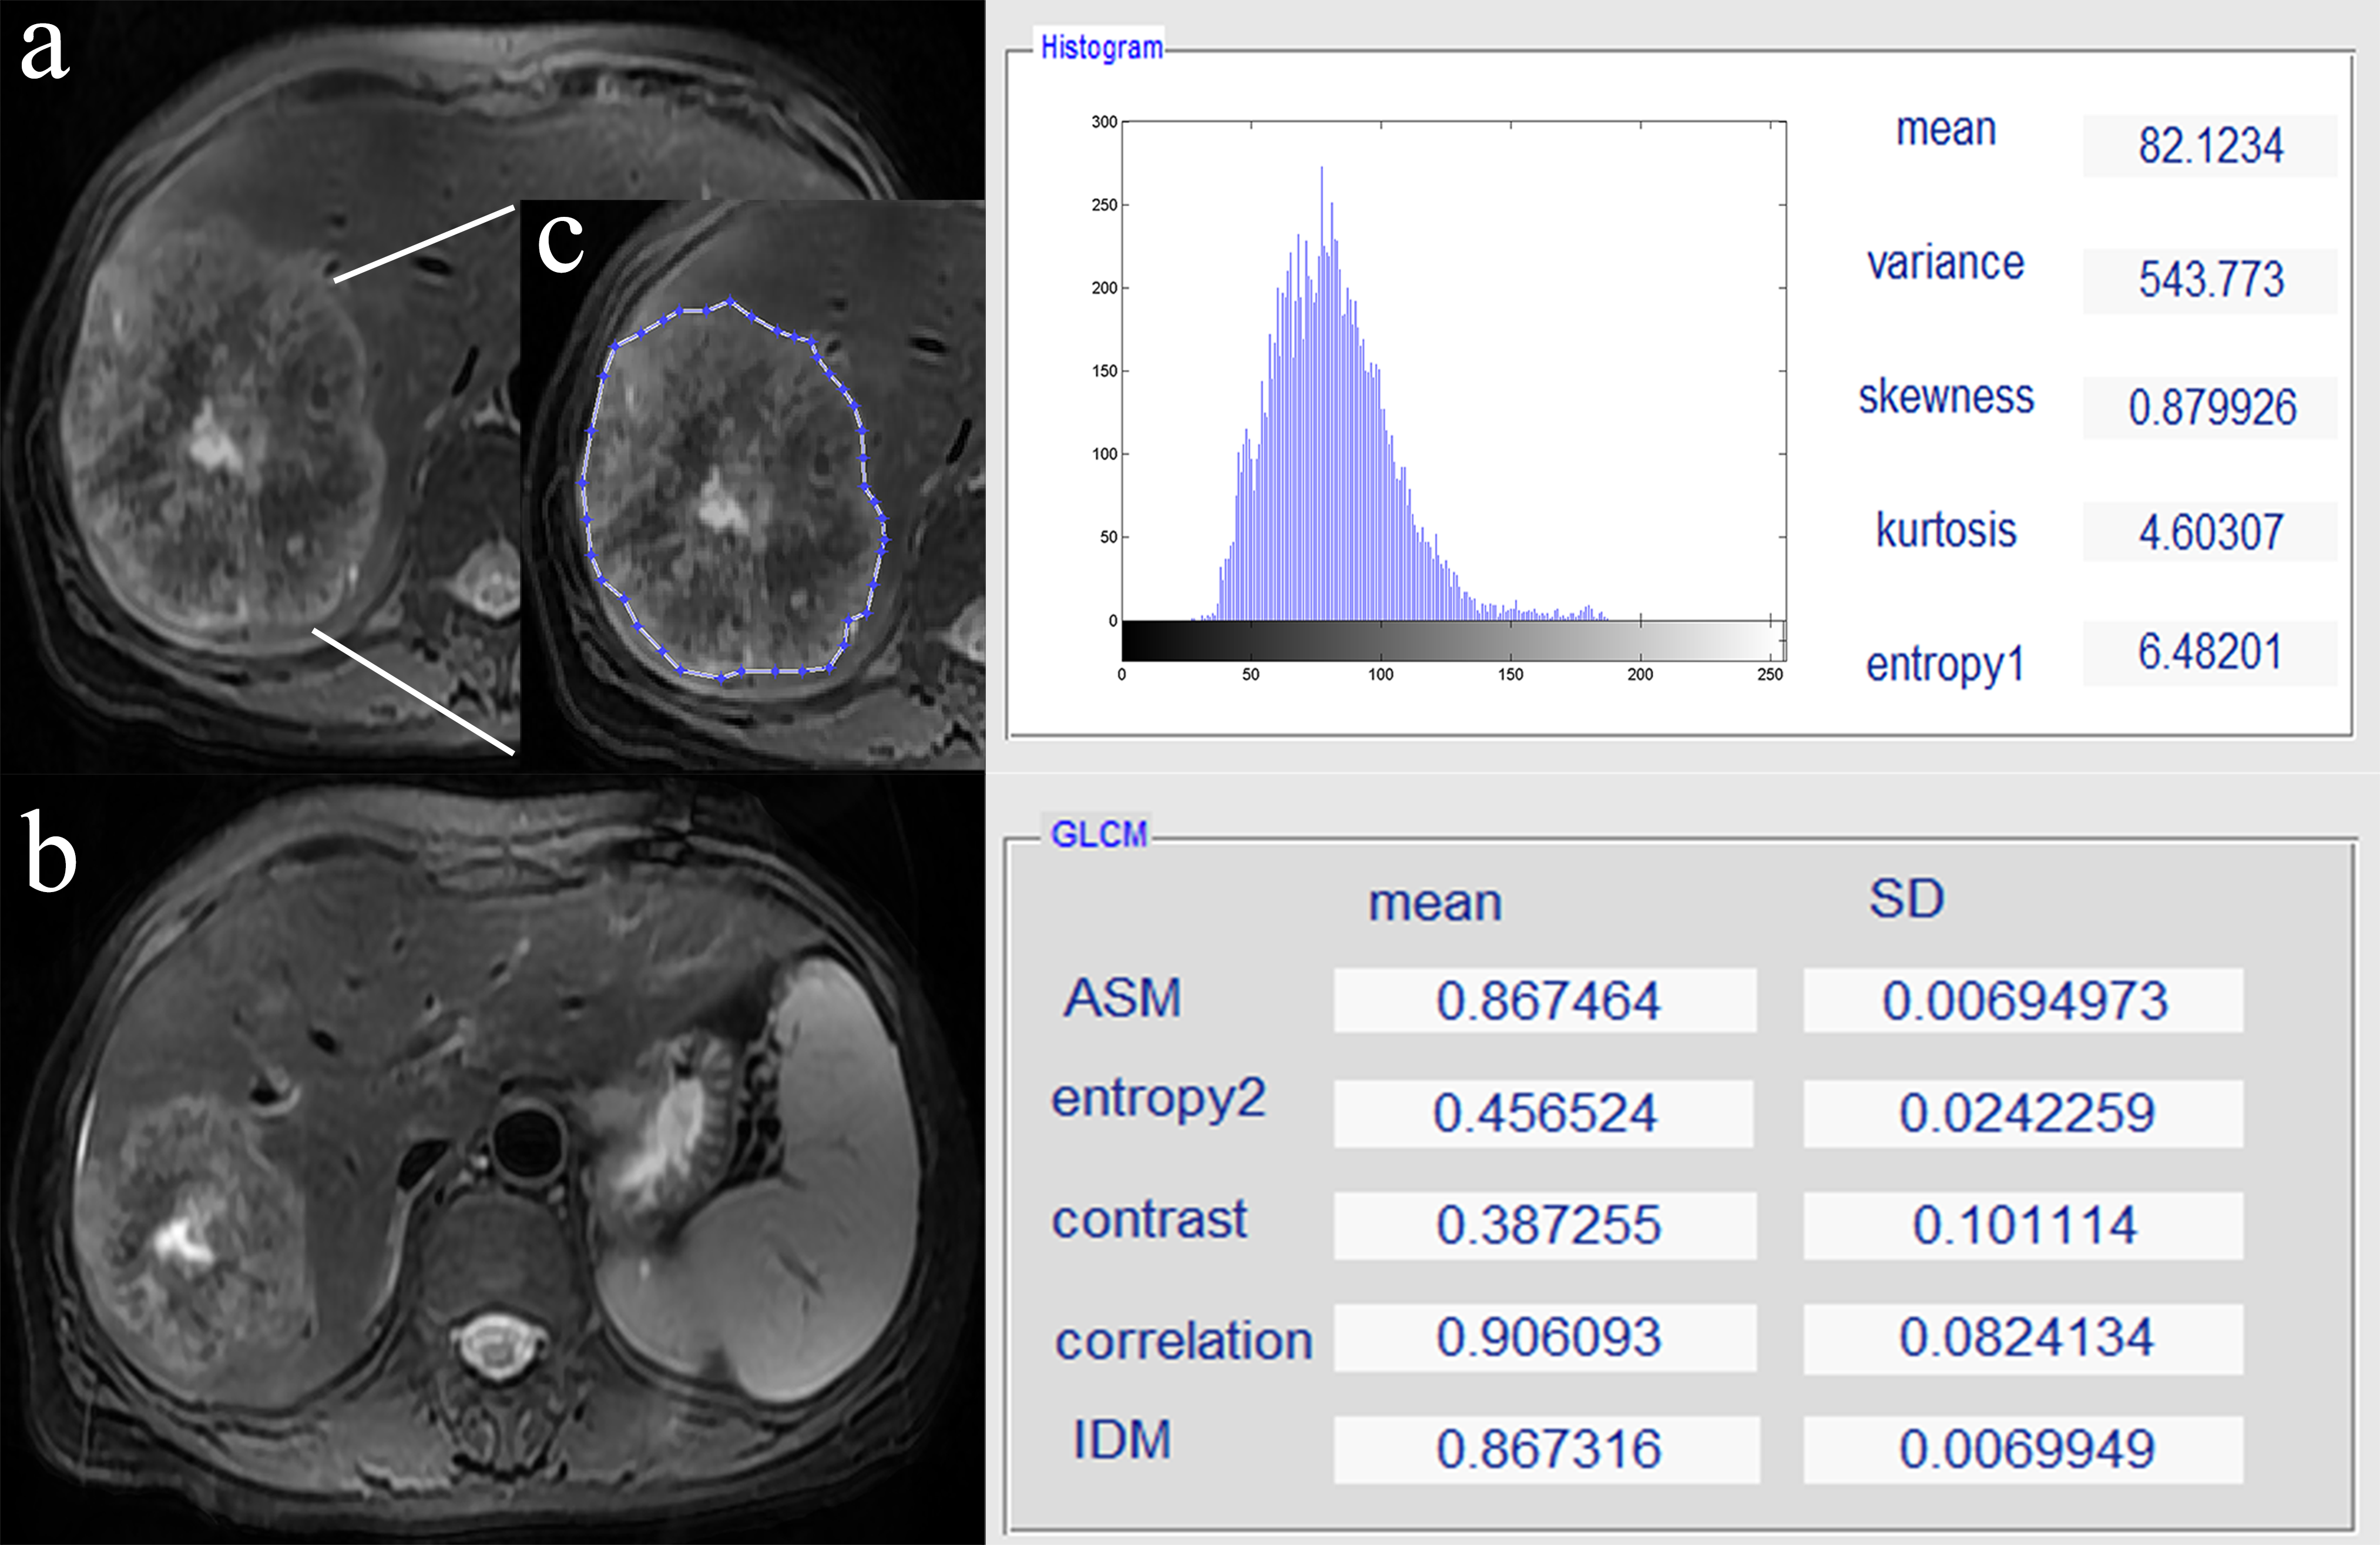
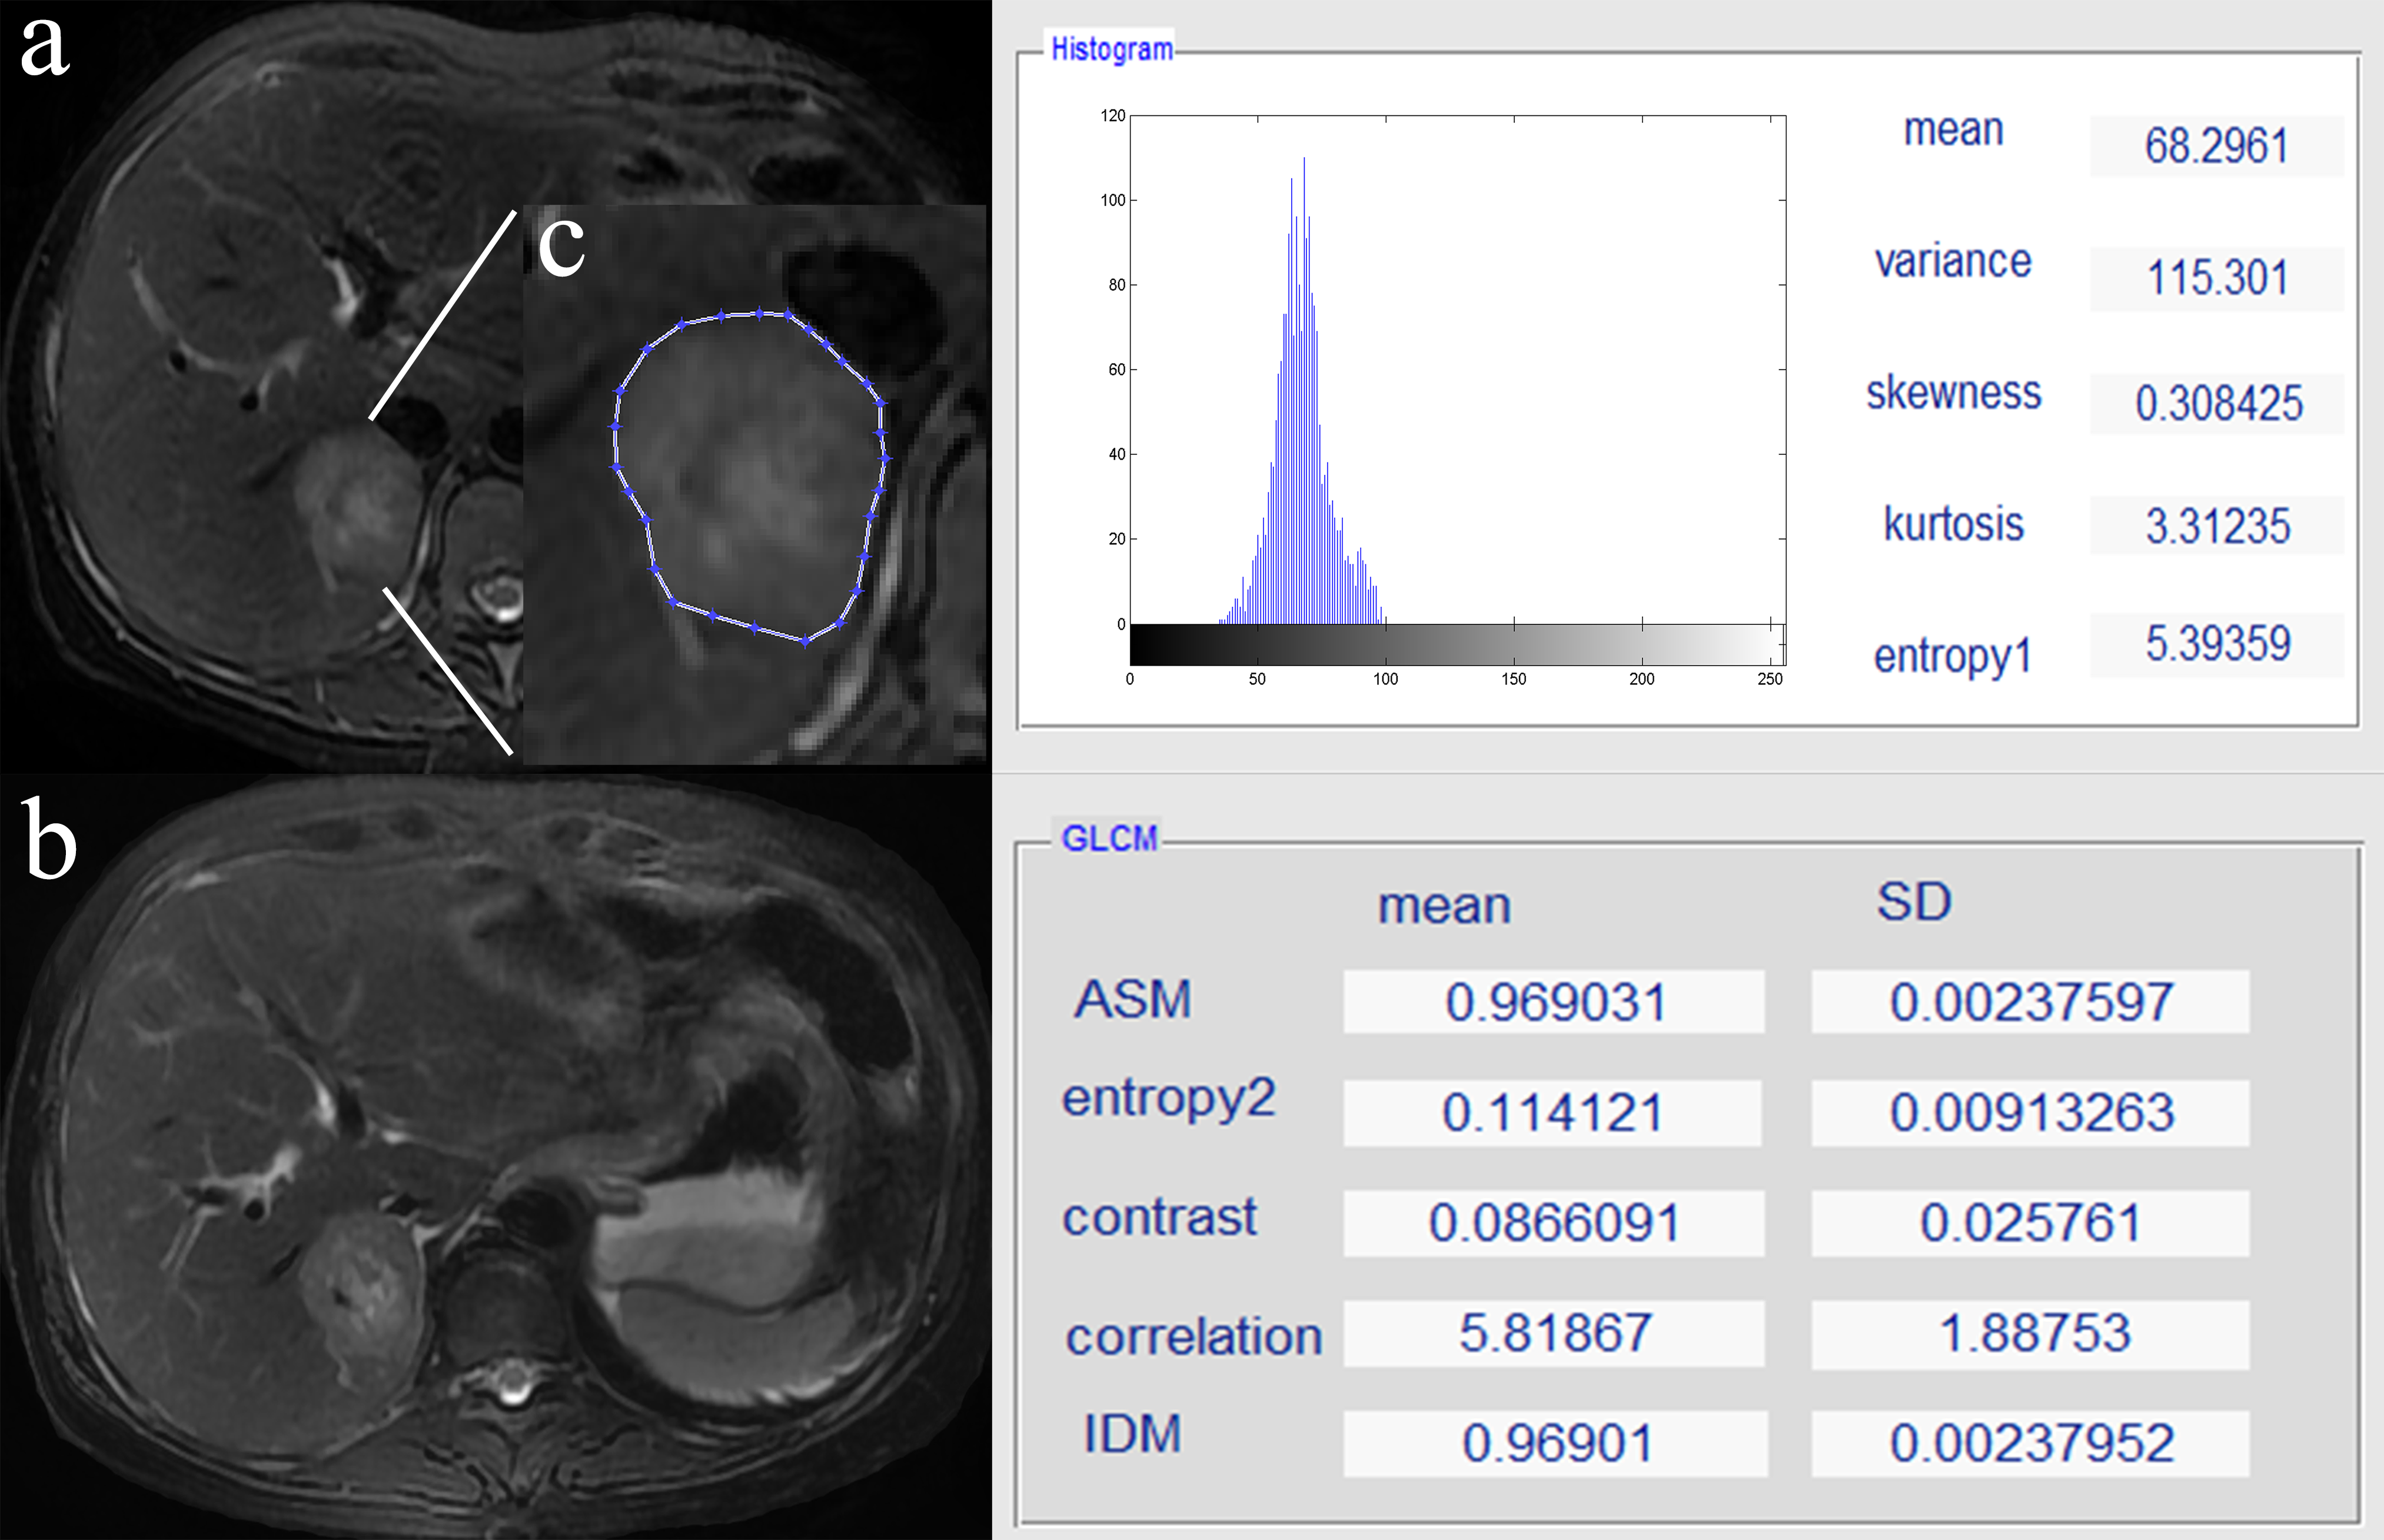
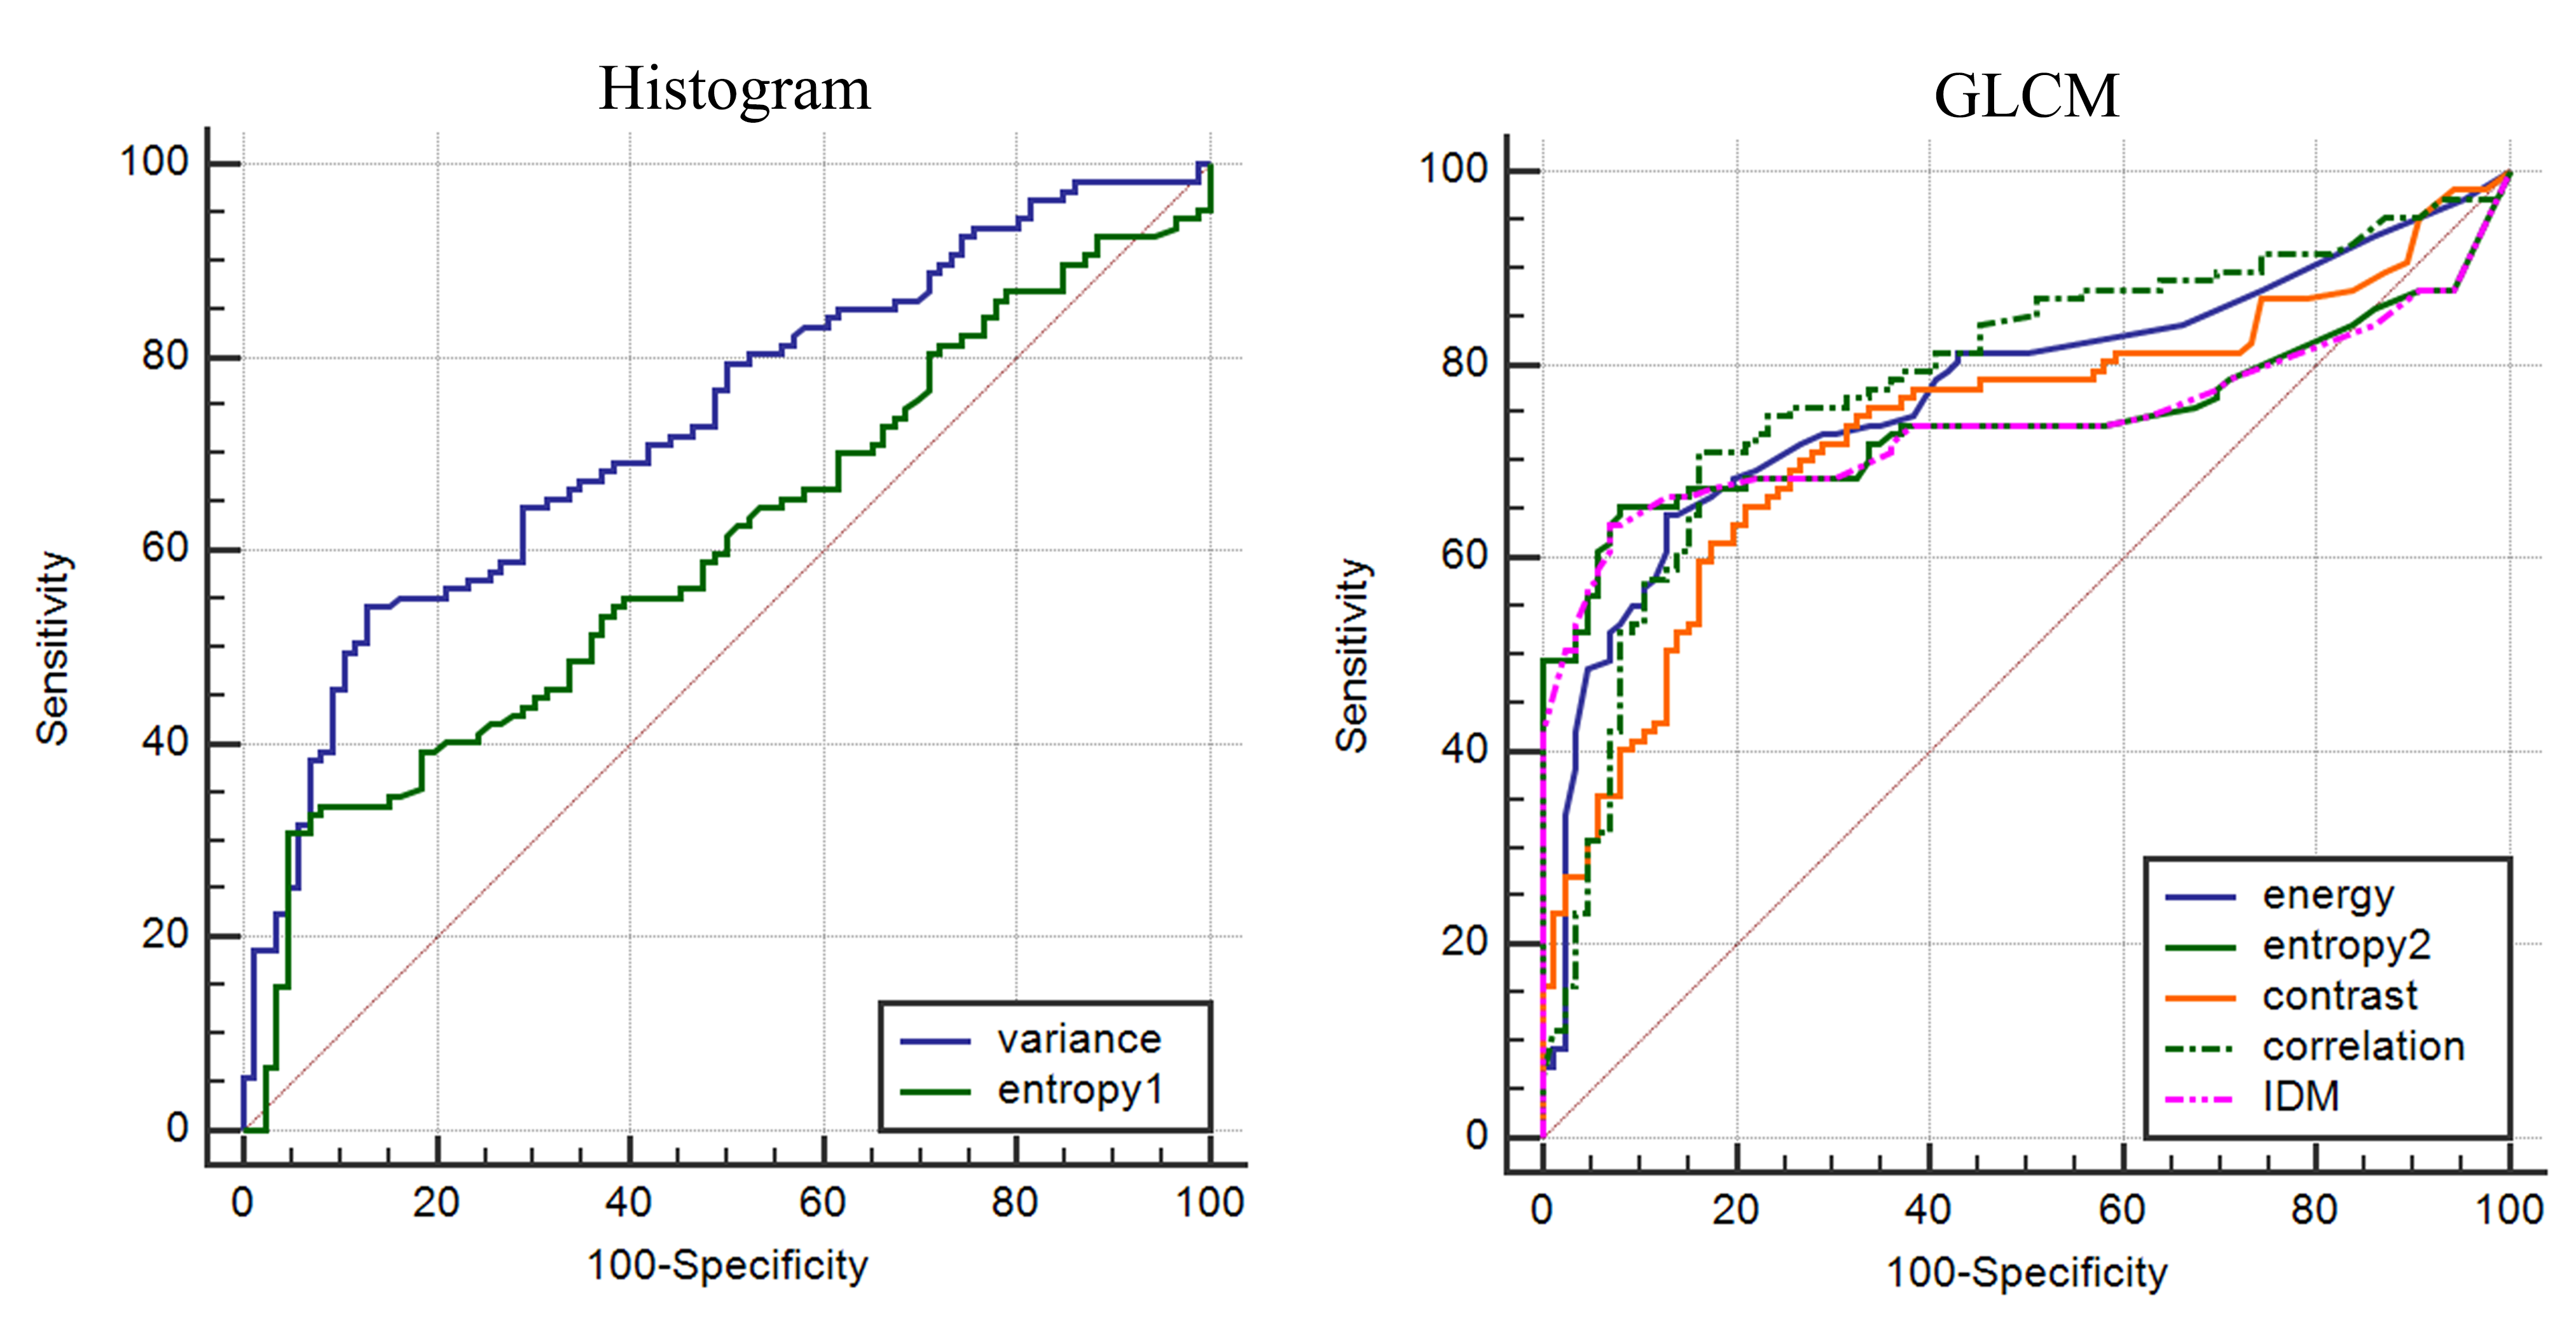
The study included twenty-six consecutive patients (a total of 193 liver metastasis) with unresectable CRLMs at our institution from August 2014 to February 2016. All MR images were performed within 3 weeks before treatment on a 3.0 T MR magnet (Signa Horizon, GE Medical Systems, Milwaukee, WI). The axial T2- weighted images were acquired with a fast spin echo sequence with the following parameters: TR/TE = 6315.8/86.5ms, FOV = 380×380 mm2, slice thickness = 7 mm, Matrix = 320×192, Intersection gap = 2 mm.Texture analysis was quantified on T2-weighted images using a dedicated script written in MATLAB (Matlab R2011b, The Mathworks, Inc., Natick, MA, USA) by two radiologists with an agreement on regions of interest which were manually drawn on the largest cross-sectional area of the lesions. Five histogram features (mean, variance, skewness, kurtosis, entropy1) and five gray level co-occurrence matrix features (GLCM; angular second moment (ASM), entropy2, contrast, correlation, inverse difference moment (IDM)) were extracted. Chemotherapy response was determined by evaluating changes in tumor size on a lesion-by-lesion basis: 6 responding group (≥30% reduction in the maximum transverse diameter) and non-responding group (<30% reduction in the maximum transverse diameter). The texture parameters were analyzed statistically to find the differences between the two groups and receiver operating characteristic curves were depicted to characterize each parameter value for evaluating treatment outcome.Results
107 responding and 86 non-responding lesions were evaluated. Higher variance, entropy1, contrast, entropy2 (p <0.001, =0.008, <0.001, <0.001, respectively ) and lower ASM, correlation, IDM (p <0.001, =0.001, <0.001, respectively )were independently associated with good response to chemotherapy with area under the ROC curve of 0.602-0.784. However, mean (P=0.186), skewness (P=0.311) and kurtosis (P=0.763) did not show a significant difference.Discussion and Conclusion
Our results suggest that pre-therapeutic MR texture features may have an additional potential role in predicting the chemotherapy response of colorectal liver metastases. However, larger scale and prospective studies are needed to establish the clinical application.Acknowledgements
This study was supported by the National Natural Science Foundation of China (Grant No. 81501437).References
1. Miles KA, Ganeshan B, Griffiths MR, et al. Colorectal cancer: texture analysis of portal phase hepatic CT images as a potential marker of survival. Radiology 2009, 250 (2) :444-52.
2. Lubner MG, Stabo N, Lubner SJ, et al. CT textural analysis of hepatic metastatic colorectal cancer: pre-treatment tumor heterogeneity correlates with pathology and clinical outcomes. Abdom Imaging 2015; 40(7):2331-7.
3. Rao S-X, Lambregts DM, Schnerr RS, et al. CT texture analysis in colorectal liver metastases: A better way than size and volume measurements to assess response to chemotherapy? United Eur Gastroenterol J 2016; 4(2):257-63.
4. Ahn SJ, Kim JH, Park SJ, et al. Prediction of the therapeutic response after FOLFOX and FOLFIRI treatment for patients with liver metastasis from colorectal cancer using computerized CT texture analysis. Eur J Radiol 2016; 85(10):1867-1874.
5. Liang HY, Huang YQ, Yang ZX, et al. Potential of MR histogram analyses for prediction of response to chemotherapy in patients with colorectal hepatic metastases. Eur Radiol 2016; 26(7):2009-18.
Figures