4366
Texture Analysis in Magnetic Resonance Fingerprinting of the Prostate: Utility for Differentiation of Grade, and Cancer from Non-cancerous tissue.1School of Medicine, Case Western Reserve University, Cleveland, OH, United States, 2Radiology, Case Western Reserve University, Cleveland, OH, United States, 3Johns Hopkins University, Baltimore, MD, United States, 4Radiology, UH Cleveland Medical Center, Cleveland, OH, United States, 5BME, Case Western Reserve University, Cleveland, OH, United States
Synopsis
Prostate cancer and prostatitis can have considerable overlap on conventional MR imaging. Texture analysis on multiparametric MRI shows promise in characterization of prostate, but has not been used on quantitative prostate maps. Here we utilize texture analysis on magnetic resonance fingerprinting (MRF) maps of prostate for characterization of prostate lesions. Results show that texture features can differentiate cancer and non-cancerous transition zone and between grades of cancer in peripheral zone. This could add value to MRF-based relaxometry and conventional MRI to improve lesion characterization.
Introduction
Previous literature describes patterns of pixel attributes, or “texture analysis,” to identify prostate cancer on qualitative T1-weighted and T2-weighted magnetic resonance images, and on ADC maps1-3. Second-order statistical features, or “texture features” characterize pairs of pixels in an image, providing statistical information undetectable to the naked eye. To date, texture analysis has not been used on prostate tissue relaxometry maps. Here we apply this to Magnetic Resonance Fingerprinting (MRF) T1 and T2 relaxation times4. Previous MRF analysis of prostate has shown that the combination of T1, T2 and ADC values can differentiate between normal peripheral zone (PZ) and PZ prostate cancer and between different Gleason grades (GS)5. However, some residual overlap was still present, in particular between prostatitis and cancer. The purpose of this work is to apply texture analysis to improve upon quantitative MRF prostate data and further characterize prostatic pathologies.Methods
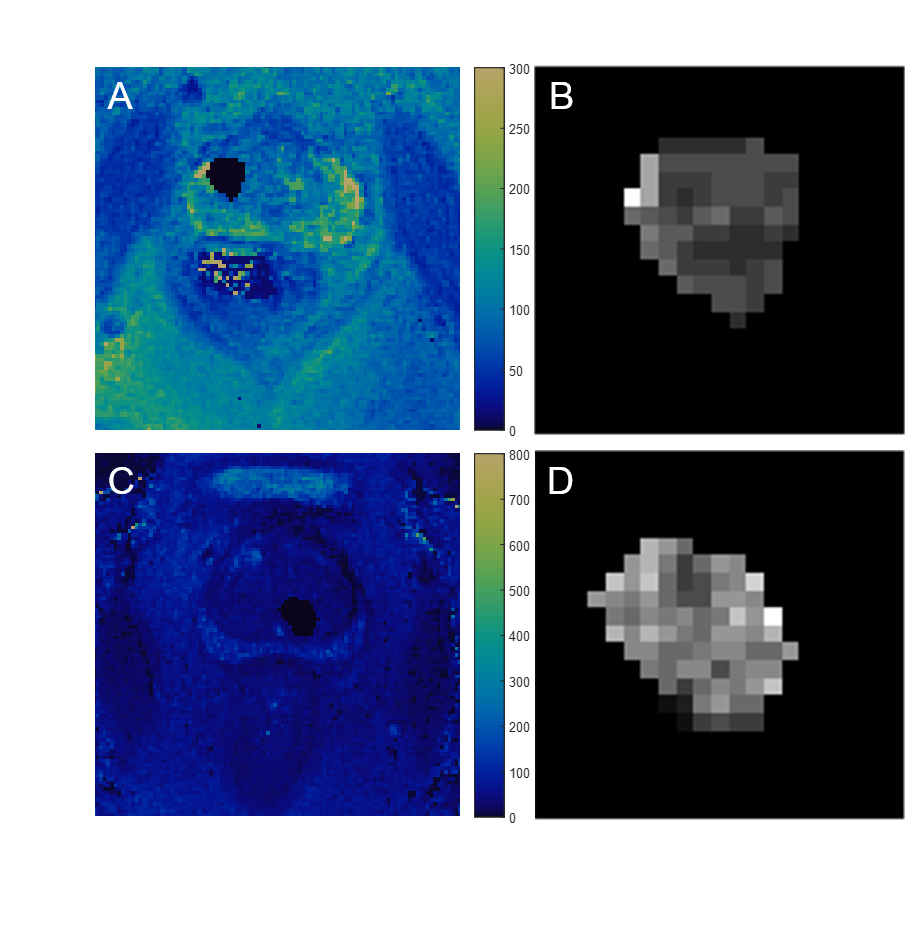
In this IRB and HIPPA compliant study, 74 patients with clinical suspicion of prostate cancer underwent MRI (High resolution T2 w, diffusion weighted imaging using echo planar imaging with b-values 50-1400 s/mm2) and MRF-FISP acquisition as previously described5 (resolution 1 x 1 x 5 mm3) on a 3T scanner. Regions of Interest (ROIs) (mean size 66.3 mm2, 6-445 mm2) were drawn on MRF maps in both cancer suspicious regions and normal tissue by a radiologist (7 years’ experience) based on clinical MRI reads by another radiologist (16 years experience) using a MATLAB-based GUI (Fig. 1). 58 patients with 65 PZ lesions and 24 patients with 24 transition zone (TZ) lesions underwent targeted biopsy based on MRI findings. 26 second order texture features were calculated in MATLAB for each ROI using Haralick texture features6 derived from Gray Level Co-occurrence Matrices (GLCM) and Gray Level Run Length Matrices (GLRLM). Spearman rank correlation coefficients were used to remove redundant texture features. The remaining features were correlated with the gold standard pathologic diagnosis. Student’s t-tests were performed on texture features between different diagnoses (GS 6-9 cancer and prostatitis) to characterize the lesions. Bonferroni correction was applied to correct for multiple comparisons. For significant texture features, logistic regression models were created to calculate Receiver Operating Characteristic (ROC) curves, and Area Under the Curve’s (AUC) were calculated.Results
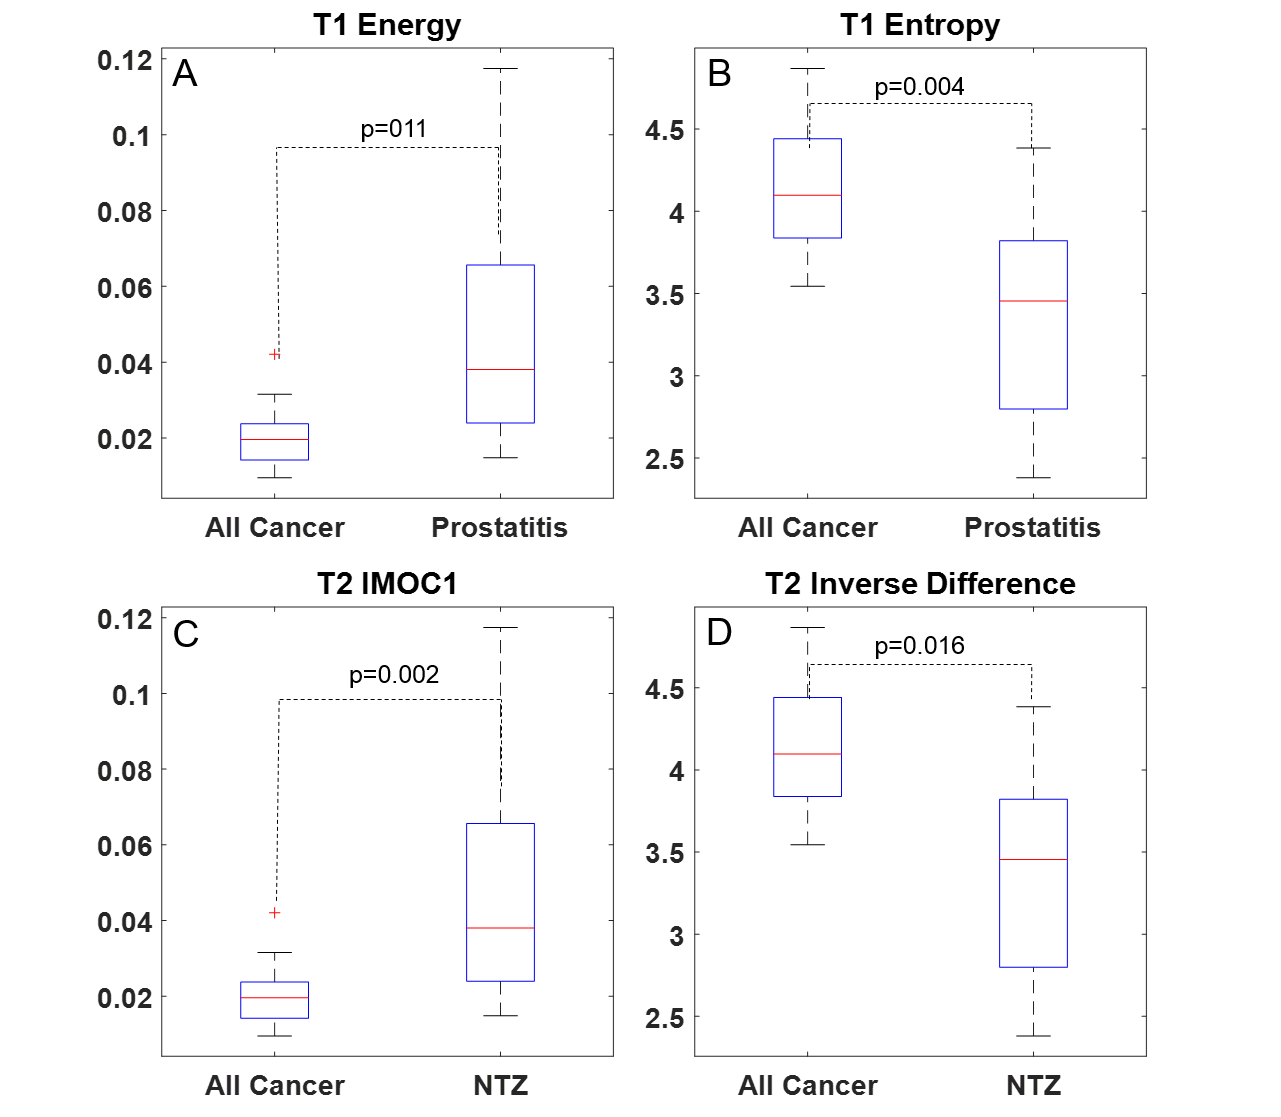
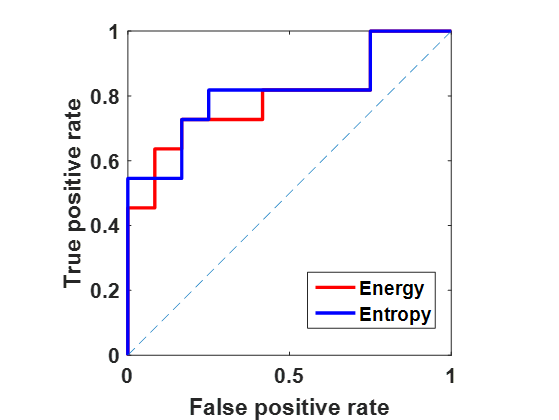
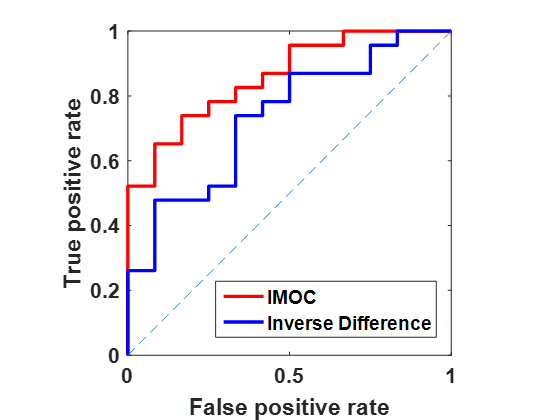
Pathologic diagnosis for lesion ROIs were: GS 6 / low grade cancer (PZ:n=8;TZ:n=3), GS 7/ intermediate grade cancer (PZ:n=33;TZ:n=9), GS ≥8 / high grade cancer (PZ:n=11) and prostatitis (PZ:n=13;TZ:n=12). Spearman Correlation Coefficients were calculated, resulting in the removal of 8 texture features (18 remaining). Results for texture analysis in PZ and TZ are presented in Table 1. After Bonferroni corrections, T2 cluster shade was significantly different between intermediate and high grade cancer for PZ lesions (p=0.01;AUC=0.67). For transition zone, T1 energy and entropy were significantly different between cancer and prostatitis (p=0.011,p=0.004;AUC=0.80,AUC=0.81 respectively) (Fig. 2, 3). T2 informational measure of correlation 1 (IMC1) and inverse difference were significantly different between normal TZ and cancer (p=0.002,p=0.016;AUC=0.86,AUC=0.74 respectively) (Fig. 2, 4). T1 energy and entropy and T2 IMC1 and inverse difference were significantly different between TZ cancer and non-cancer tissue (combined normal TZ and prostatitis) (p=0.039,p=0.020,p=0.003,p=0.048; AUC=0.72,AUC=0.71,AUC=0.83,AUC=0.68 respectively).Discussion
This work shows application of texture analysis to MRF maps. As texture features are calculated based on local voxel intensity relationships, they can reflect local spatial variation patterns in pathologic tissue versus normal tissue and improve tissue characterization. In this work, MRF- based texture analysis could provide additional separation of intermediate and high grade cancers in PZ compared to MRF relaxometry alone5. In TZ, multiple texture features showed significance, similar to the results reported by previous studies done on qualitative T-2 w images1-3. However using MRF, we also obtained additional T1 texture features for differentiation. Some of these second order statistical features have straightforward correlates, e.g. entropy measures pairwise pixel randomness similar to heterogeneity, and IMC1 is a function of entropy, while others lack a visible correlate. Clinically, TZ cancers are known to appear more homogenous than TZ non-cancerous tissue. Texture changes may indicate inherent tissue differences between lesion and non-lesion tissue. Texture analysis using MRF maps can potentially be combined with radiomics and pathonomics to improve lesion detection and characterization. One limitation of this study is that we used targeted biopsy ROIs for texture analysis, whereas whole mount prostatectomy specimens can give a more accurate correlation of texture features with pathology.Conclusion
This work shows the feasibility and utility of applying texture analysis methods directly to quantitative MRF maps in differentiating grades of cancer in peripheral zone and normal tissue versus cancers in transitional zone of prostate.Acknowledgements
This work was made possible with support from NIH grants 1R01EB016728, 1R01BB017219, 1R01DK098503, 1R01CA208236, as well as Siemens Healthineers.References
1. Bates, A. & Miles, K. Prostate-specific membrane antigen PET/MRI validation of MR textural analysis for detection of transition zone prostate cancer. European Radiology, 2017;Epub.
2. Khalvati, F. et al., Automated prostate cancer detection via comprehensive multi-parametric magnetic resonance imaging texture feature models. BMC Medical Imaging 2015;15:27.
3. Nketiah, G., et al. T2-weighted MRI-derived textural features reflect prostate cancer aggressiveness: preliminary results. European Radiology, 2017;27(7):3050–3059.
4. Ma, D., et al. Magnetic resonance fingerprinting. Nature, 2013;495(7440):187–192.
5. Yu, A. C., et al. Development of a combined MR fingerprinting and diffusion examination for prostate cancer. Radiology 2017;283(3):729–738.
6. Haralick, R. Textural features for image classification. IEEE Transactions on Systems, Man and Cybernetics, 1973:6;610-621
Figures