4363
Pulmonary Ventilation Imaging in Cystic Fibrosis Using Oxygen-enhanced MRI: Comparison with Hyperpolarized Helium-3 MRI1Medical Physics, University of Wisconsin-Madison, Madison, WI, United States, 2Radiology, University of Wisconsin-Madison, Madison, WI, United States, 3Pediatrics, University of Wisconsin-Madison, Madison, WI, United States, 4Biomedical Engineering, University of Wisconsin-Madison, Madison, WI, United States
Synopsis
Recent technical advances in oxygen-enhanced (OE) MRI using 3D radial UTE sequence support quantitative differentiation of diseased vs healthy lungs using ventilation defect percent (VDP). A cohort of cystic fibrosis (CF) subjects with different disease severities underwent spirometry, hyperpolarized (HP) 3He and OE-MRI and a subset of those returned for a repeat visit 1-2 weeks later. The results suggest global VDP measures from HP- and OE-MRI were correlated (ρ=0.80, p<0.0001) with comparable test-retest repeatability, showed similar correlation with spirometry. Moreover, UTE OE-MRI with isotropic spatial resolution provides both structural and functional evaluations of obstructed lungs.
INTRODUCTION
A repeatability study1 demonstrated that oxygen-enhanced MRI using 3D radial ultrashort echo time (OE-MRI) supports quantitative differentiation of diseased vs. healthy lungs using whole lung ventilation defect percent (VDP). However, VDP measures from this technique have not been quantitatively evaluated compared to that to the more established hyperpolarized 3He MRI (HP-MRI) technique. The purpose of this study was to evaluate global and regional agreement on VDP using both functional imaging techniques in cystic fibrosis (CF) subjects exhibiting a spectrum of disease severity with comparison to spirometric measures, forced expiratory lung volume in 1 second (FEV1) percent predicted (PP) and forced vital capacity (FVC) PP.METHODS
Seventeen (17) CF subjects (25±11 years, M/F=9/8) with various severities were enrolled in HIPAA-compliant studies with IRB approval. All subjects underwent pulmonary function test, HP and OE-MRI scans at 1.5 T (Signa HDx, GE Healthcare). Six subjects were each imaged at 2 separate visits 1-2 weeks apart.
OE-MRI: Two free-breathing UTE scans were performed successively with the subject breathing 21% O2 (normoxic) for the first acquisition and 100% O2 (hyperoxic) for the second with 32cm FOV, TR/TE=4.2/0.08ms, 8°flip, ~38000 projections, 1.25mm isotropic native resolution, and real-time gating to end-expiration applied with an adaptive 50% acceptance window. Each 3.5-min UTE volume was acquired after 2-minute wash-in period. UTE volumes were reconstructed offline at high- and low-resolutions (1cm3) for anatomy and PSE map respectively.2
HP-MRI: The single-breathhold 3He scan used a fast 2D multislice gradient-echo sequence with 40cm FOV, TR/TE=6.5/2.9ms; 7°flip, and 1.6x1.6x10mm spatial resolution. Proton MRI was performed prior to the 3He scan using a 2D single-shot multislice fast spin echo (ssfse) sequence under equivalent breath-hold conditions with FOV matching the 3He scan. For OE-MRI, lungs were segmented using the atlas-based estimation via registration.3 The high-resolution normoxic and hyperoxic UTE volumes were registered. The Jacobian determinant derived from this registration was applied voxelwise to account for physiological volume differences between normoxic and hyperoxic breathing. Details of this workflow have been previously published.1 For HP-MRI, proton images were registered to 3He using 3D affine registration by ANTs.5 Whole lung VDP was individually measured by the adaptive K-means method4 for HP- and OE-MRI. The 3D rigid registration was used to register lung volumes across visits for both HP- and OE-MRI. To align UTE and ssfse proton volumes, the UTE was downsampled to the ssfse resolution and deformed using the two-stage (rigid and B-Spline SyN5) registration. The association between spirometric measures and VDP was evaluated using Spearman rank correlation. VDP measures from the first visit were used. Bland-Altman plots with 95% limits of agreement (LOA) and Wilcoxon signed-rank test were used to compare VDP measured from OE- and HP-MRI, and assess the intra-method test-retest repeatability for global VDP. Dice coefficient was used to assess spatial overlap of segmented defects between repeated scans using OE- and HP-MRI respectively.
RESULTS
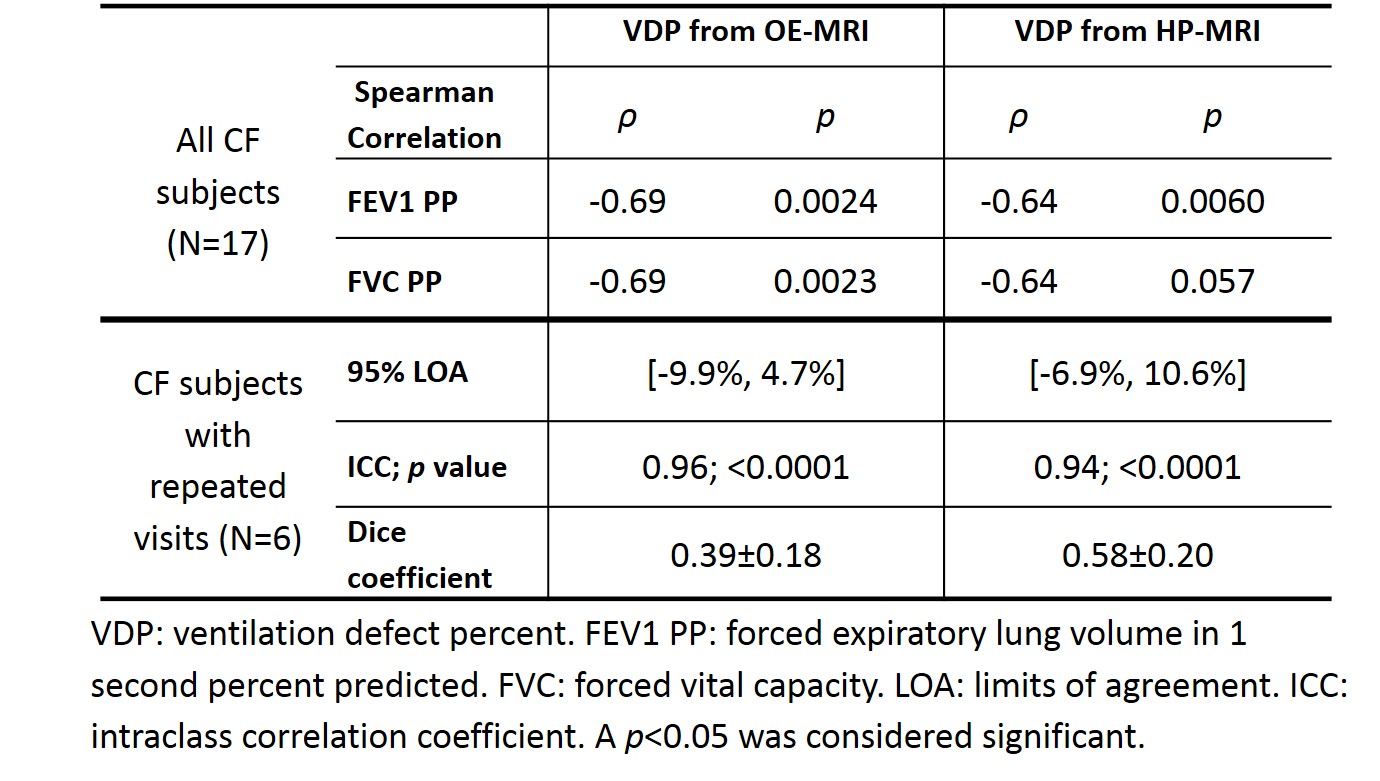
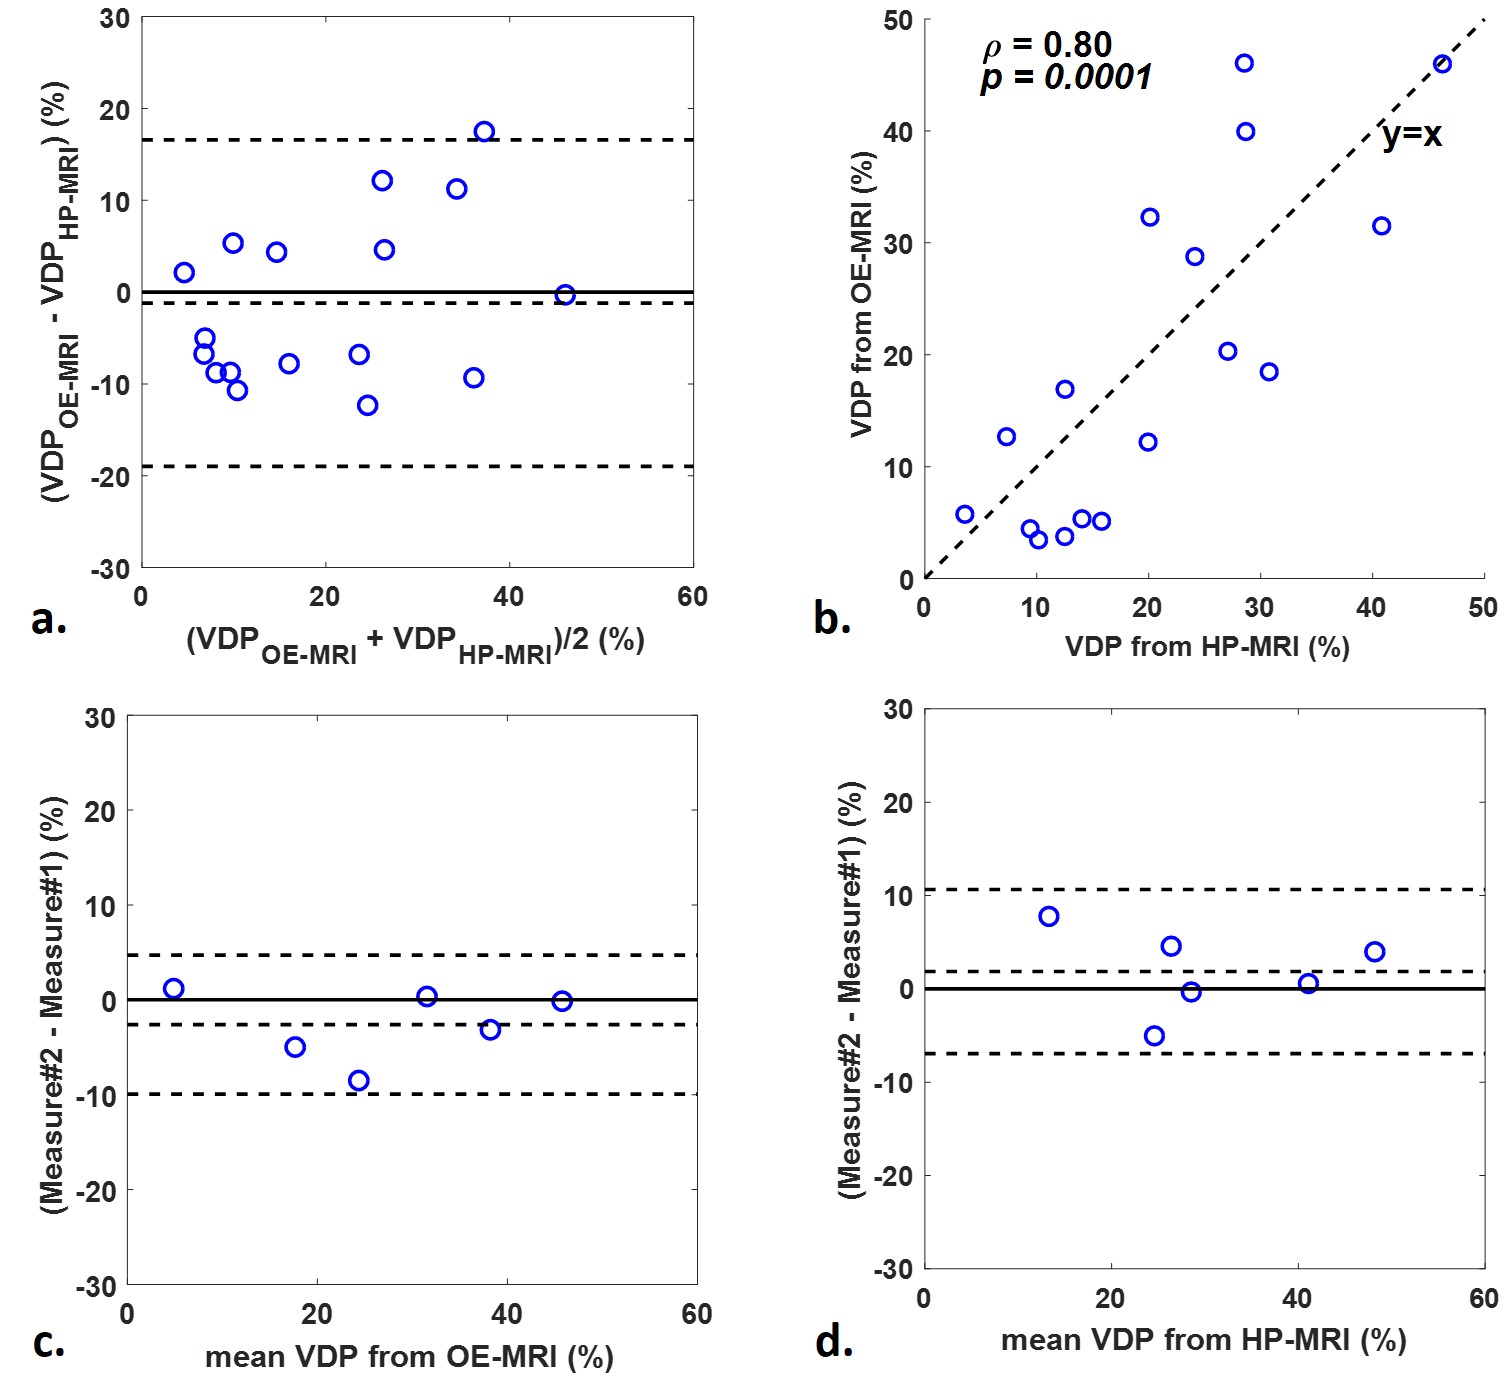
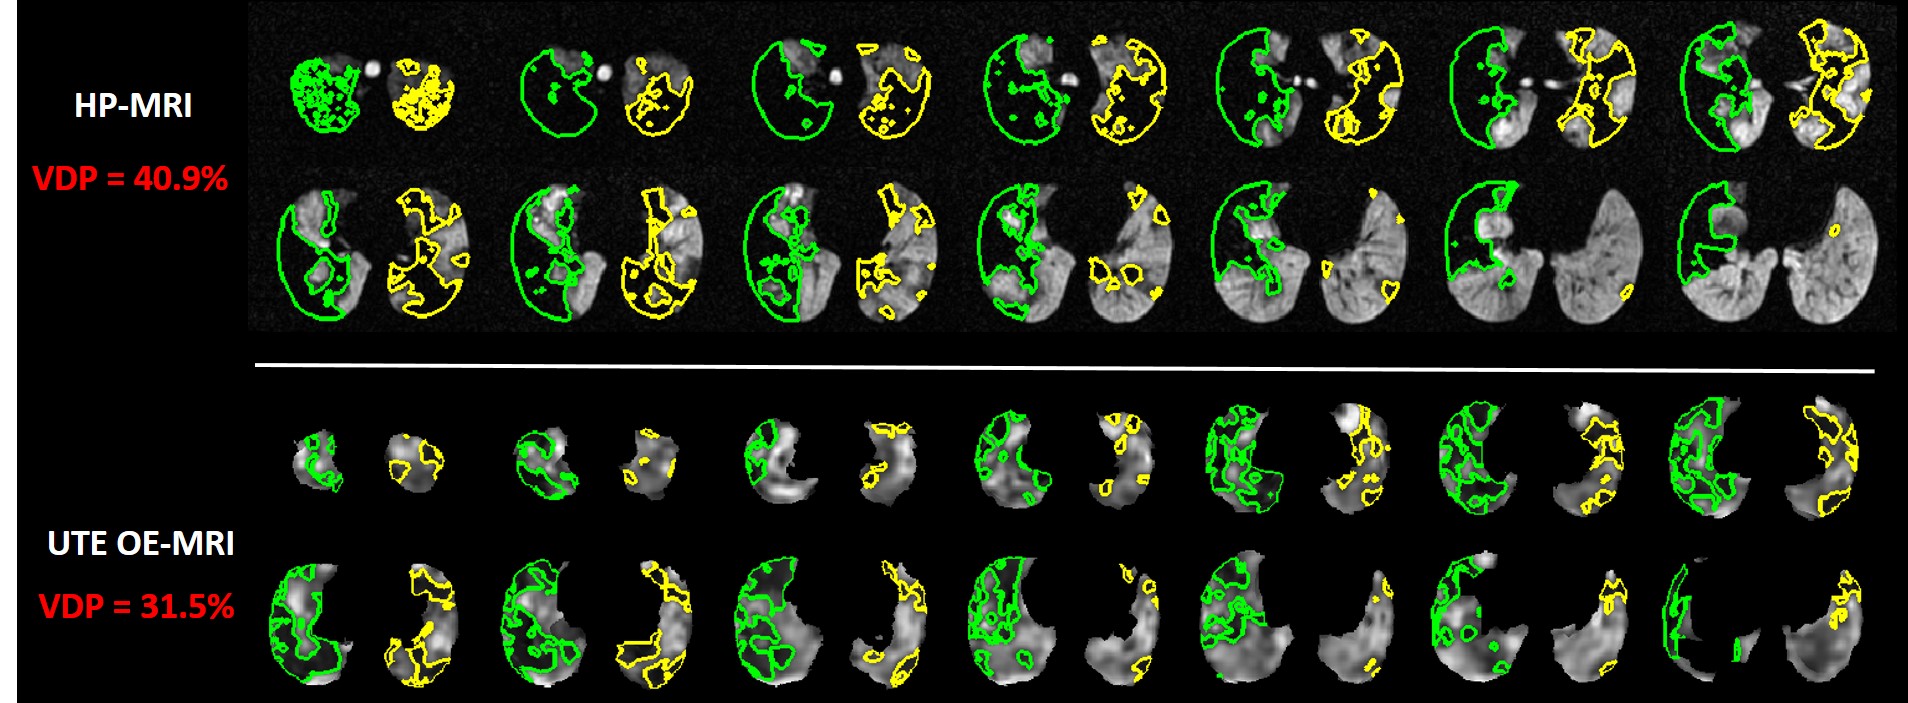
VDP from both OE- and HP-MRI was significantly correlated with spirometric measures (Table 1). Bland-Altman plots (Figure 1a) showed an insignificant (p=0.46) VDP bias of -1.2% with 95% LOA = [16.5%,-19%] between OE- and HP-MRI. VDP measured from OE-MRI significantly correlated with that from HP-MRI (Figure 1b). Bland-Altman analysis (Figure 1c and 1d) suggested similar agreement for the test-retest VDP measures using OE-MRI (-2.6% with 95% LOA = [-9.9%, 4.7%]) and HP-MRI (1.9% with 95% LOA = [-6.9%, 10.6%]). The Dice coefficient of inter-visit defects using HP-MRI (0.58) was better than OE-MRI (0.39, Table 1). Figure 2 shows an example case illustrating the segmented defects from OE- and HP-MRI for the same subject.DISCUSSION
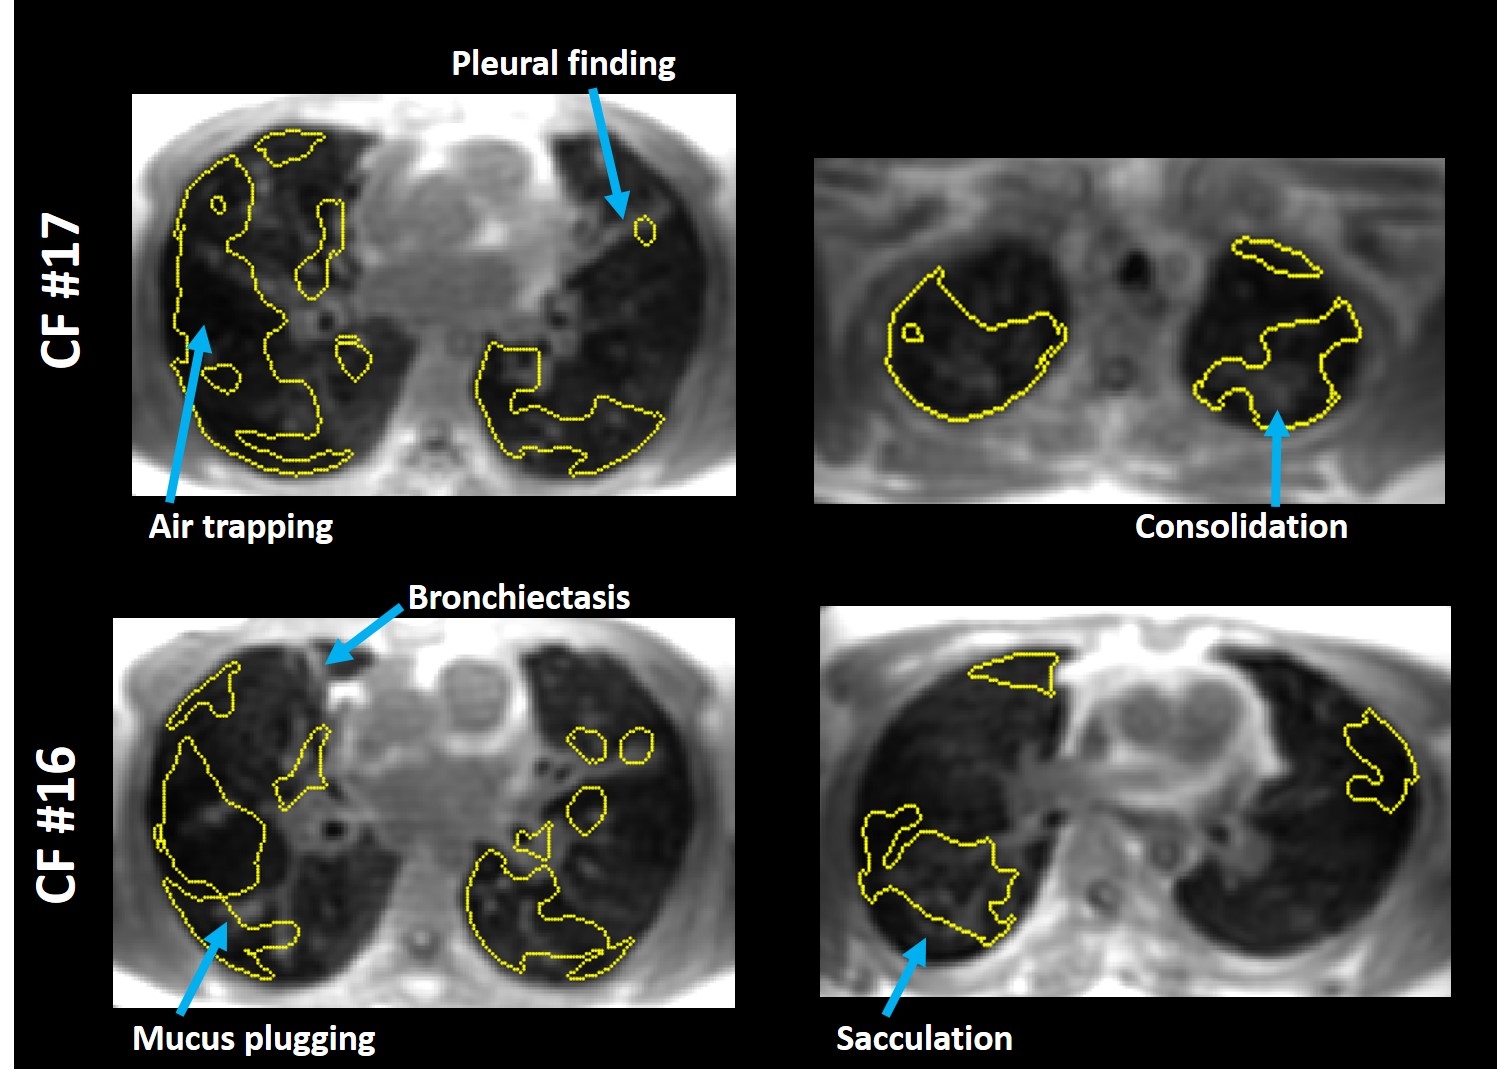
This study demonstrates comparable ventilation defect quantification in CF using OE-MRI compared to HP-MRI as a reference standard. We also found that VDP measured from OE-MRI showed equivalent correlation to spirometry compared to that from HP-MRI. Moreover, a recent study6 showed that UTE MRI can detect structural lung disease that correlate well with CT. Notably, since high-resolution UTE images are part of the OE-MRI acquisition, areas of air trapping and consolidation can be readily identified in spatial relationship to the segmented defects as shown in Figure 3. This distinctive feature makes OE-MRI inherently suitable for simultaneous evaluation of structure-function relationships. However, the spatial agreement of defects between HP- and OE-MRI is modest. The breat-hold vs. free-breathing acquisition and different through-plane resolution may contribute this observation.CONCLUSION
The capability of UTE OE-MRI to report similar VDP measures comparing to HP-MRI with strong correlation to spirometry makes this technique favorable for clinical functional imaging of obstructed lungs where evaluations of both structural and functional deficits are desired.Acknowledgements
This project was supported in part by grant UL1TR000427 to UW ICTR from NIH/NCATS, NIH/NHLBI U10 HL109168, pulmonary imaging center, NIH S10 OD016394, and Research and Development Fund from Departments of Radiology and Medical Physics, University of Wisconsin-Madison.References
1. Zha W, Kruger SJ, Johnson KM, et al. Pulmonary Ventilation Imaging in Asthma and Cystic Fibrosis Using Oxygen-Enhanced 3D Radial Ultrashort Echo Time MRI. J Magn Reson Imaging. 2017; doi:10.1002/jmri.25877.
2. Kruger SJ, Fain SB, Johnson KM, et al. Oxygen-enhanced 3D radial ultrashort echo time magnetic resonance imaging in the healthy human lung. NMR Biomed. 2014;27(12):1535-1541. doi:10.1002/nbm.3158.
3. Tustison NJ, Qing K, Wang C, et al. Atlas-based estimation of lung and lobar anatomy in proton MRI. Magn Reson Med. 2015;0:n/a-n/a. doi:10.1002/mrm.25824.
4. Zha W, Niles DJ, Kruger SJ, et al. Semiautomated Ventilation Defect Quantification in Exercise-induced Bronchoconstriction Using Hyperpolarized Helium-3 Magnetic Resonance Imaging: A Repeatability Study. Acad Radiol. 2016;23(9):1104-1114. doi:10.1016/j.acra.2016.04.005.
5. Tustison NJ, Avants BB. Explicit B-spline regularization in diffeomorphic image registration. Front Neuroinform. 2013;7:39. doi:10.3389/fninf.2013.00039.
6. Roach DJ, Cremillieux Y, Fleck RJ, et al. Ultrashort Echo-Time Magnetic Resonance Imaging Is a Sensitive Method for the Evaluation of Early Cystic Fibrosis Lung Disease. Ann Am Thorac Soc. 2016;13(11):1923-1931. doi:10.1513/AnnalsATS.201603-203OC.
Figures