4362
Discovery and Verification of Lung Cancer Serum Biomarkers using Paired Tissue and Serum1Pathology, Massachusetts General Hospital, Charlestown, MA, United States, 2Radiology, Charite Medical University, Berlin, Germany, 3Environmental and Occupational Medicine, Harvard T. H. Chan School of Public Health, Boston, MA, United States
Synopsis
A widespread, minimally-invasive method for early detection of lung cancer is urgently needed in the lung cancer clinic. Using high resolution magic angle spinning magnetic resonance spectroscopy, we measured paired tissue and serum samples from the same patients. We correlated serum and tissue results to discover and verify serum markers for lung cancer types and stages and predicted overall survival for early Stage I lung cancer. Measured from serum, prolonged survival is associated with relative overexpression of glutamine, valine, glycine, and relative suppression of glucose and lipids.
Introduction
As the leading cause (>26%) of cancer death in the US, lung cancer (LuCa) is usually diagnosed at late stages, with >70% of the patients who develop LuCa dying from it since no widespread, early screening test exists1. Although low-dose spiral CT (LDCT) can detect small LuCa lesions2-5, high cost6-9 and a radiation hazard for low-risk populations10-13 preclude widespread screening. Inspired by positive findings in genomics studies of blood biomarkers14-17, we measured the functional metabolomics read-outs of the upstream genomics and proteomic processes with paired tissue and serum samples from the same patients. We correlated serum and tissue results to discover and verify serum markers for LuCa types and stages, and to predict overall survival for early Stage I LuCa.Methods
Samples. Human LuCa tissue and paired serum samples were obtained from two non-small cell LuCa types: squamous cell carcinoma (SCC, n=42) and adenocarcinoma (Adeno, n=51), and 29 healthy serum samples. Stage I cases (n=58) and Stages II, III, and IV (n=35) were included. MR Spectroscopy. High resolution magic angle spinning MRS measurements for both tissue and sera were performed at 4°C. Spectra were acquired on a 600MHz Bruker spectrometer at 3,600 Hz using a rotor-synchronized Carr-Purcell-Meiboom-Gill sequence. Spectra were analyzed with a MatLab-based curve fitting program, and spectral regions (n=32) were determined based on regions where a value was measured in 80% of samples. Histopathology. Standard histopathological analysis was performed for tissue after MRS. A pathologist estimated volume percentage of four pathological features: cancer, fibrosis/inflammation, necrosis, cartilage.Results
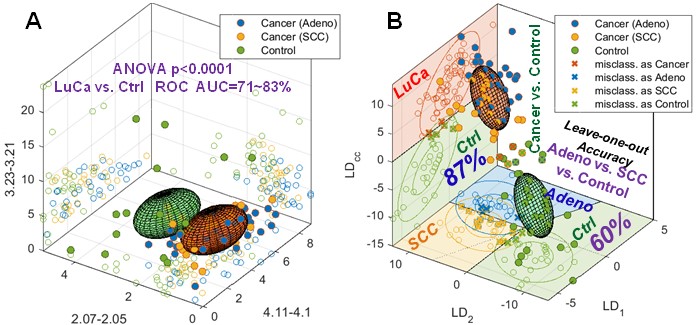
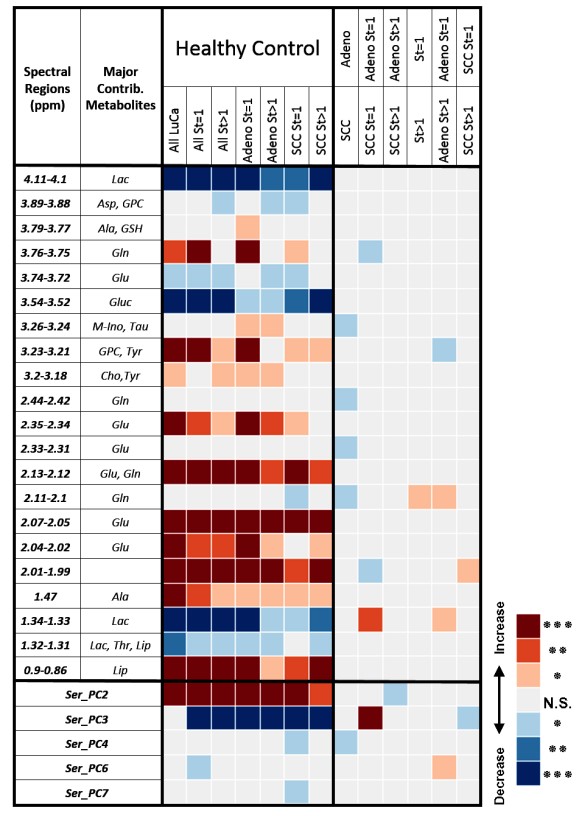
Serum. Results from serum MRS showed that 19/32 spectral regions and 5/8 PCs differentiated healthy and LuCa groups. Eight spectral regions and 4 PCs could differentiate types and stages (Table 1). Although multiple spectral regions showed statistical significance in differentiating LuCa from controls, significant overlap between groups is also obvious (Figure 1A), even for the three most significant regions. The multi-dimensional comparison method of leave-one-case-out linear discriminator (LD) analyses involving all spectral regions improved differentiation between LuCa and control (vertical panel), as well as among all three groups (horizontal panel), with leave-one-out verification (Figure 1B).
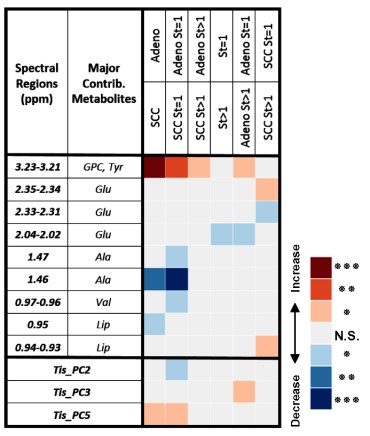
Tissue. MRS data measured from tissues were calibrated based on the vol% of pathological features using a least square regression of over-determined linear model (LSR-ODLM), and produced differentiation results, similar as Table 1 for sera (Table 2).
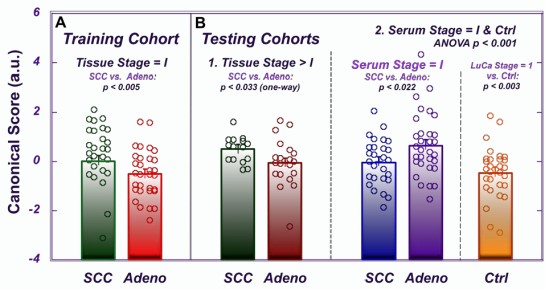
Serum-tissue correlations. A canonical analysis (CANCOR) using 8 PCs from the stage I LuCa samples as a training cohort was performed to discover discriminators of Stage I Adeno vs. SCC. These CANCOR parameters were successfully applied to two testing cohorts: Stage II, III, and IV tissue cases and serum PCs (Figure 2). Interestingly, the canonical score values were reversed for tissue and serum.
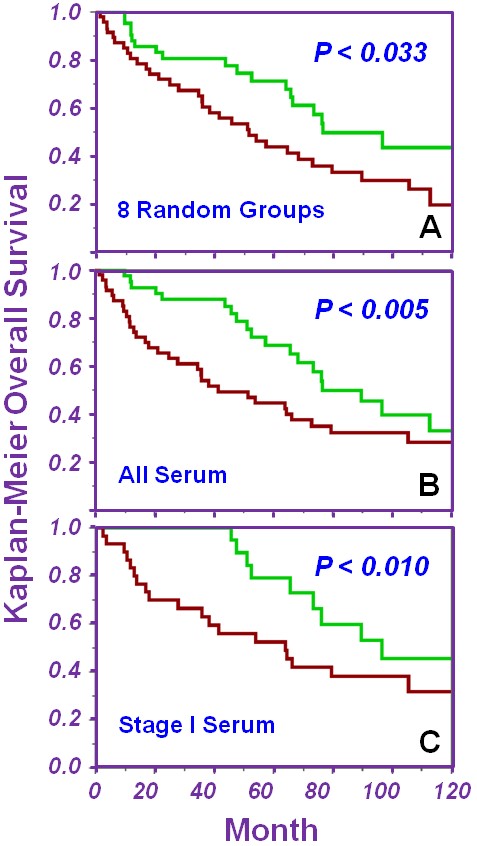
Predicting survival. Using the average survival time of 41.3mo as a threshold to define short vs. prolonged living, we randomly divided the 93 samples into 8 groups and used the leave-one-group-out method to repeatedly test each training and testing cohort combination. After all iterations, CANCOR values for all cases when they were testing cohorts were combined. The median value became the threshold to successfully differentiate short (red) vs. prolonged (green) living (Figure 3A). Lastly, we included all nine serum spectral regions in a canonical analysis to predict 10-year survival estimates for all LuCa cases (Figure 3B) and Stage I cases alone (Figure 3C). Prolonged survival is associated with relative overexpression of glutamine, valine, glycine, and relative suppression of glucose and lipids in serum.
Discussion and Conclusions
Overexpression of glycine18 and glutamine19 in LuCa is consistent with the amino acid’s role in tumor cell growth. In prolonged living cases, increased serum glutamine levels is concordant with slower-growing tumors consuming less glutamine. Glutamine is a fatty acid precursor20 and is converted to glucose for energy, especially when glucose is limited. In prolonged survival cases where glutamine is abundant, it is reasonable to expect less conversion to lipids and glucose, as was observed. Non-small cell LuCa often show increased valine uptake21, so increased levels of valine in serum for prolonged survival cases suggest less uptake by these less aggressive tumors.
The ability of serum to differentiate between LuCa types and stages underlines its potential to be used as an early, noninvasive screening method. Furthermore, successful application of tissue CANCOR parameters to separate SCC and Adeno based on serum suggests that metabolic changes occurring in malignant tissue are correlated with, and detectable in, serum. LuCa metabolomics provides not only survival estimates of prolonged versus short living for all LuCa cases but for Stage I LuCa cases, which is a result currently unavailable in clinic.
Acknowledgements
NIH grants CA115746 and 1U01CA290414 and the A. A. Martinos Center for Biomedical Imaging.References
1 Siegel, R. L., Miller, K. D. & Jemal, A. Cancer Statistics, 2017. CA: a cancer journal for clinicians 67, 7-30, doi:10.3322/caac.21387 (2017).
2 National Lung Screening Trial Research, T. et al. Results of initial low-dose computed tomographic screening for lung cancer. The New England journal of medicine 368, 1980-1991, doi:10.1056/NEJMoa1209120 (2013).
3 Kovalchik, S. A. et al. Targeting of low-dose CT screening according to the risk of lung-cancer death. The New England journal of medicine 369, 245-254, doi:10.1056/NEJMoa1301851 (2013). 4 Tammemagi, M. C. et al. Selection criteria for lung-cancer screening. The New England journal of medicine 368, 728-736, doi:10.1056/NEJMoa1211776 (2013).
5 Garcia-Velloso, M. J. et al. Assessment of indeterminate pulmonary nodules detected in lung cancer screening: Diagnostic accuracy of FDG PET/CT. Lung cancer 97, 81-86, doi:10.1016/j.lungcan.2016.04.025 (2016).
6 Mauchley, D. C. & Mitchell, J. D. Current estimate of costs of lung cancer screening in the United States. Thoracic surgery clinics 25, 205-215, doi:10.1016/j.thorsurg.2014.12.005 (2015).
7 Cressman, S. et al. Resource utilization and costs during the initial years of lung cancer screening with computed tomography in Canada. Journal of thoracic oncology : official publication of the International Association for the Study of Lung Cancer 9, 1449-1458, doi:10.1097/JTO.0000000000000283 (2014).
8 Rasmussen, J. F. et al. Healthcare costs in the Danish randomised controlled lung cancer CT-screening trial: a registry study. Lung cancer 83, 347-355, doi:10.1016/j.lungcan.2013.12.005 (2014).
9 Goulart, B. H., Bensink, M. E., Mummy, D. G. & Ramsey, S. D. Lung cancer screening with low-dose computed tomography: costs, national expenditures, and cost-effectiveness. Journal of the National Comprehensive Cancer Network : JNCCN 10, 267-275 (2012).
10 Huber, A. et al. Performance of ultralow-dose CT with iterative reconstruction in lung cancer screening: limiting radiation exposure to the equivalent of conventional chest X-ray imaging. European radiology, doi:10.1007/s00330-015-4192-3 (2016).
11 Murugan, V. A., Kalra, M. K., Rehani, M. & Digumarthy, S. R. Lung Cancer Screening: Computed Tomography Radiation and Protocols. Journal of thoracic imaging 30, 283-289, doi:10.1097/RTI.0000000000000150 (2015).
12 McCunney, R. J. & Li, J. Radiation risks in lung cancer screening programs: a comparison with nuclear industry workers and atomic bomb survivors. Chest 145, 618-624, doi:10.1378/chest.13-1420 (2014).
13 Christiani, D. C. Radiation risk from lung cancer screening: glowing in the dark? Chest 145, 439-440, doi:10.1378/chest.13-2588 (2014).
14 Hennessey, P. T. et al. Serum microRNA biomarkers for detection of non-small cell lung cancer. PloS one 7, e32307, doi:10.1371/journal.pone.0032307 (2012).
15 Kohler, J. et al. Circulating U2 small nuclear RNA fragments as a diagnostic and prognostic biomarker in lung cancer patients. Journal of cancer research and clinical oncology 142, 795-805, doi:10.1007/s00432-015-2095-y (2016).
16 Leidinger, P. et al. High-throughput qRT-PCR validation of blood microRNAs in non-small cell lung cancer. Oncotarget 7, 4611-4623, doi:10.18632/oncotarget.6566 (2016).
17 Montani, F. et al. miR-Test: a blood test for lung cancer early detection. Journal of the National Cancer Institute 107, djv063, doi:10.1093/jnci/djv063 (2015).
18 Antonov, A. et al. Bioinformatics analysis of the serine and glycine pathway in cancer cells. Oncotarget 5, 11004-11013, doi:10.18632/oncotarget.2668 (2014).
19 De Vitto, H., Perez-Valencia, J. & Radosevich, J. A. Glutamine at focus: versatile roles in cancer. Tumour biology : the journal of the International Society for Oncodevelopmental Biology and Medicine 37, 1541-1558, doi:10.1007/s13277-015-4671-9 (2016).
20 Martinez-Outschoorn, U. E., Peiris-Pages, M., Pestell, R. G., Sotgia, F. & Lisanti, M. P. Cancer metabolism: a therapeutic perspective. Nature reviews. Clinical oncology 14, 11-31, doi:10.1038/nrclinonc.2016.60 (2017).
21 Mayers, J. R. et al. Tissue of origin dictates branched-chain amino acid metabolism in mutant Kras-driven cancers. Science 353, 1161-1165, doi:10.1126/science.aaf5171 (2016).
Figures