4361
Quantification of Hyperpolarized 3He MRI Ventilation Heterogeneity in Asthmatics: Surface Area of Ventilation Clusters1Robarts Research Institute, London, ON, Canada, 2Medical Biophysics, Western University, London, ON, Canada, 3Medicine, Division of Respirology, Western University, London, ON, Canada
Synopsis
Ventilation heterogeneity measured using hyperpolarized noble-gas magnetic-resonance imaging (MRI), presents a significant challenge in terms of the need for imaging processing tools to generate rapid, reproducible, intuitive and clinically relevant biomarkers. In particular, new tools are needed to differentiate ventilation defects and patchy ventilation that likely represent different functional phenotypes. Therefore, here we developed a new way to quantify MRI ventilation heterogeneity using the surface area between ventilation clusters – the ratio of surface area to ventilation volume (SAVV) measured in units of mm-1. MRI SAVV was significantly greater in severe asthmatics (n=24), as compared to mild-to-moderate asthmatics (n=16).
Introduction
Hyperpolarized 3He and 129Xe ventilation defect percent (VDP) were previously developed as biomarkers and recently validated as measurements of pulmonary ventilation heterogeneity.1,2 While VDP provides a robust and reproducible measure of the volume of ventilation abnormalities normalized to total lung volume, this measurement cannot differentiate between smaller defects observed in patchy or partial ventilation, common in severe asthma as compared to larger wedge-shaped segmental and subsegmental ventilation defects, typically observed in COPD and mild-moderate asthma. While previous work piloted the use of texture tools to quantify ventilation heterogeneity in asthmatics,3 these measurements are difficult to intuitively understand and their clinical meaning is not obvious. With the rapid evolution of advanced image processing methods including the use of higher-order image statistics, machine learning and supervised or deep learning, it will be critical to focus on the development of biomarkers and measurements that have clinical and physiological meaning. MRI ventilation heterogeneity provides a unique opportunity for such tools as it has been shown to be correlated with asthma severity,4 smooth muscle hyper-responsiveness5 and response to treatment.6 However, the clinical relevance of patchy ventilation as compared to larger ventilation defects has not been determined. Therefore, the purpose of this proof-of-concept image processing research was to develop a novel biomarker of ventilation heterogeneity, that helps explain differences in patchy ventilation and ventilation defects.Methods
Participants: Forty participants including mild-to-moderate (n=16) and severe (n=24) asthmatics (classified according to the Global Initiative for Asthma [GINA]),7 provided informed written consent to an approved study protocol and were evaluated using MRI and pulmonary function tests.
Image Acquisition: Hyperpolarized 3He ventilation images (total-acquisition-time=10s; TR/TE/flip-angle=3.8ms/1.0ms/7°; FOV=40×40cm; matrix=128×80; BW=62.5kHz; NEX=1; slices=15; slice-thickness=15mm) and 1H anatomical images (total-acquisition-time=16s; TR/TE/flip-angle=4.7ms/1.2ms/30°; FOV=40×40cm; matrix=128×80; BW=24.4kHz; NEX=1; slices=15; slice-thickness=15mm), were acquired as previously described6 on a 3T Discovery MR750 system (GE Healthy Care, Milwaukee, WI).
Image Analysis: MR images were co-registered using an affine registration algorithm and segmented; the ventilation was clustered into 5 categories, or levels, using k-means clustering as previously described.8 VDP was calculated as the total ventilation defect volume normalized to the total thoracic cavity volume. The ratio of the surface area for each of 5 ventilation clusters to total lung ventilation volume (SAVV) was generated in MATLAB (The MathWorks Inc, Natick, MA). The data was processed as shown in Figure 1, by resampling the data (voxel size = 1.5625x1.5625x15mm) using a nearest neighbors approach and applying a 5x5 voxel median filter. The surface area of the boundary between adjacent clusters was calculated for each voxel and the final sum was expressed as a ratio by dividing this sum by the ventilated volume.
Statistical Analysis: To determine the significance of differences for SAVV in severe and mild-to-moderate asthmatics, a Welch’s unequal variances two-tailed t-test was applied. All statistics were performed using GraphPad Prism version 7.00 (GraphPad Software Inc) and results were considered significant when the probability of two-tailed type I error was less than 5% (p<.05).
Results
We evaluated 16 mild-moderate asthmatics (8M/8F, 47±14-years) and 24 severe asthmatics (9M/15F, 51±12-years). Figure 1 provides an example of ventilation images for two participants, with very similar VDP < 3%. In one participant (F, 46-years), a patient with severe asthma (forced expiratory volume in 1 second (FEV1)=78 %pred, VDP=3%, lung-clearance-index (LCI)=8.6 and ratio of FEV1 with forced vital capacity (FEV1/FVC)=69%), there was visually obvious ventilation heterogeneity. In the other participant (M, 31-years) with mild-to-moderate asthma (FEV1=97 %pred, VDP=0.2%, LCI=6.9 and a FEV1/FVC=88%), there was homogenous gas distribution. In the patient with severe asthma, SAVV was 0.16 mm-1 and in the mild-moderate asthmatic, SAVV was 0.10 mm-1. Figure 2, shows that VDP was not significantly different between groups, while SAVV (p=0.04) and LCI (p=0.04) were both significantly greater in the severe asthmatic subgroup.Discussion and Conclusion
In this proof-of-concept evaluation, we generated a new image-processing method and a novel biomarker, SAVV that quantifies ventilation heterogeneity while taking into account the spatial distribution of ventilation clusters. For example, in the case of patchy ventilation, SAVV would be larger whereas in patients with a single wedge-shaped ventilation defect, SAVV would be smaller. SAVV provides a new way to quantify ventilation heterogeneity, providing a first step towards higher-order image analysis including machine learning measurements of ventilation heterogeneity.Acknowledgements
No acknowledgement found.References
1 Svenningsen, S. et al. Eur Respir J (2016).
2 Kirby, M. et al. Acad Radiol (2012).
3 Zha, N. et al. Acad Radiol (2016).
4 de Lange, E. E. et al. Chest (2006).
5 Samee, S. et al. J Allergy Clin Immunol (2003).
6 Svenningsen, S. et al. JMRI (2013).
7 Becker, A. B. et al. Curr Opin Allergy Cl (2017).
8 Guo, F. et al. Med Phys (2016).
Figures
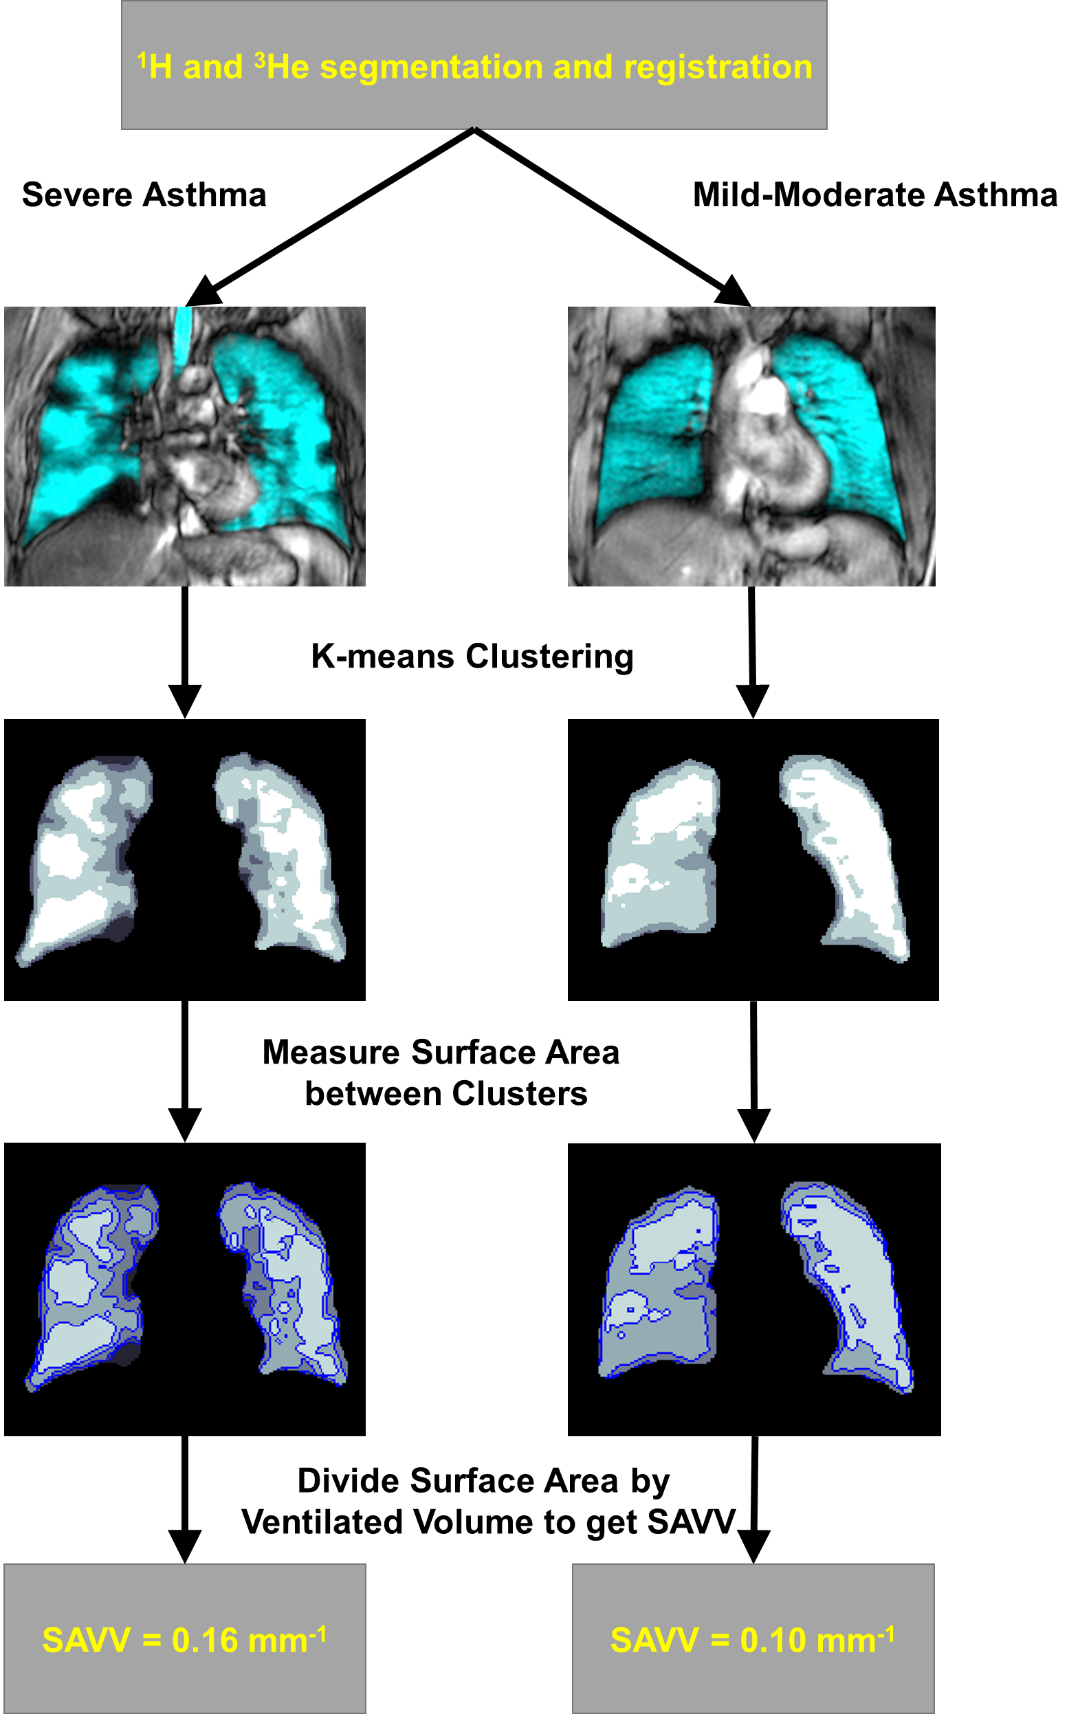
Figure 1. The pipeline to calculate SAVV, displayed in two patients.
The patient on the left is classified as having severe asthma, with; FEV1 = 78%pred and VDP = 3%. The patient of the right is classified as having mild-to-moderate asthma with; FEV1 = 97%pred and VDP = 0.2%. Both patients have a VDP comparable to a healthy subject, however the elevated SAVV in the severe asthmatic indicates increased ventilation heterogeneity.
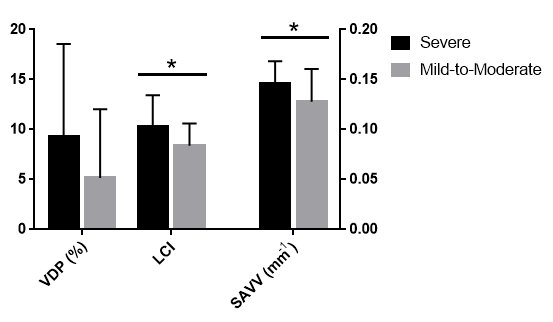
Figure 2. Comparison between measures of ventilation heterogeneity in severe and mild-to-moderate asthma.
SAVV (p=0.04) and LCI (p=0.04) were significantly greater in participants with severe asthma; VDP (p=0.1) was not significantly different between the groups. n=24 severe subjects for SAVV and VDP, n=22 severe subjects for LCI.