4358
Correction for Ventilation Quantification Errors due to Registration in Pulmonary Lung MRI Fourier Decomposition1Institute of Diagnostic and Interventional Radiology, Hannover Medical School, Hanover, Germany, 2Biomedical Research in Endstage and Obstructive Lung Disease Hannover (BREATH), German Center for Lung Research (DZL), Hanover, Germany
Synopsis
Ventilation-perfusion (V/Q) scan plays an important role in the assessment of lung function. Currently, Fourier Decomposition (FD), a method for simultaneous ventilation and perfusion measurement, uses fractional ventilation (FV) as a semi-quantitative measurement of lung ventilation. Just recently, a multi-echo spoiled gradient echo sequence method for regional alveolar ventilation (AV) measurement with FD was presented. This study demonstrates that both methods suffer from an artificial proton amount change during registration, which affects quantification. Correction factors are derived for both methods and used to compare AV and FV measurement. Additionally, the regional influence of T2* correction is assessed.
Introduction
Fourier Decomposition (FD)1 has been demonstrated to deliver
quantitative measurement of pulmonary ventilation2,3. Based on the fractional ventilation
($$$FV = \Delta V/V_{Insp}$$$), which reflects the percentage of ventilation with
respect to the inspiratory lung volume, absolute ventilation ΔV of one slice
can be calculated by multiplication of the mean FV with the volume of the
respective slice VInsp3. As demonstrated in the
following, this quantification can be interpreted as a summation over all FV
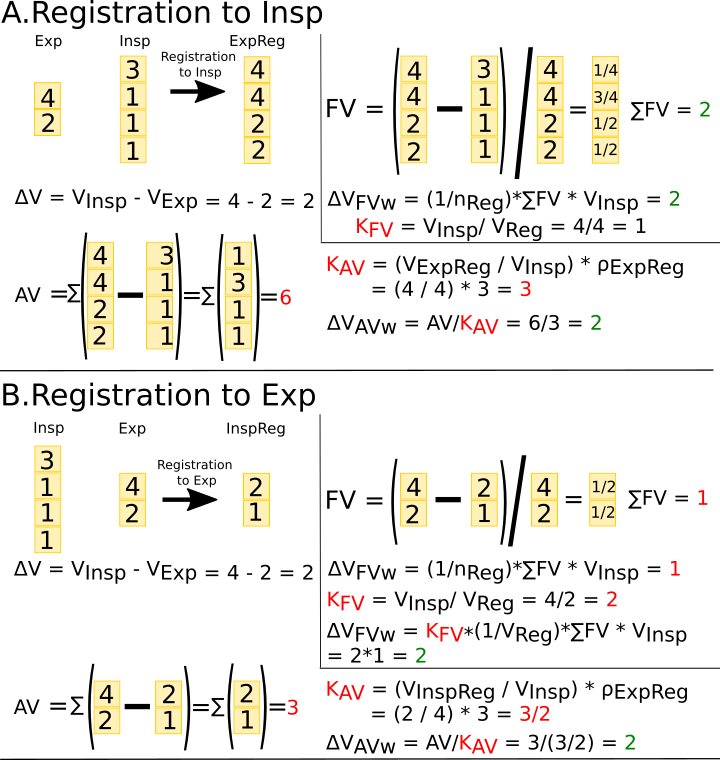
corrected by a registration dependent factor KFV: $$$\Delta V = 1/n_{Reg}\sum\limits^{n_{Reg}}_iFV_i\cdot V_{Insp} = V_{voxel}\cdot n_{Insp}/n_{Reg}\sum\limits^{n_{Reg}}_i FV_i = \sum\limits^{n_{Reg}}_i K_{FV}\cdot FV_i$$$.
Alternatively, regional ΔV (alveolar ventilation (AV)) can be assessed by quantification of proton density variations in the lung under breathing4. In theory, the sum of regional ΔV over all lung voxels should be equal to global volume change. But the registration between different respiratory states affects the evaluated voxel amount nReg and falsifies the final ΔV result (see Fig. 1). Similar to FV, a correction factor $$$K_{AV} = \left(V_{Reg}/V_{Insp}\right)\cdot\rho_{ExpReg}$$$ (Fig. 1) can be derived from $$$\Delta V = FV \cdot V_{Insp}$$$ and $$$\Delta V = AV/K_{AV}$$$ results in a correct measurement (Fig. 1). The global FV and AV ventilation results of healthy volunteers are compared to validate the derived KFV and KAV constants.
Methods
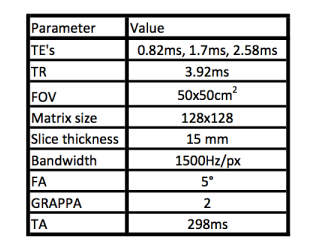
Twelve healthy volunteers (six females, age range: 25-63) were examined in supine and prone position at 1.5T (Magnetom Avanto, Siemens Healthineers, Erlangen, Germany). A sagittal slice of the right lung was acquired using a 2D triple-echo FLASH sequence (see Table 1).
A Gadolinium-doped water phantom (T1=1200ms), was placed on or under the subject’s chest depending on posture. All acquired images were registered towards intermediate respiratory position by means of ANTS5. Using a mono-exponential fit, the PD weighted signal was determined for expiration, intermediate and inspiration respiratory group. The PD images were normalized to the phantom signal in order to obtain regional water density. Air proportion was calculated as (1-water density). AV is calculated as air difference between expiration and inspiration image and multiplied by breathing frequency (f) and voxel volume (Vvoxel): $$$AV=\left(\rho_{Exp}-\rho_{Insp}\right)\cdot f\cdot V_{voxel}$$$.
FV maps were calculated using the PREFUL6 method.
The lung parenchyma was segmented as a region of interest (ROI). Global FV in ml/min was determined as follows: Sum of KFV*FV inside ROI multiplied with breathing frequency. Global AV was calculated as a sum of KAV*AV values inside ROI. Additionally, to test for regional differences between AV and FV a voxel-wise Pearson correlation was performed.
Results
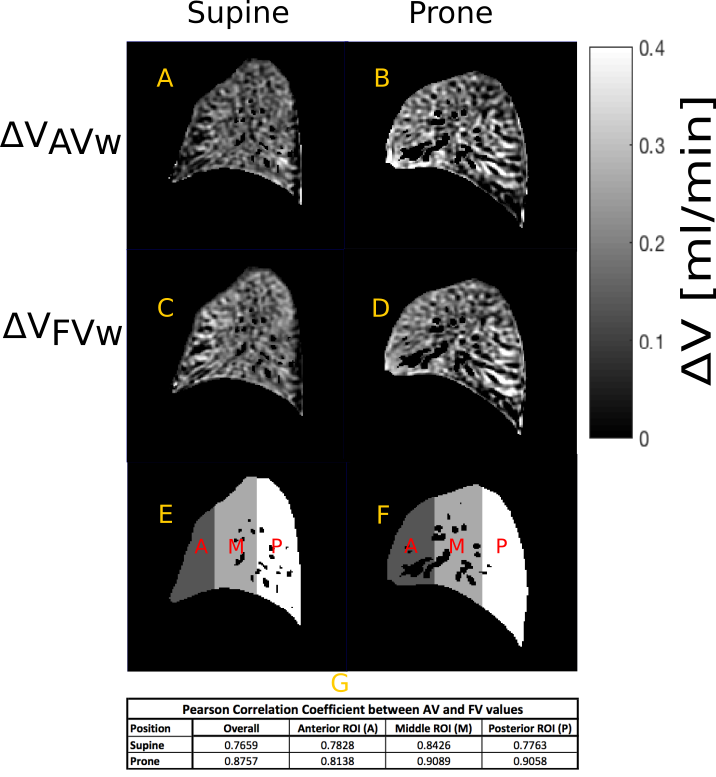
Fig. 2 and 3 show exemplary results of AV and FV for healthy volunteer in supine and prone position. The median voxel-wise correlation was 0.83 (lower quartile 0.82, upper quartile 0.86) for supine and 0.84 (lower quartile 0.82, upper quartile 0.87) for prone position. Regional differences can be observed especially in the most dependent lung regions (Fig. 3i, 3j).
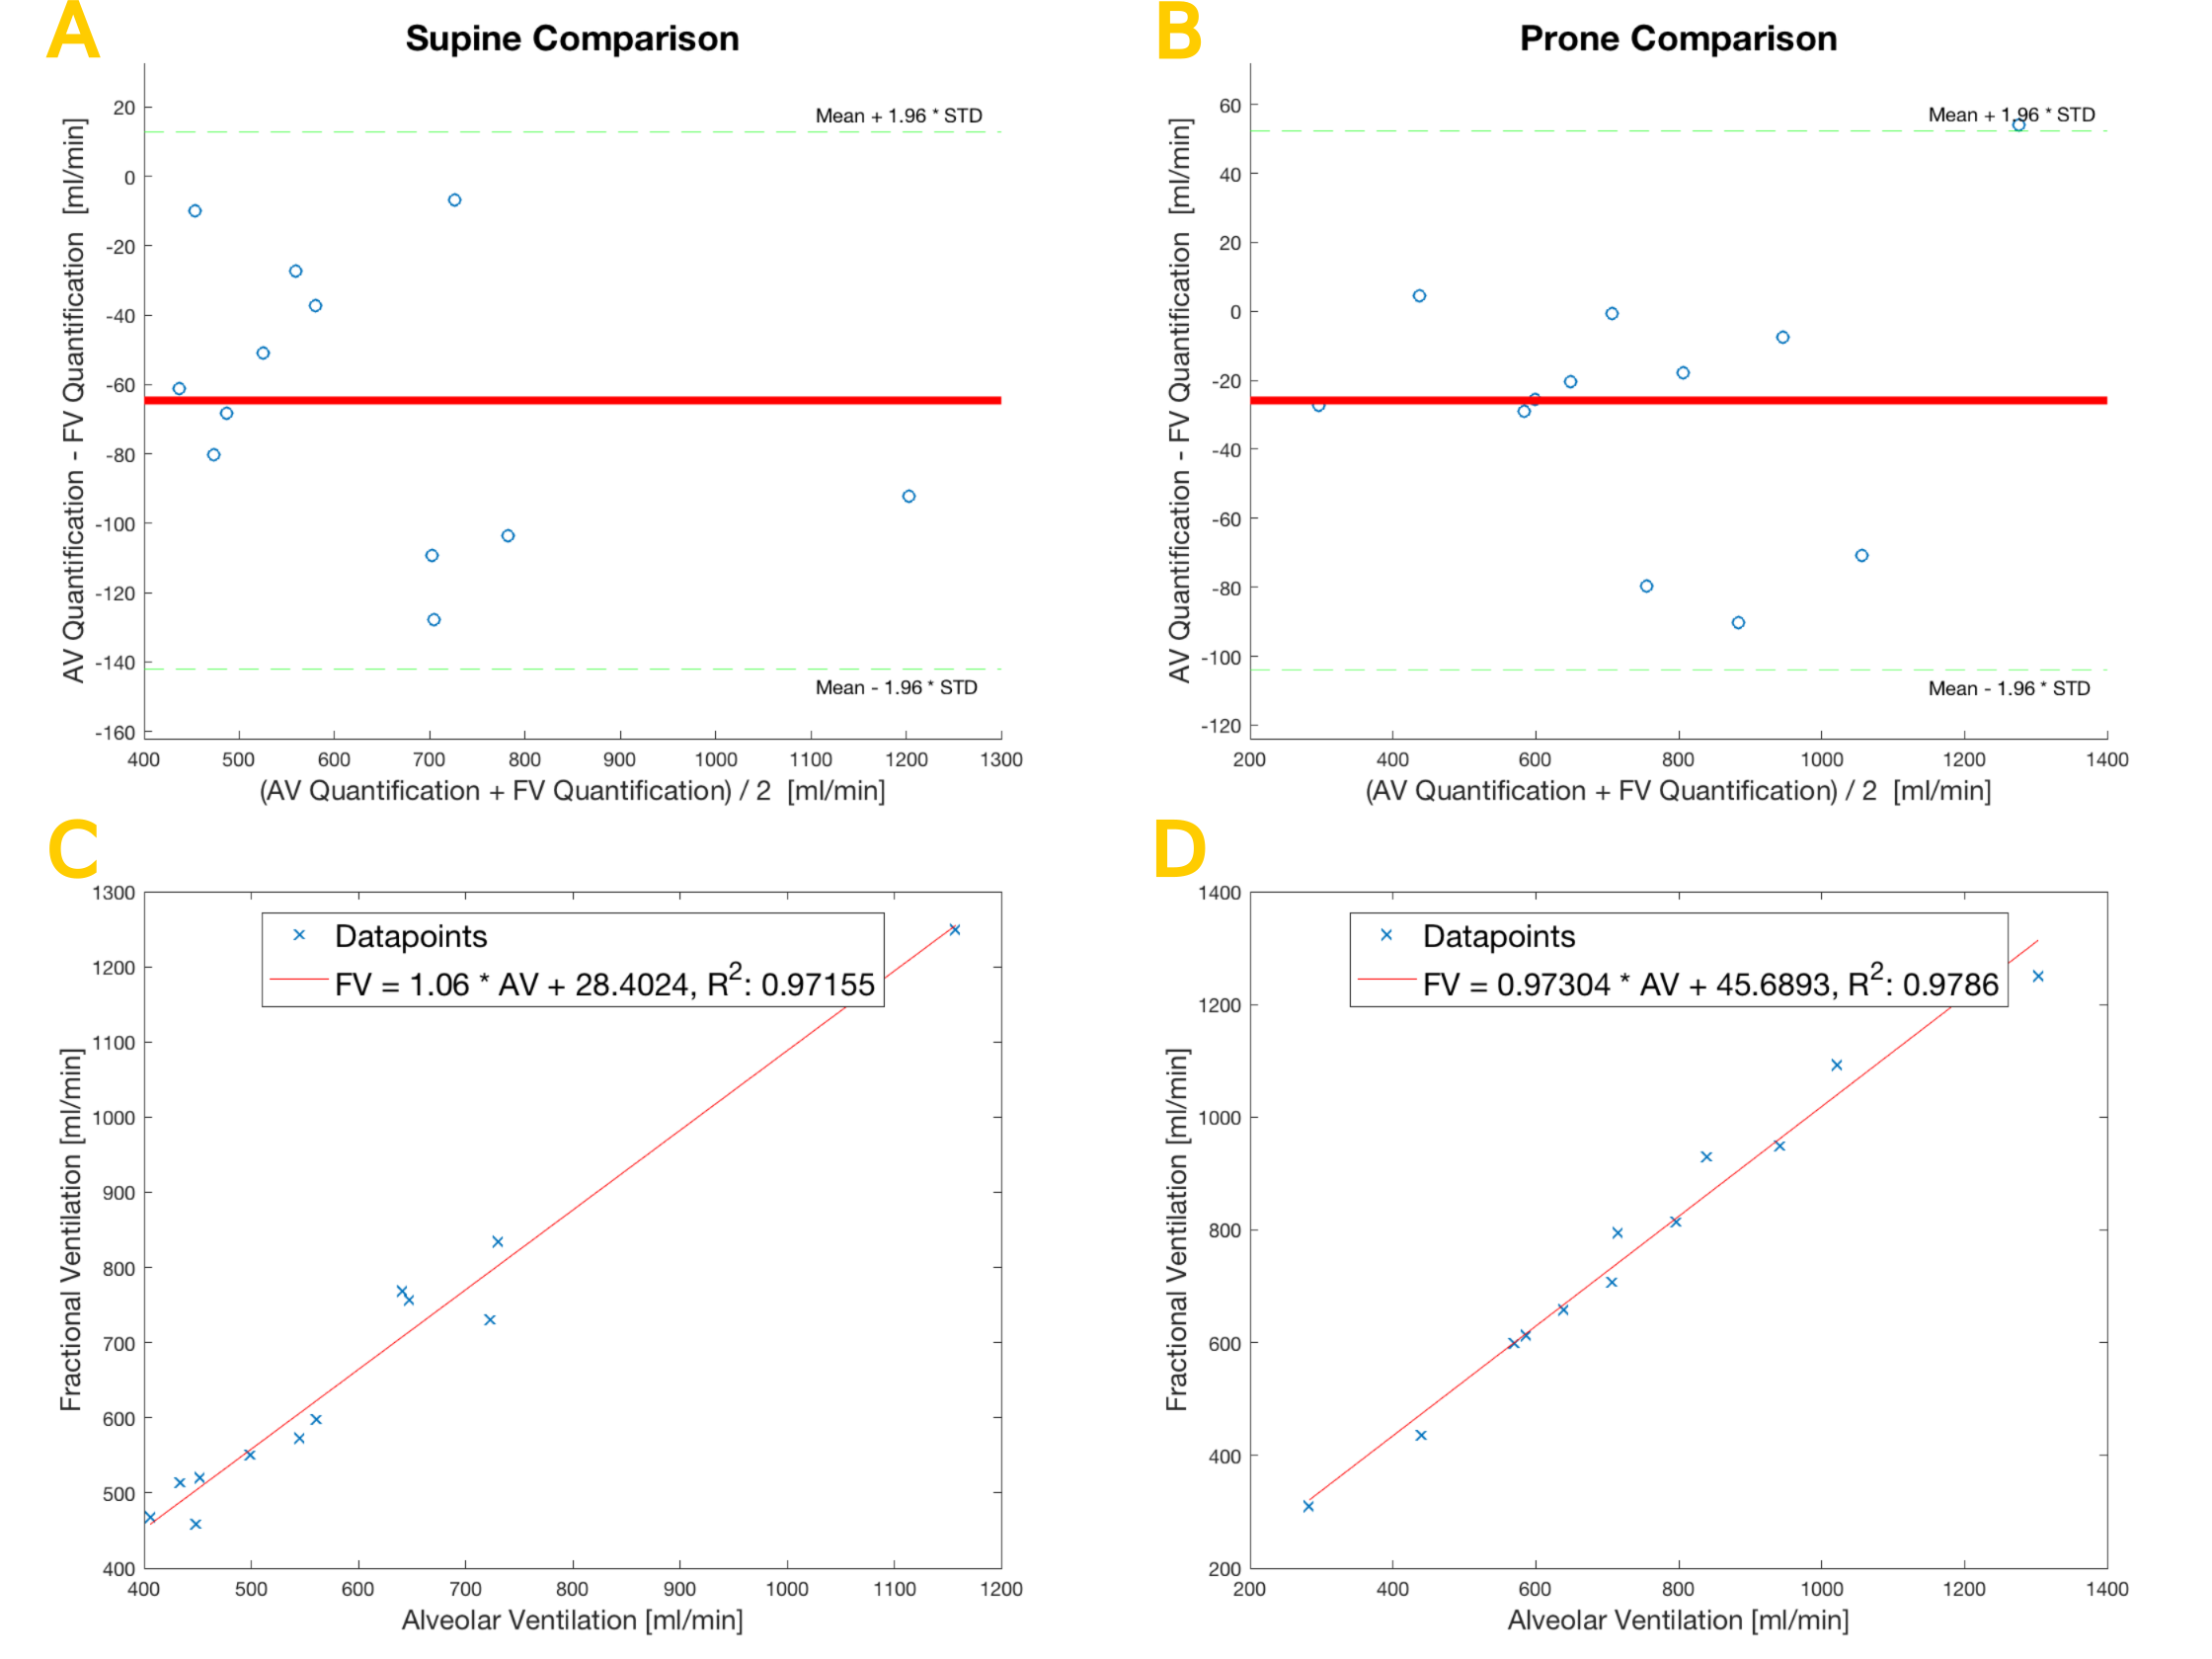
Bland-Altman plots (Fig. 4a, 4b) depict the differences between global ventilation values of both methods for supine and prone position. Correlation analysis (Fig. 4c, 4d) of global AV and FV values provided a slope of 1.06 and an intercept of 28.40 (R2=0.97) for supine and slope of 0.97 and an intercept of 45.69 (R2=0.98) for prone position.
Discussion
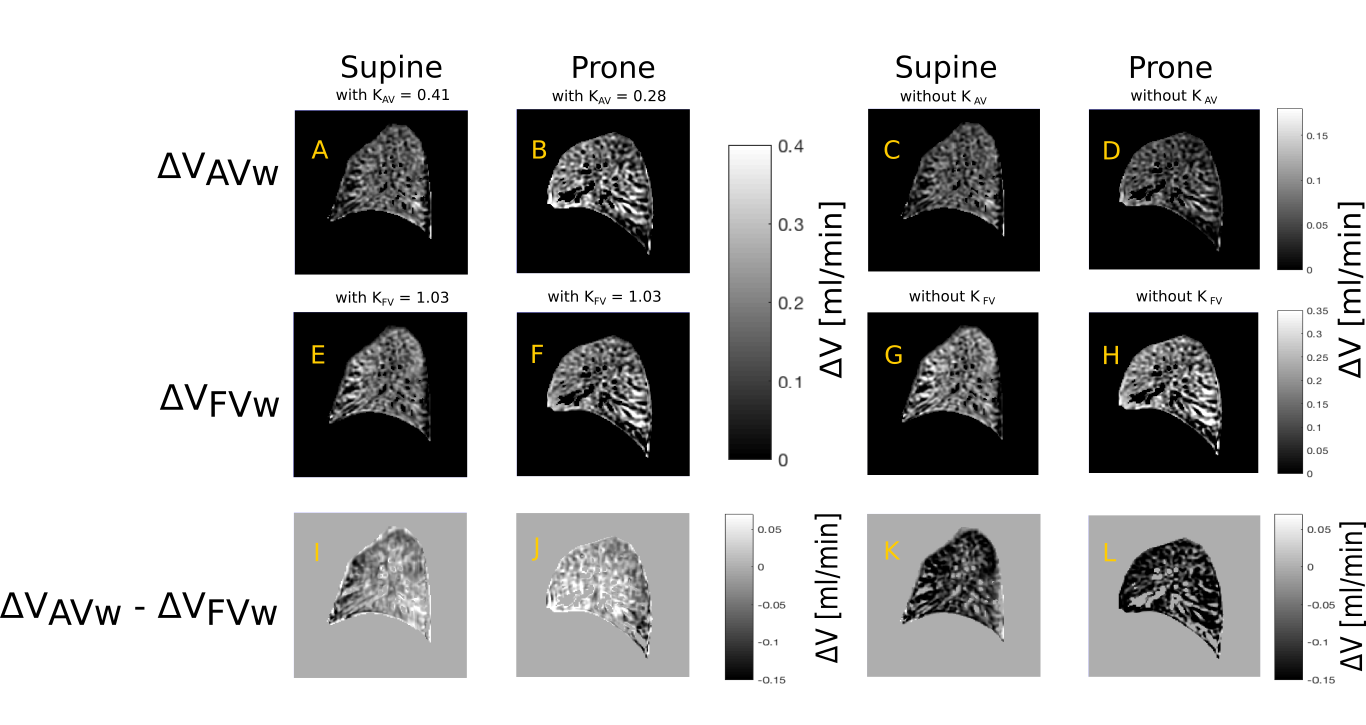
This study shows the necessity for correction factors during FD quantification due to registration and provides the theory. Using correction factors a good agreement between global ventilation values calculated with FV and AV method is achieved. Considering that the obtained constant KAV values range from 0.25 to 0.5 and KFV values range from 1.03 to 1.2, this correction cannot be neglected (see also figure 3).
Unlike FD, AV includes a T2* correction. Therefore, T2* effects, especially in dependent regions of lungs7, can explain the minor global differences and major regional differences between both methods.
The higher global ventilation values in prone position can be explained by increased lung volume in comparison with supine position (11%), which is in agreement with reported results8.
Although only a single sagittal slice acquisition was carried out in this study, the results are expected to be representative for the whole lung and are in concordance with previous FV results3.
Conclusion
Using the proposed correction factors, a
fully quantitative corrected measurement of ventilation in free breathing is possible
with FV and AV. Regional differences in dependent regions of the lung suggest
the relevance of T2* correction.Acknowledgements
This work was funded by the German Center for Lung Research (DZL).
References
1. Bauman G, Puderbach M, Deimling M, et al. Non-contrast-enhanced perfusion and ventilation assessment of the human lung by means of Fourier decomposition in proton MRI. Magn. Reson. Med. 2009;62:656–664.
2. Zapke M, Topf HG, Zenker M, et al. Magnetic resonance lung function--a breakthrough for lung imaging and functional assessment? A phantom study and clinical trial. Respir. Res. 2006;7:106.
3. Kjørstad Å, Corteville D, Henzler T, et al. Quantitative lung ventilation using Fourier decomposition MRI; comparison and initial study. MAGMA 2014;27:467–76.
4. Klimeš F, Voskrebenzev A, Gutberlet M, et al. Free Breathing Regional Alveolar Ventilation Quantification - comparison to Fractional Ventilation derived by Fourier Decomposition Lung MRI. Proc. Intl. Soc. Mag. Reson. Med. 25 2017;p.4899.
5. Avants B, Tustison N, Song G, et al. A reproducible evaluation of ANTs similarity metric performance in brain image registration Neuroimage 2011;54:2033–2044.
6. Voskrebenzev A, Gutberlet M, Klimeš F, et al. Feasibility of quantitative regional ventilation and perfusion mapping with phase-resolved functional lung (PREFUL) MRI in healthy volunteers and COPD, CTEPH, and CF patients. Magn. Reson. Med. 2017;0:1–9.
7. Theilmann R, Arai T, Samiee A, et al. Quantitative MRI measurement of lung density must account for the change in T2* with lung inflation. J. Magn. Reson. Imaging 2009;30:527–534.
8. Rohdin M, Petersson J, Sundblad P, et al. Effects of gravity on lung diffusing capacity and cardiac output in prone and supine humans. J. Appl. Physiol. 2003;95:3-10.
Figures