4355
Deep Learning Lung Segmentation in Paediatric Patients1Division of Radiological Physics, Department of Radiology, University Hospital Basel, Basel, Switzerland, 2Department of Biomedical Engineering, University of Basel, Basel, Switzerland, 3Division of Respiratory Medicine, Department of Pediatrics, Children's Hospital of Bern, Bern, Switzerland
Synopsis
Automatic lung segmentation of MR images is challenging; especially in the presence of pathologies. In this work, we tackle lung segmentation of 2D and 3D ultra-fast steady-state free precession MRI in cystic fibrosis patients by using deep learning based on a neural network of multi-dimensional gated recurrent units.
Introduction
Nowadays, a huge amount of MRI data is acquired daily, requiring reliable automatic methods for organ segmentation and evaluation.
Fourier decomposition (FD) MRI of the lung1–3 has recently shown promising results as in cystic fibrosis (CF), but requires manual lung segmentation to quantify pulmonary functional defects, such as relative impaired ventilation and perfusion.
Specialized pulse-sequences such as ultra-fast steady-state free precession (ufSSFP)4 and ultrashort echo time5 deliver high signal-to-noise ratio (SNR) of the lung, however, it is still a difficult task to automatize the subsequent lung segmentation due to the inhomogeneity and anisotropy of the organ (i.e., air/tissue/vessels interfaces and anterior-posterior signal gradient), and especially in the presence of pathologies.
In recent years, extraordinary progress has been made in the fields of image processing using deep learning techniques on highly parallel GPU architectures. Besides the success and popularity of convolutional neural networks, recurrent neural networks have shown that they are able to meet or even surpass the state of the art results on multiple occasions, for example with multi-dimensional gated recurrent units (MD-GRUs).6,7
The purpose of this study is to evaluate deep learning with MD-GRUs for whole-lung parenchyma segmentation of 2D and 3D ufSSFP imaging acquired in cystic fibrosis patients.
Materials and Methods
MR Data
Fifty-one children with CF (age 6-18 years) underwent lung MRI at 1.5T (MAGNETOM Aera, Siemens Healthineers) multiple times, including morphological 3D-ufSSFP4 imaging, and functional 2D-coronal ufSSFP imaging (FD-MRI)1–3 acquired at several slice planes. From these examinations, a total of 502 2D-coronal datasets and 108 3D datasets were manually segmented by one observer (3–5 min per 2D dataset manual segmentation, and 15–30 min for 3D); these datasets composed our two atlases for deep learning training. The 2D datasets were segmented by a second observer for subsequent performance comparison between human-made segmentations.
Neural Network
A neural network with the main layers consisting of MD-GRUs with an on-the-fly data augmentation technique was evaluated for voxelwise binary classification.6,7 A 2-fold cross-validation was used: each atlas was split into 2 equal folds (partitions) comprising base images and manual segmentations of 25 and 26 patients (i.e. 250 and 252 datasets for 2D, 54 and 54 for 3D). Fold 1 was used for training while fold 2 was used for testing (i.e. segmenting), and vice versa. The two independent folds of datasets were then merged and analyzed. We limited our training to 48 and 72 hours of computations (2D and 3D, respectively) on an NVIDIA Quadro P6000 GPU.
Data Analysis
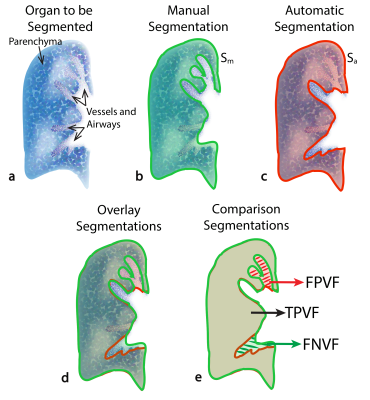
We calculated for every dataset Dice’s coefficient [ $$$\textrm{Dice}=2\cdot (\mathrm{S_{m}}\cap\mathrm{S_{a}}) \;/ \;(\mathrm{S_{m}} + \mathrm{S_{a}}) $$$ ], True Positive Volume Fraction [$$$\;\textrm{TPVF}=(\mathrm{S_{m}}\cap\mathrm{S_{a}}) \;/\; \mathrm{S_{m}}$$$ ], False Negative Volume Fraction [ $$$ \textrm{FNVF}=(\mathrm{S_{m}}-(\mathrm{S_{m}}\cap\mathrm{S_{a}})\,)\; / \;\mathrm{S_{m}}$$$ ], and False Positive Volume Fraction [ $$$\textrm{FPVF}=(\mathrm{S_{a}}-(\mathrm{S_{m}}\cap\mathrm{S_{a}})\,) \;/\; \mathrm{S_{m}} $$$ ] between the manual segmentation ($$$\mathrm{S_{m}}$$$) and the automated one ($$$\mathrm{S_{a}}$$$; see Fig. 1 for a sketch). Moreover, for a qualitative assessment, an observer visually evaluated the automatically segmented datasets, determining which were not consistent (segmentation flaws) and would require further refinement for quantitative analysis of the lung.
Results
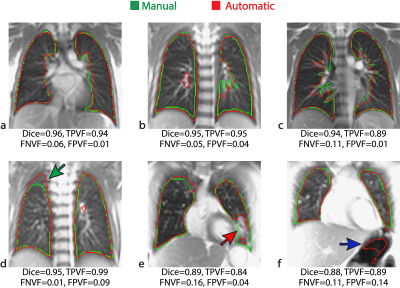
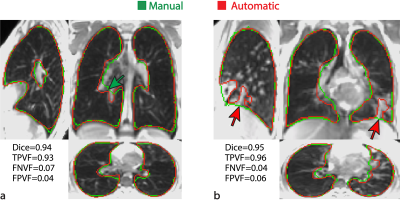
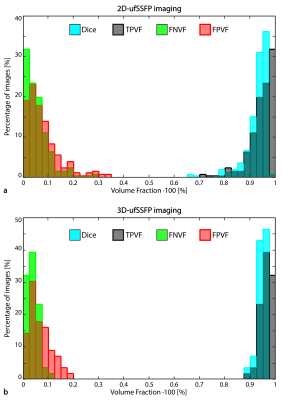
The MD-GRU segmentation took 1s per 2D image and 30s per 3D dataset. Representative manual and automatic (MD-GRU) segmentations for 2D and 3D are shown in Figures 2 and 3, respectively. Figure 4 shows the distributions of the scoring indexes. On average, in the whole CF cohort, we found for 2D datasets: Dice=0.93±0.05 (mean ± standard deviation), TPVF=0.94±0.05, FNVF=0.06±0.06, FPVF=0.09±0.10; for 3D datasets: Dice=0.95±0.02, TPVF=0.96±0.02, FNVF=0.04±0.02, FPVF=0.07±0.05. For comparison, the scoring indexes between segmentations made by two human observers were, on average, Dice=0.92±0.06, TPVF=0.97±0.04, FNVF=0.03±0.04, and FPVF=0.14±0.16 (2D case).
In general, for both 2D and 3D datasets, qualitatively 85% of the MD-GRUs segmentations appeared consistent, and 15% would require further manual refinement (cf. Fig. 2 and 3) due to invasion of lung boundaries (2D: chest 5%, bowel 2%; 3D: chest 2%, and bowel 2%), or the disease (e.g. atelectasis, mucus) was partially not included (2D: 7%; 3D: 11%).
Discussion and Conclusion
In this preliminary work, deep learning with MD-GRUs shows competitive accuracy (scoring indexes) compared to other lung segmentations approaches.8,9 The MD-GRU-based segmentation of the ufSSFP datasets acquired in CF patients was consistent in 85% of the cases on average, thus reducing the required manual work and increasing the feasibility of routine whole-lung quantitative assessment with MRI.
Additional efforts are currently underway to improve the accuracy of the segmentations using model uncertainties to automatically identify cases where the segmentation did not work as expected. The application of deep learning for pulmonary MR imaging will be further extended to automatically detect and quantify functional and morphological abnormalities (e.g. mucus, atelectasis, emphysema, fibrosis, and lesions).
Acknowledgements
This work was supported by the Swiss National Science Foundation (SNF grant No. 320030_149576) and the MIAC Foundation (Basel, Switzerland).References
1. Bauman G, Pusterla O, Bieri O. Ultra-fast Steady-State Free Precession Pulse Sequence for Fourier Decomposition Pulmonary MRI. Magn. Reson. Med. 2015:75:1647-53.
2. Bauman G, Bieri O. Matrix pencil decomposition of time-resolved proton MRI for robust and improved assessment of pulmonary ventilation and perfusion. Magn. Reson. Med. 2017;77:336–342.
3. Nyilas S, Bauman G, Sommer G, et al. Novel Magnetic Resonance Technique for Functional Imaging Of Cystic Fibrosis Lung Disease. Eur. Respir. J. 2017 [Article in Press].
4. Bieri O. Ultra-fast steady state free precession and its application to in vivo 1H morphological and functional lung imaging at 1.5 tesla. Magn. Reson. Med. 2013;70:657–663.
5. Johnson KM, Fain SB, Schiebler ML, Nagle S. Optimized 3D Ultrashort Echo Time Pulmonary MRI. Magn. Reson. Med. 2013;70:1241–1250.
6. Andermatt S, Pezold S, Cattin P. Multi-dimensional Gated Recurrent Units for the Segmentation of Biomedical 3D-Data BT - Deep Learning and Data Labeling for Medical Applications: First International Workshop, LABELS 2016, and Second International Workshop, DLMIA 2016, Held in Conjunction with MICCAI 2016, Athens, Greece, October 21, 2016, Proceedings. In: Carneiro G, Mateus D, Peter L, et al., editors. Cham: Springer International Publishing; 2016. pp. 142–151.
7. Andermatt S, Pezold S, Cattin P. Automated Segmentation of Multiple Sclerosis Lesions using Multi-Dimensional Gated Recurrent Units. In: International Workshop on Brainlesion: Glioma, Multiple Sclerosis, Stroke and Traumatic Brain Injuries. Springer, 2017 [Article in Press].
8. Tustison NJ, Qing K, Wang C, Altes TA, Mugler JP. Atlas-based estimation of lung and lobar anatomy in proton MRI. Magn. Reson. Med. 2015.
9. Kohlmann P, Strehlow J, Jobst B, Krass S, Kuhnigk JM, Anjorin A, Sedlaczek O, Ley S, Kauczor HU, Wielpütz MO. Automatic lung segmentation method for MRI-based lung perfusion studies of patients with chronic obstructive pulmonary disease. Int. J. Comput. Assist. Radiol. Surg. 2015;10:403–417.
Figures


Figure 3. 3D-ufSSFP morphological images, manual (green) and automatic (red) segmentations of two CF patients. Scoring indexes for these patients are indicated in the figure. For the first patient [(a), 15yo male], the automatic segmentation was consistent and even excelled the manual one (e.g. green arrow on the coronal view). In the second patient [(b), 12yo female], consolidations of mucus (e.g. red arrows) were not completely included by the automatic method.
