4351
A new diagnostic method for Pneumothorax:3D-UTE MRI1Radiology Department, Beijing Chaoyang Hospital, Beijing, China, 2GE Healthcare, Beijing, China, 3Beijing Chaoyang Hospital, Beijing, China
Synopsis
Radiation may has great impact on teenagers who are the high risk population for pneumothorax. Compared to X-ray and CT, MRI is a imaging modality without radiation. The purpose of this study is to examine the feasibility of using UTE MRI to diagnose the pneumothorax.
Purpose
Pneumothorax refers to the presence of air or gases in the pleural cavity. The term spontaneous pneumothorax was proposed by Kjaergaard in 19321. Primary spontaneous pneumothorax (PSP) is a global problem and the peak of PSP incidence is observed among young individuals between the ages of 15 and 343. The diagnosis of pneumothorax is established by demonstrating the outer margin of the visceral pleura (and lung), known as the pleural line, separated from the parietal pleura (and chest wall) through the examination of X-ray or CT. In the patients with a small pneumothorax which could not be detected by X-ray, multidetector CT (MDCT) has been found to be highly effective in measuring the volume of pneumothoraces4,5. However, both X-ray and CT has radiation, which can cause damage of the human body, especially sensitive organs such as crystalline lens, thyroid, mammary gland, ovaries and gonad. Thus, it may has great impact on teenagers who are the high risk population for pneumothorax. Recently, a novel ultra-short TE (UTE) MRI technique was proposed to have great improvement in lung imaging6. Compared to X-ray and CT, MRI is a imaging modality without radiation. The purpose of this study is to investigate the diagnostic value of the novel UTE technique on pneumothorax.Methods
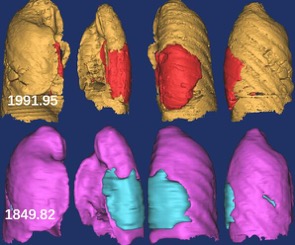
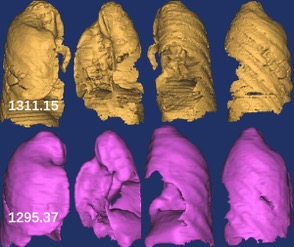
In this study, 16 patients in Beijing Chaoyang Hospital diagnosed with pneumothorax were prospectively enrolled. Once pneumothorax patients make a definite diagnosis by CT, they are immediately let to do a UTE MR examination. All UTE images were acquired on a 3T GE Discovery MR750 scanner with the following parameters: prescribed field of view (FOV)=32 × 32 × 32 cm3, flip angle=4°,1.25 mm isotropic resolution, sampling bandwidth=±250 kHz, readout duration=1 ms. After acquisition, both CT and MR images were reconstructed in 2D sagittal plane, coronal plane images and 3D rendered volume. The volume of pleural cavity and air in the pleural cavity was measured on Mimics 17.0. The ratio of air in pleural cavity to the pleural cavity is figure out. The volume of pleural cavity(A) and air in the pleural cavity(B) were measured based on CT and MR images, respectively. And the ratio of B to A were figured out.Results
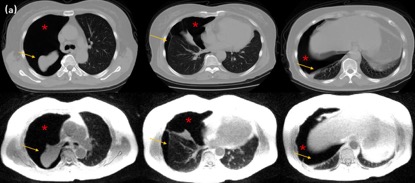
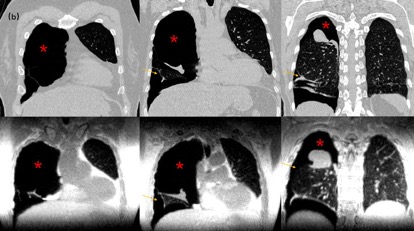
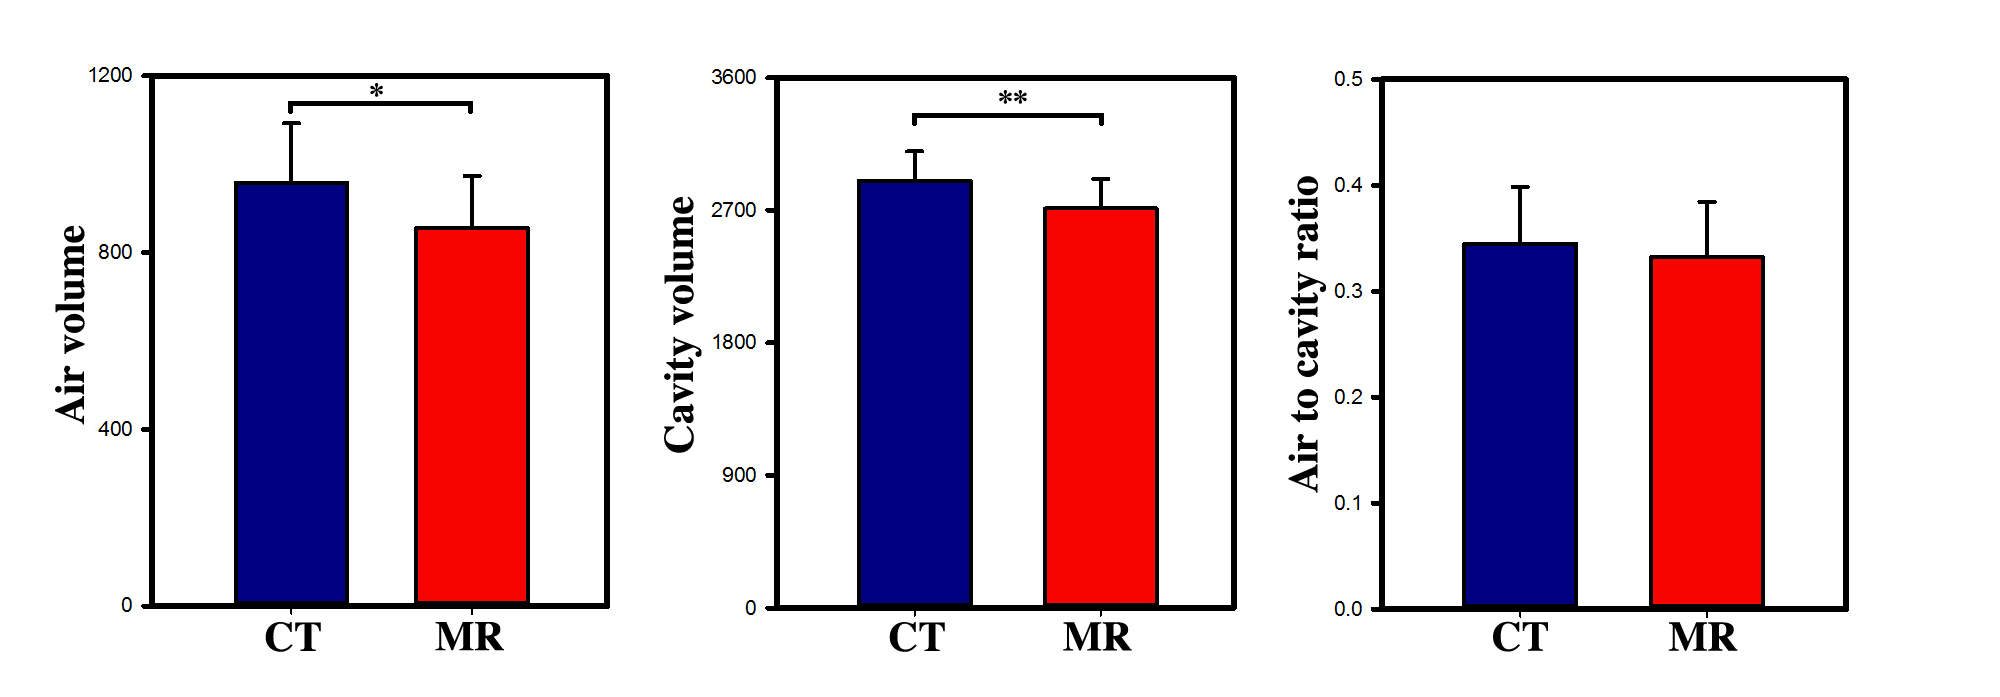
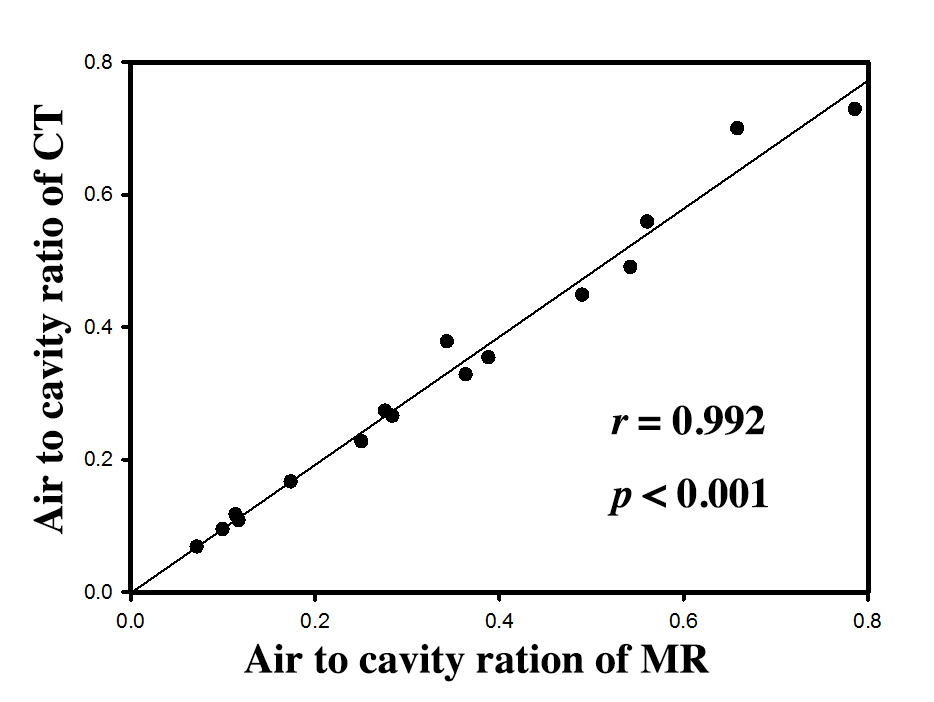
Reconstructed CT and MR images are shown in Fig. 1, where the arrows pointed the air in pleural cavity. The pleural line and the air in pleural cavity are clearly detected in both of CT and MR images. The air shows the low signal intensity and the pleural line shows the linear high signal intensity as compared to the normal lung tissues in MR images. In the CT images the air is the low density areas and the pleural line is the higher density line. The volume of pleural cavity(A), the volume of air in the pleural cavity(B) and the ratio of B to A for CT and MRI images are shown in Fig. 2. The results of paired t test are shown in Fig. 3. It is seen that both A and B showed statistically significant difference between CT and MR in the same patient. There is not significantly different between the ratio of B to A.Discussion and Conclusion
In this feasibility study, the use of UTE MRI in pneumothorax was investigated. Similar to CT, the UTE MRI can offer sufficient contrast between the air in pleural cavity and surrounding normal lung tissues. However, there are significant differences on the volume measurement between CT and UTE MRI. It may be caused by different acquisition phases during a breathing cycle for these two imaging modalities. CT was scanned on the end of inspiration, and UTE-MRI was acquired on the end of expiration. In clinical work, the ratio of lung collapse is commonly used to reflect the severity of pneumothorax. There were no significant differences between ratios between these two imaging methods. Thus, the ratios obtained by the two scanning methods can both reflect the severity of pneumothorax precisely. In conclusion, the UTE MRI shows great potential in the diagnosis of pneumothorax.Acknowledgements
The authors acknowledge research support from GE Healthcare.References
[1] Kjægaard H. Spontaneous pneumothorax in the apparently healthy. Acta Med Scand. 1932;43(Suppl):1–159;
[2] Ayed A, Al-Din HJ. The results of thoracoscopic surgery for primary spontaneous pmeumothorax. Chest. 2000;118:235–238;
[3] Tschopp JM, Bintcliffe O, Astoul P, Canalis E, Driesen P, Janssen J, Krasnik M, Maskell M, Van Schil P, Tonia T, Waller DA, Marguette CH, Cardillo G. ERS task force statement: diagnosis and treatment of primary spontaneous pneumothorax. Eur Respir J. 2015;46:321–335;
[4] Cai W, de Moya M. Use of multidetector computed tomography to guide management of pneumothorax. Curr Opin Pulm Med. 2013 Jul. 19 (4):387-93;
[5] Do S, Salvaggio K, Gupta S, Kalra M, Ali NU, Pien H. Automated quantification of pneumothorax in CT. Comput Math Methods Med. 2012. 2012:736320;
[6] Johnson K M, Fain S B, Schiebler M L, et al. Optimized 3D ultrashort echo time pulmonary MRI[J]. Magnetic resonance in medicine, 2013, 70(5): 1241-1250.
Figures