4347
Quantification of Pulmonary Perfusion in Idiopathic Pulmonary Fibrosis: Preliminary Results1Medical Physics, University of Wisconsin - Madison, Madison, WI, United States, 2Electrical and Computer Engineering, Duke University, Durham, NC, United States, 3Radiology, Duke University, Durham, NC, United States
Synopsis
IPF is a pulmonary disease with no validated biomarkers in current clinical use. Here, we compared pulmonary perfusion in an IPF subject versus healthy subject using Dynamic Contrast-Enhanced MRI (DCE-MRI). A decrease in PBF, PBV and an increase in MTT was seen in IPF compared to the healthy control. High spatial correlation of perfusion defects and fibrosis is seen when compared to the morphological images, suggesting DCE-MRI may prove to be a useful technique for evaluating IPF.
Introduction
Idiopathic Pulmonary Fibrosis (IPF) is a fatal pulmonary disease that affects approximately 5 million people worldwide.1 Currently, no validated biomarkers are in clinical use for monitoring disease progression. Diagnosis is typically made with a combination of high resolution computed tomography (HRCT) and histology.
Dynamic Contrast-Enhanced MRI (DCE-MRI) has shown promise in the evaluation of perfusion in lung disease.2–5 The temporal characteristics of DCE-MRI allow for the calculation of quantitative perfusion parameters that could prove useful in diagnosing and monitoring IPF subjects. We hypothesize that pulmonary blood flow and volume (PBF and PBV respectively) will decrease, while mean transit time (MTT) will increase in fibrotic areas of the lungs relative to healthy subjects. The purpose of this ongoing study is to investigate the potential of DCE MRI to assess perfusion in patients with IPF.
Methods
In this ongoing HIPAA-complaint and IRB approved study, 11 healthy normal subjects (51.8 ± 13.9 years, 4 male, 7 female) and 10 IPF subjects (69.4 ± 6.2 years, 9 male, 1 female) were imaged at multiple time points using a 1.5T scanner (SignaHDxt, GE Healthcare, WI) and an 8 channel cardiac coil. All subjects were scanned while supine at end-expiratory breath hold. Contrast injection was performed using a relatively small dose of 0.025 mmol/kg dose of gadobenate dimeglumine (Gd-BOPTA, Multihance; Bracco Imaging SpA, Milan, Italy) at 4 mL/s followed by a 35 mL saline flush. The small dose limits patient exposure to Gd and ensures a linear relationship between signal intensity and contrast concentration in the lung parenchyma.6
CE pulmonary perfusion scans were acquired using a 3D spoiled gradient-echo sequence and an interleaved variable density sampling scheme (TE = 0.7 ms, TR = 2.17 ms, α = 30°, FOV = 40 (S/I) × 28 (A/P) × 40 (L/R) cm3, BW = ±125 kHz, parallel acceleration factor of 2×2). Reconstruction was performed using a highly constrained Cartesian reconstruction technique in combination with k-space based parallel imaging reconstruction, resulting in full chest coverage at 1 s/frame for 22 total volumes at 4.0 mm isotropic spatial resolution.7 One healthy subject and one diseased subject were selected for a preliminary qualitative comparison.
The analysis was performed using Matlab (R2015b, The MathWorks, Natick, MA). Given challenges in segmenting the perfusion datasets, consecutively acquired Ultra-Short Echo Time (UTE) images were used to semi-automatically segment the perfusion datasets. The UTE images were intensity corrected to remove coil sensitivity inhomogeneities and then segmented via 3D region growing, with automatic seed point detection.8 Finally, the UTE images and mask were registered to the perfusion datasets using rigid followed by B-spline deformable registration.9
The voxel-wise signal time courses were calculated by subtraction of and normalization to the baseline mask signal. A volume of interest was then manually selected in the pulmonary trunk and the 150 voxels with the highest intensity were averaged at each time point to produce an arterial input function (AIF). PBF, PBV, and MTT were then calculated based on indicator dilution theory using a truncated singular value decomposition deconvolution technique (threshold = 0.3).10,11
Results
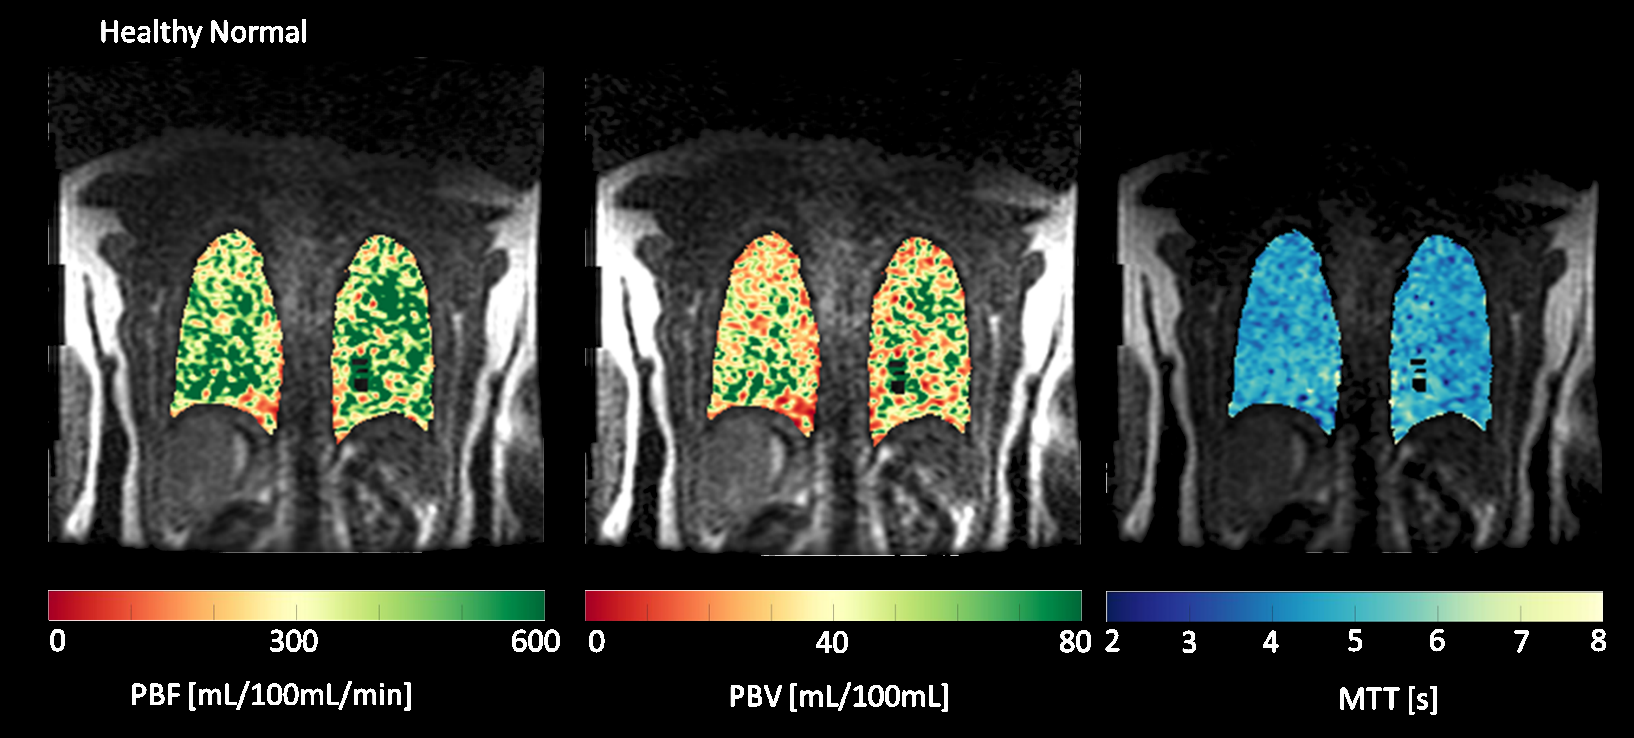
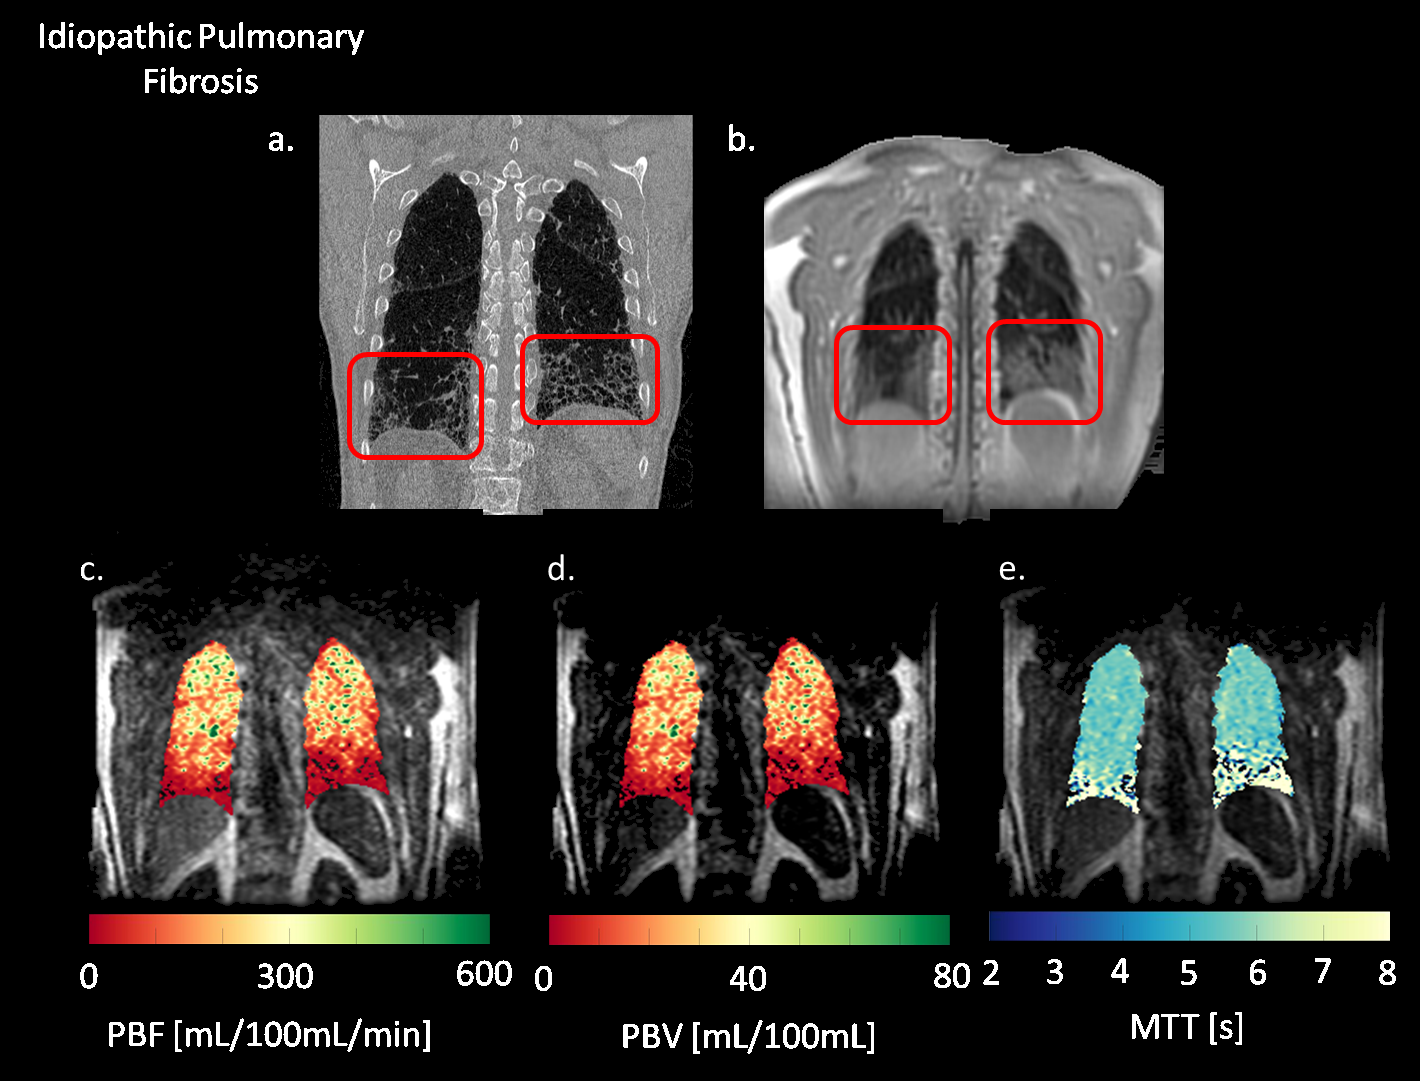
Figure 1 shows coronal slices of parametric maps showing PBF, PBV, and MTT calculated for a healthy subject. The maps show no gradients in the S\I direction and no severe perfusion defects are visible. Figure 2 shows the same parametric maps calculated for an IPF subject, along with this subjects’ morphological HRCT and UTE scans. The parametric maps now show a decline in perfusion in the superior to inferior direction, with severe defects in the inferior portions of the lungs. Summary statistics (Table 1) also show that whole lung averaged PBF and PBV are decreased, while whole lung MTT increased relative to the healthy normal. Mean values for PBF, PBV and MTT are 243.60 mL/100mL/min, 22.66 mL/100mL, and 5.8 seconds, respectively, in the healthy subject. Mean values for PBF, PBV and MTT are 62.36 mL/100mL/min, 7.71 mL/100mL, and 7.7 seconds, respectively, in the diseased subject.Discussion
Preliminary results suggest a high correlation between areas with perfusion defects and interstitial fibrosis seen on the HRCT and UTE scans. The perfusion images in Figure 2 show correlated patterns corresponding to the shape and extent of the fibrosis seen in the morphological images. Decreased PBF and PBV with increased MTT indicate that the fibrosis may be interfering with blood flow, causing longer transit times and slower flows.Conclusion
Qualitative assessment of the spatial correlations between the perfusion maps and lung fibrosis suggest the potential for DCE MRI to evaluate the extent of IPF disease. Ongoing work will refine these methods and further evaluate their validity in this cohort of IPF subjects.Acknowledgements
The authors thank our collaborators and colleagues. This work was supported by NIH/NHLBI R01 HL126771, the UW Pulmonary Imaging Center (NIH S10 OD016394), and the University of Wisconsin Science and Medicine Graduate Research Scholars Program.References
1. Meltzer, E. B. & Noble, P. W. Idiopathic pulmonary fibrosis. Orphanet J. Rare Dis. 3, 8 (2008).
2. Eichinger, M. et al. Contrast-enhanced 3D MRI of lung perfusion in children with cystic fibrosis--initial results. Eur. Radiol. 16, 2147–2152 (2006).
3. Kluge, A. et al. Pulmonary perfusion in acute pulmonary embolism: agreement of MRI and SPECT for lobar, segmental and subsegmental perfusion defects. Acta Radiol. Stockh. Swed. 1987 47, 933–940 (2006).
4. Ohno, Y. et al. Primary Pulmonary Hypertension: 3D Dynamic Perfusion MRI for Quantitative Analysis of Regional Pulmonary Perfusion. Am. J. Roentgenol. 188, 48–56 (2007).
5. Ohno, Y. et al. Quantitative assessment of regional pulmonary perfusion in the entire lung using three-dimensional ultrafast dynamic contrast-enhanced magnetic resonance imaging: Preliminary experience in 40 subjects. J. Magn. Reson. Imaging 20, 353–365 (2004).
6. Neeb, D. et al. Quantification of pulmonary blood flow (PBF): Validation of perfusion MRI and nonlinear contrast agent (CA) dose correction with H 215O positron emission tomography (PET). Magn. Reson. Med. 62, 476–487 (2009).
7. Wang, K. et al. Pulmonary perfusion MRI using interleaved variable density sampling and HighlY constrained cartesian reconstruction (HYCR): Pulmonary Perfusion Using IVD HYCR. J. Magn. Reson. Imaging 38, 751–756 (2013).
8. Kohlmann, P. et al. Automatic lung segmentation method for MRI-based lung perfusion studies of patients with chronic obstructive pulmonary disease. Int. J. Comput. Assist. Radiol. Surg. 10, 403–417 (2015).
9. Tustison, N. J. & Avants, B. B. Explicit B-spline regularization in diffeomorphic image registration. Front. Neuroinformatics 7, (2013).
10. Meier, P. & Zierler, K. L. On the theory of the indicator-dilution method for measurement of blood flow and volume. J. Appl. Physiol. 6, 731–744 (1954).
11. Østergaard, L., Weisskoff, R. M., Chesler, D. A., Gyldensted, C. & Rosen, B. R. High resolution measurement of cerebral blood flow using intravascular tracer bolus passages. Part I: Mathematical approach and statistical analysis. Magn. Reson. Med. 36, 715–725 (1996).
Figures