4344
Lung cancer screening with MRI: characterization of nodules with different non-enhanced MRI sequences.1Radiology, University of Bonn, Bonn, Germany
Synopsis
Due to increased interest in pulmonary MRI as a radiation free alternative to CT for lung cancer screening, we analyzed MRI characteristics of pulmonary nodules with different non-enhanced sequences.
Introduction
Several studies have shown the feasibility of MRI for the detection of pulmonary nodules [1-4]. The most predictive parameters of malignancy are nodule size, growth and the presence of spicules [5-8]. For MRI, high signal on T2-weighted images, diffusion restriction, and intense enhancement [2, 9-14] are indicative for lung cancer. The aims of this study were to analyze MRI characteristics of pulmonary nodules with regards to malignancy, and to find out which MRI sequence is most suitable for nodule detection in lung cancer screening.
Materials and methods
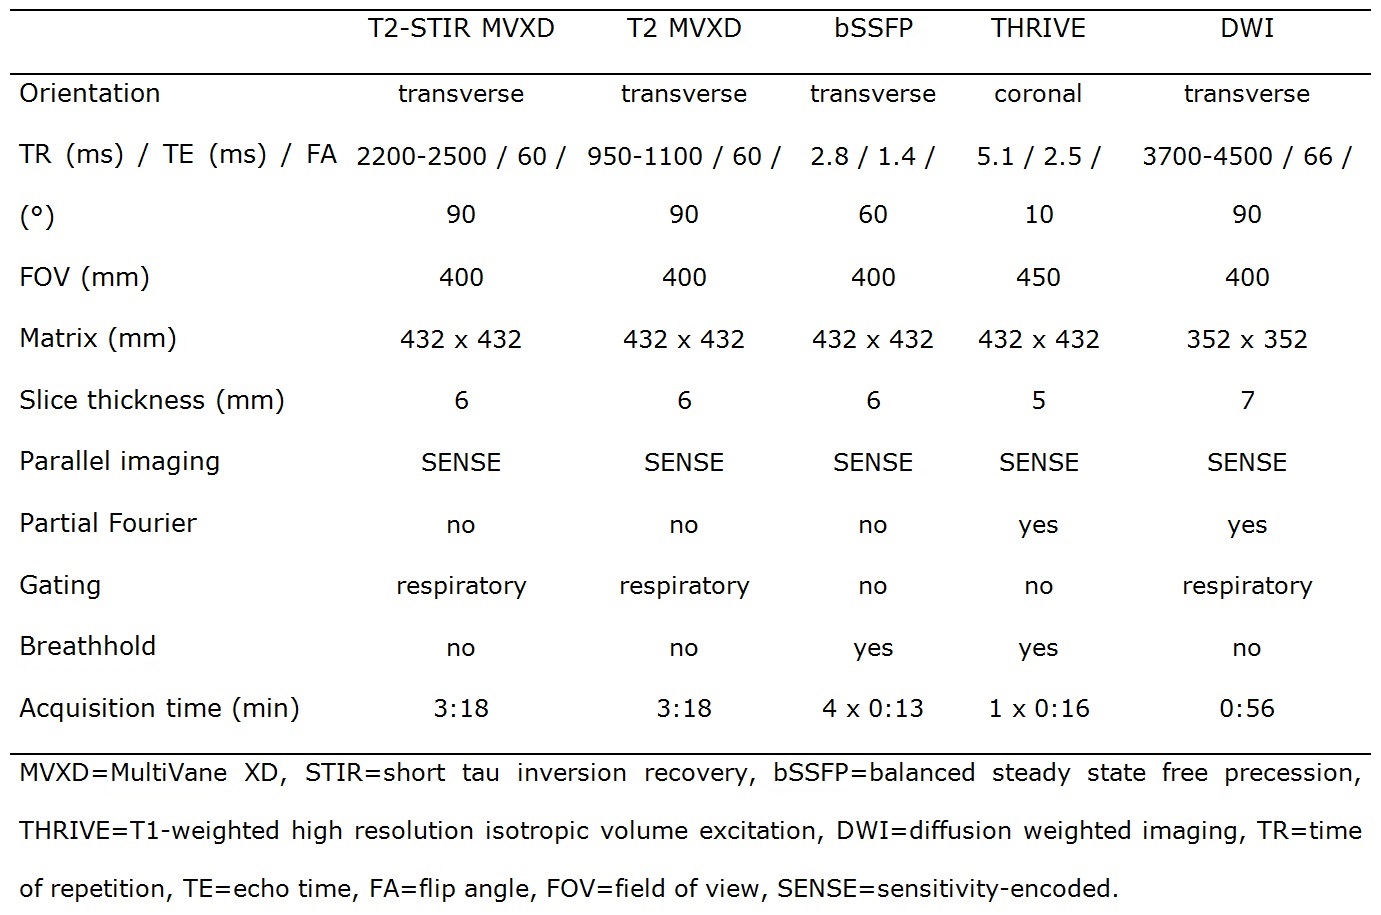
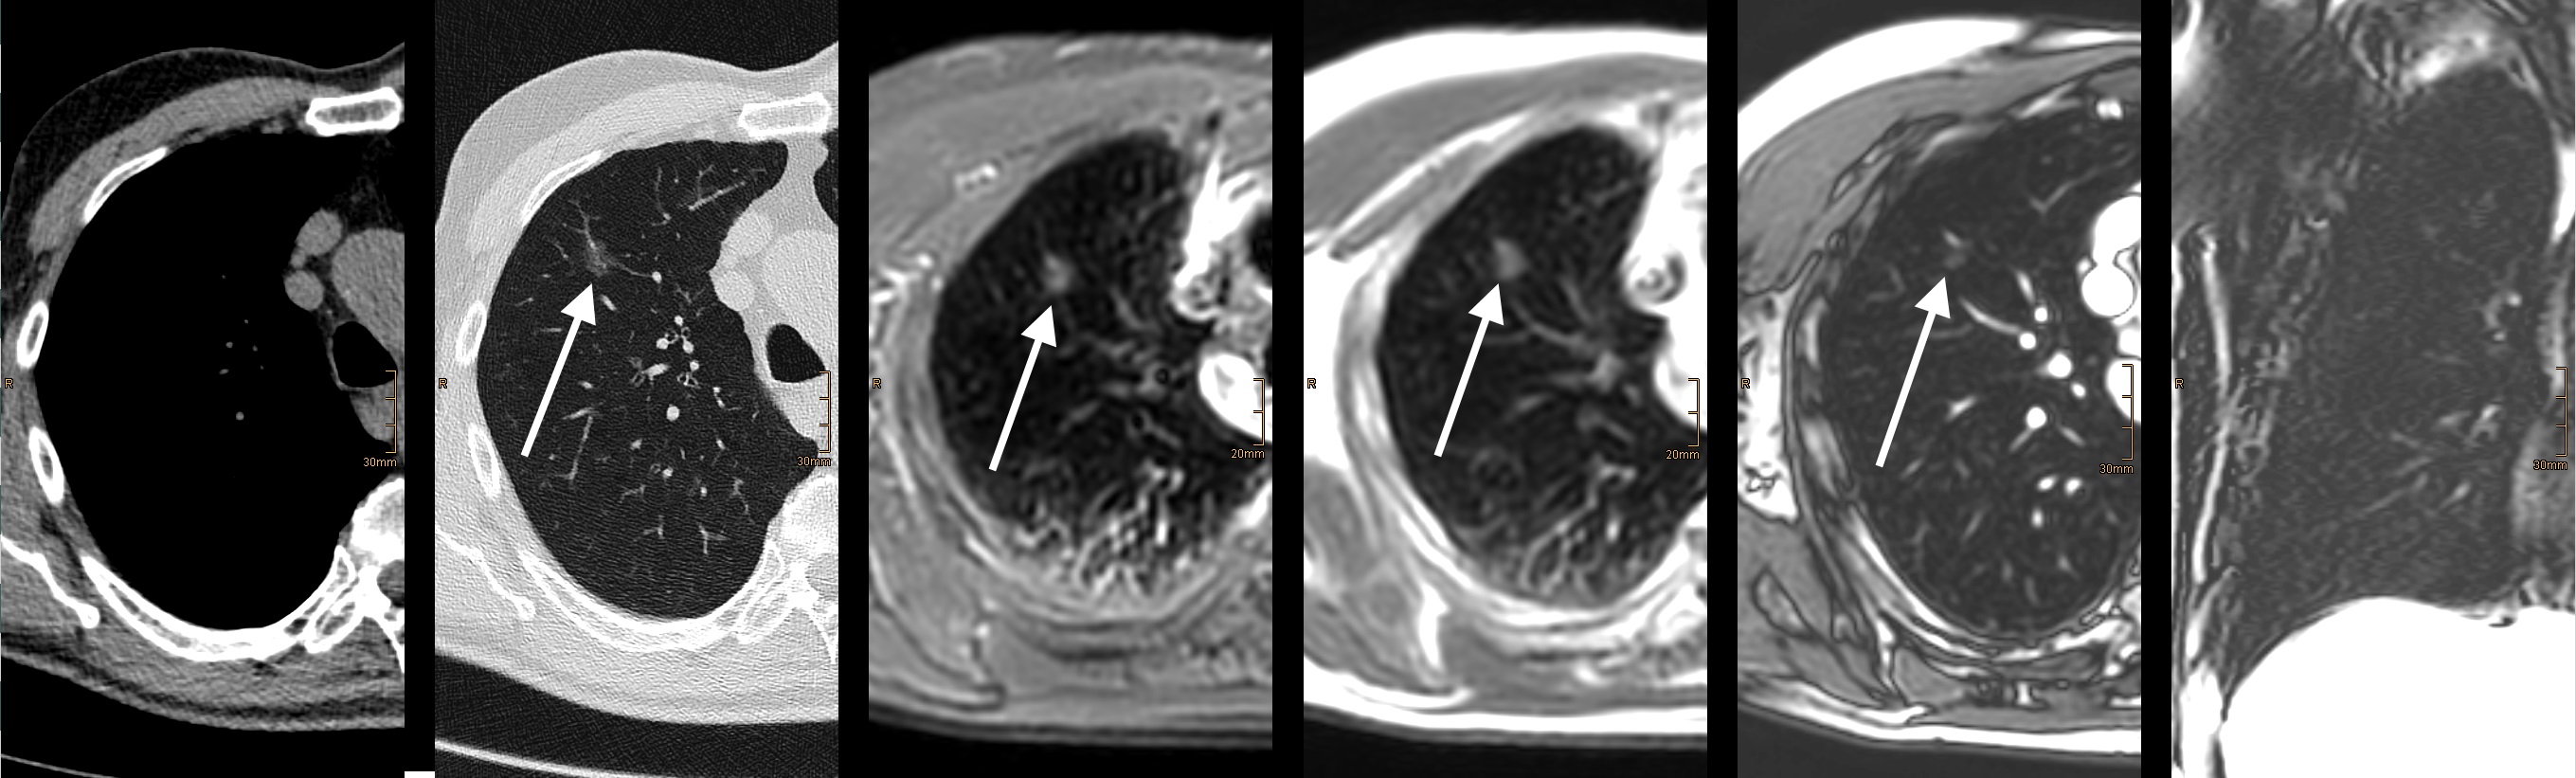
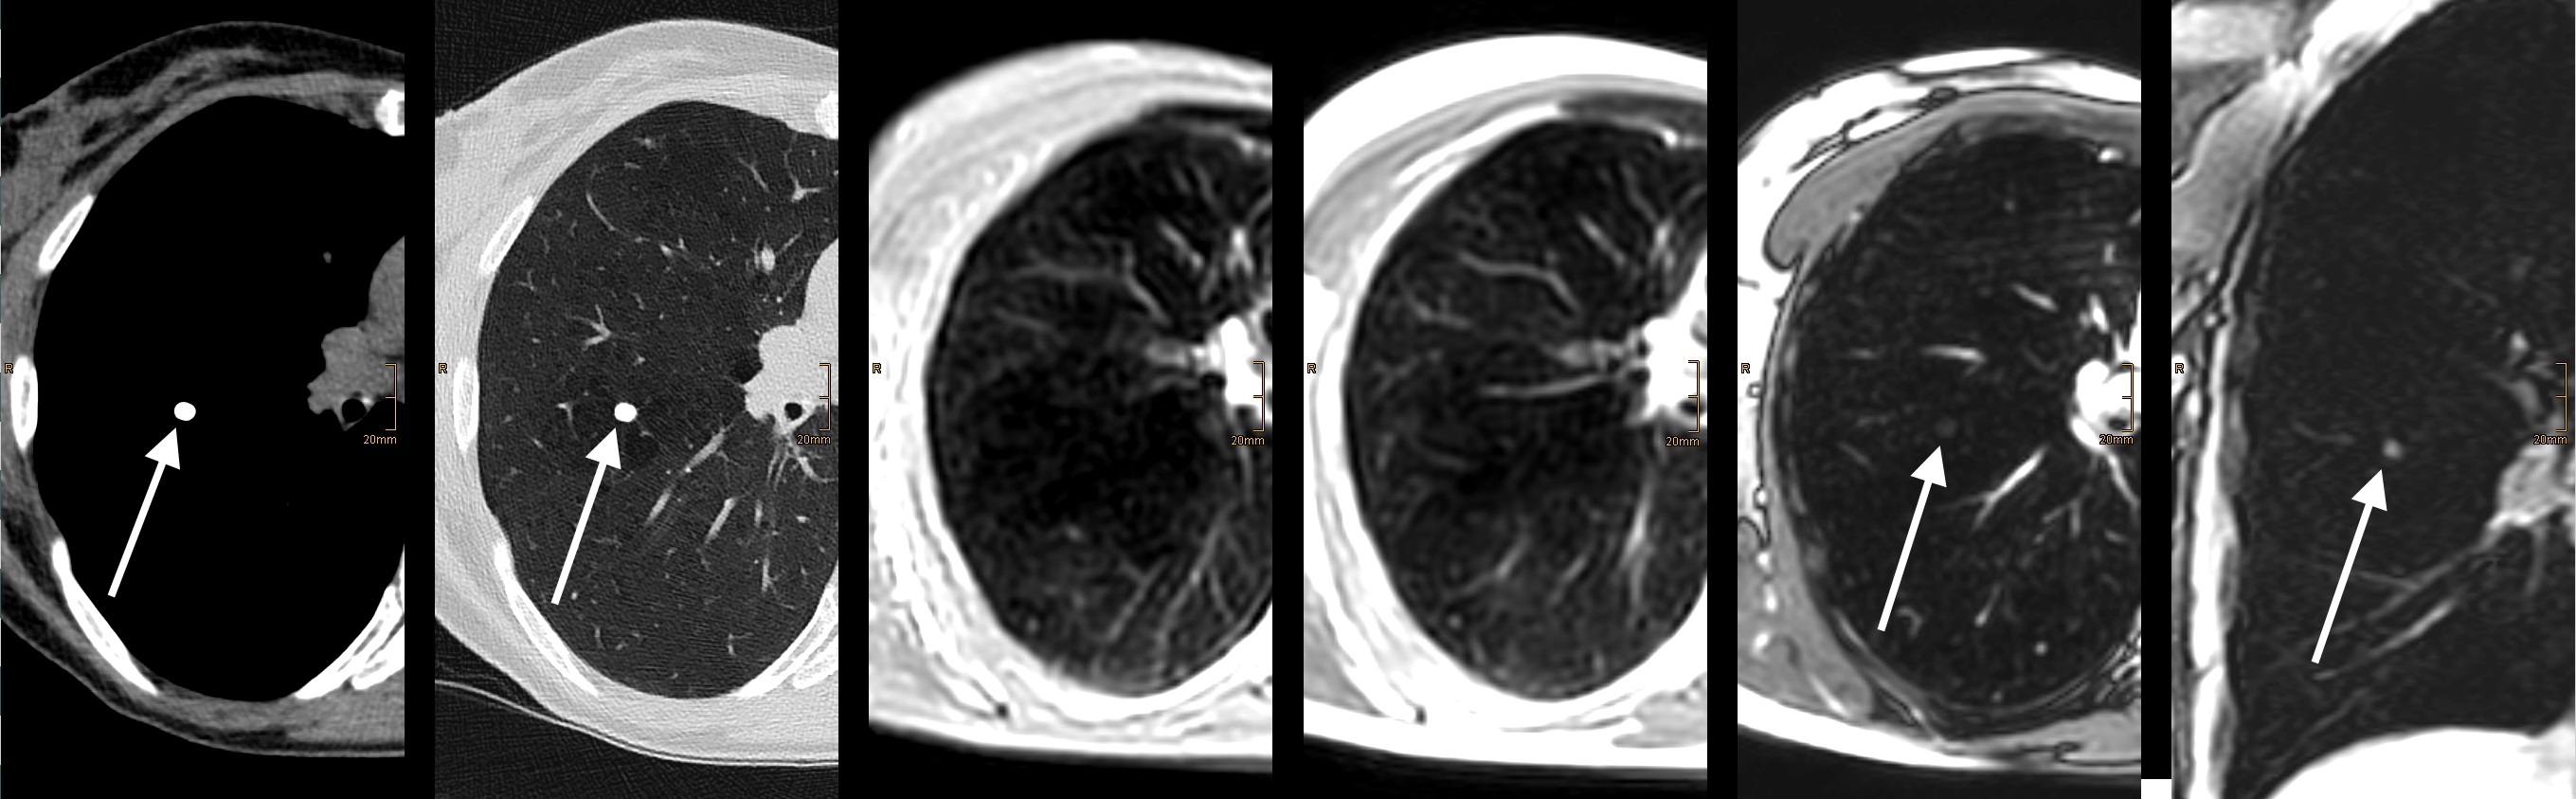
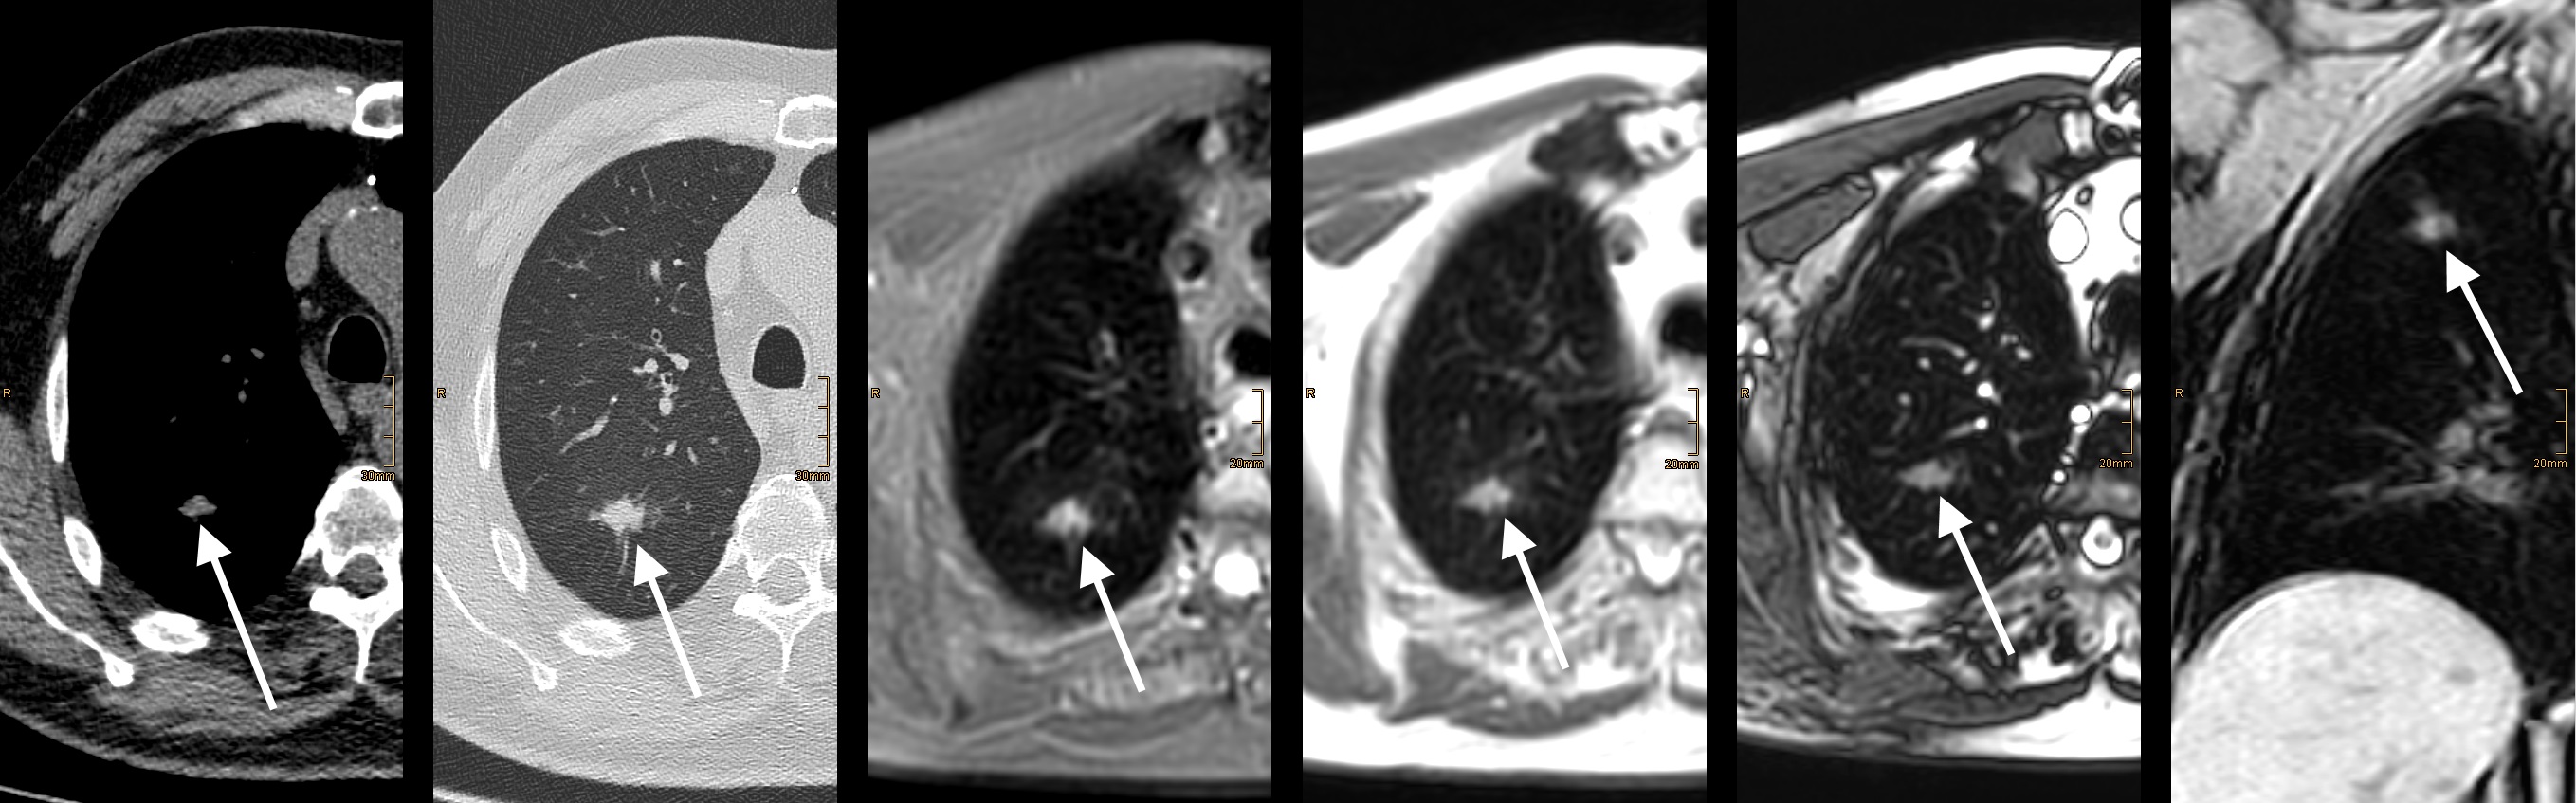
82 participants of a lung cancer screening (age 50-70 years) were included. MRI datasets of 32 subjects with nodules ≥6 mm on LDCT were anonymized and randomly presented together with datasets of 50 control subjects not showing any nodules or only nodules <4 mm on LDCT. Acquired MRI sequences were T2 short tau inversion recovery (T2-STIR), regular T2 (T2), balanced steady state free precession (bSSFP), T1-weighted high resolution isotropic volume excitation (THRIVE), and diffusion-weighted images (DWI).
Each MRI sequence was
viewed separately and prospectively.
First, the
presence of nodules was assessed. Second, in cases
of positive findings, nodule
size and nodule shape were noted. Third, ROI-based signal intensities were measured inside the lesion with a maximum possible size, and inside the lung with a predefined size to calculate lesion contrast. The ADC-value was
measured, if a lesion showed diffusion restriction. MRI findings were correlated with LDCT as reference.
Results
There were 53 different nodules ≥6 mm in 82 individuals, seven of them being false positive. Lung cancer was revealed in 8 of 32 subjects undergoing biopsy or surgery.
Mean/median size of nodules was 10.0/8.0 mm on T2-STIR, 9.8/8.0 mm on T2, 9.3/8.0 mm on bSSFP, 9.2/7.0 mm on THRIVE, and 9.5/7.5 mm on LDCT. Size measurements significantly correlated among the acquired MRI sequences (p<0.001), and for each sequence the measurements significantly correlated with LDCT (p<0.001). Malignant nodules were significantly larger than benign nodules (average size of malignant nodules 16.38 mm, average size of benign nodules 8.05 mm; p=0.001).
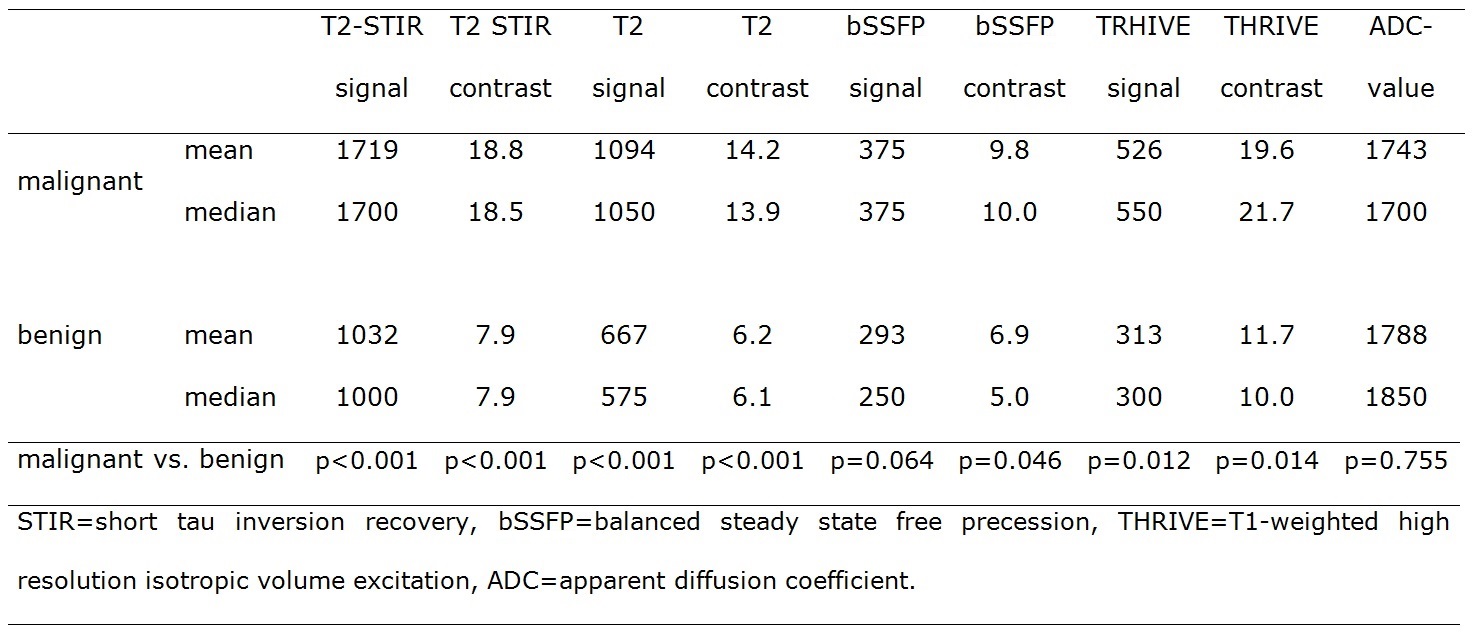
The highest average contrast ratio between malignant and benign nodules was provided by T2-STIR (2.38), followed by T2 (2.29), THRIVE (1.68), and bSSFP (1.42).
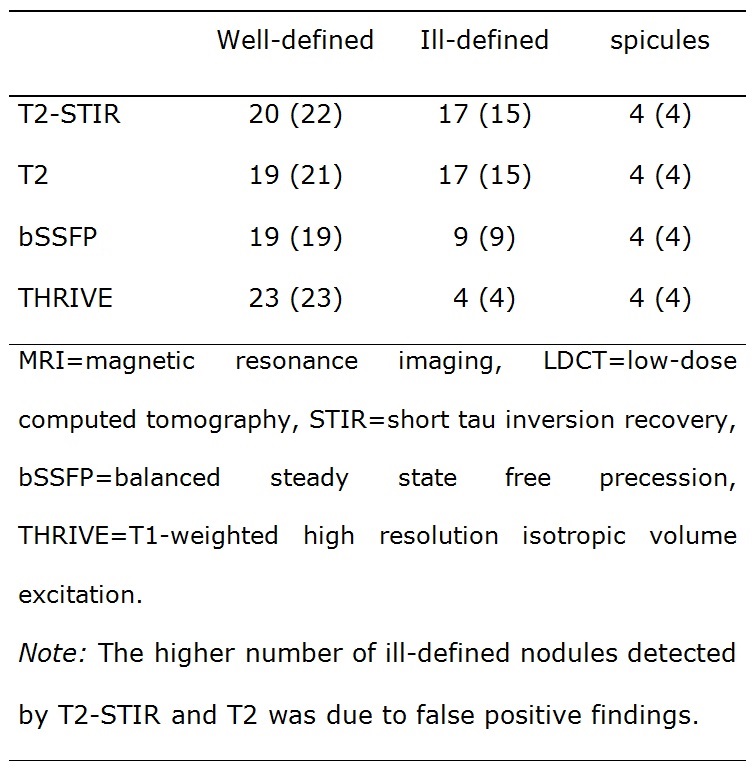
Seven of eight subsolid nodules were visible on T2-STIR and T2 with signal intensity and contrast being significantly lower compared to solid nodules (p=0.001 for signal intensity and p=0.002 for contrast on T2-STIR, p<0.001 for signal intensity and contrast on T2). Two of eight subsolid nodules were detected by bSFFP, none by THRIVE. All three calcified nodules were visible on THRIVE, and one was detected by bSSFP; T2-STIR and T2 could not detect any calcified nodules. 4 of 46 nodules (13-35 mm) showed spicules on LDCT; all of them were malignant. The presence of spicules was accurately detected by each MRI sequence.
Discussion
Consistent with other studies [1, 2, 10], malignant nodules showed higher signal intensity and contrast in our study on T2-weighted images (T2WI), bSSFP, and THRIVE. Calcified nodules were visible on THRIVE but not on T2WI, which matches the statement of two studies that calcification shortens T2 but not T1 relaxation time [15, 16]. Subsolid nodules can turn in carcinomas with lepidic growth. Based on our study results, a subsolid appearance seems to manifest in lower signal intensity on all MRI-sequences. Subsolid nodules were detected with a sensitivity of 88% in our study, which is comparable to Koyama et al. (78%) [10].
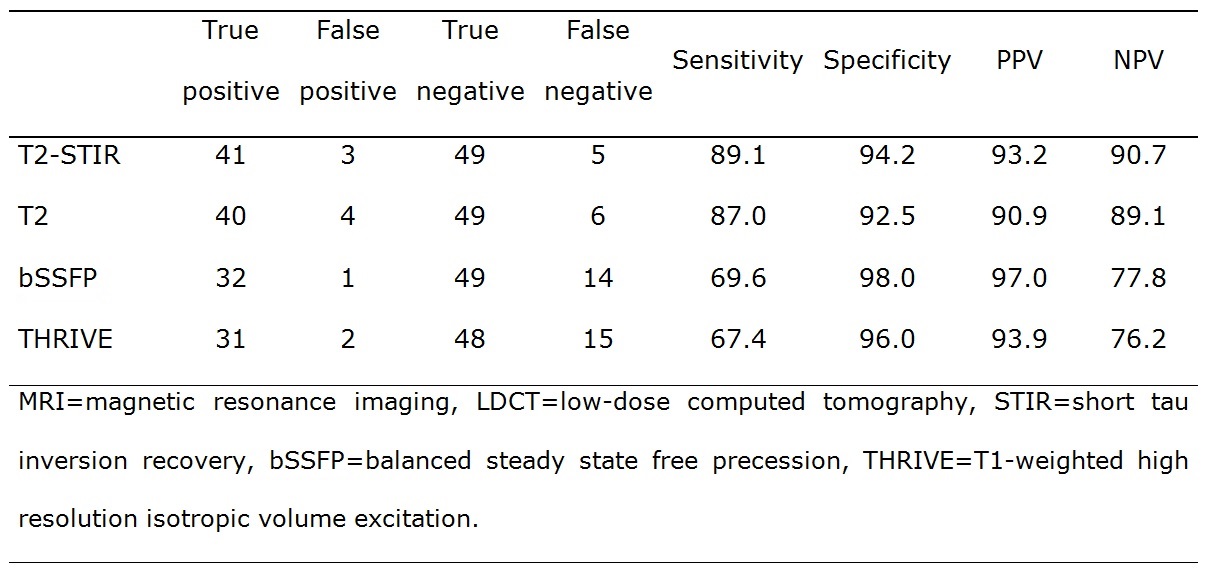
T2WI with and without fat suppression were most capable of detecting nodules in our study as well as in different other studies [2, 9, 10]. Based on our results, the T2-STIR sequence provided the highest sensitivity and specificity for nodules in total, and showed the highest contrast for malignant nodules. The advantage of the T2-STIR sequence might be explained by the fact that T1- and T2-contrasts are additive in STIR imaging, which is helpful, since many pathological lesions demonstrate an increase in both T2 and T1 [10, 17]. Even though the T2-STIR sequence was most suitable, it must be considered that MRI sequences are commonly viewed in synopsis, and that a definite diagnosis is normally made, when lesions are visible in more than one sequence.
Conclusion
Malignant nodules, as well as calcified and subsolid nodules seem to have distinctive characteristics on different MRI sequences, which could help in the assessment of malignancy. T2-weighted imaging was most suitable for the detection of pulmonary nodules ≥6 mm with a very high sensitivity and specificity.Acknowledgements
No acknowledgement found.References
- Biederer J, Ohno Y, Hatabu H, Schiebler ML, van Beek EJ, Vogel-Claussen J, Kauczor HU. Screening for lung cancer: Does MRI have a role? Eur J Radiol. 2017 Jan;86:353-360.
- Sommer G, Tremper J, Koenigkam-Santos M, Delorme S, Becker N, Biederer J, Kauczor HU, Heussel CP, Schlemmer HP, Puderbach M. Lung nodule detection in a high-risk population: comparison of magnetic resonance imaging and low-dose computed tomography. Eur J Radiol. 2014 Mar;83(3):600-5.
- Cieszanowski A, Lisowska A, Dabrowska M, Korczynski P, Zukowska M, Grudzinski IP, Pacho R, Rowinski O, Krenke R. MR imaging of pulmonary nodules: detection rate and accuracy of size estimation in comparison to computed tomography, PLoS One. 2016 Jun 3;11(6):e0156272.
- Meier-Schroers M, Homsi R, Skowasch D, Buermann J, Zipfel M, Schild HH, Thomas D. Lung cancer screening with MRI: results of the first screening round. J Cancer Res Clin Oncol. 2017 Sep 20. Epub ahead of print.
- McWilliams A, Tammemagi MC, Mayo JR, et al. Probability of cancer in pulmonary nodules detected on first screening CT. N Engl J Med 2013;369(10):910–919
- Horeweg N, van Rosmalen J, Heuvelmans MA, van der Aalst CM, Vliegenthart R, Scholten ET, ten Haaf K, Nackaerts K, Lammers JW, Weenink C, Groen HJ, van Ooijen P, de Jong PA, de Bock GH, Mali W, de Koning HJ, Oudkerk M. Lung cancer probability in patients with CT-detected pulmonary nodules: a prespecified analysis of data from the NELSON trial of low-dose CT screening. Lancet Oncol. 2014 Nov;15(12):1332-41.
- MacMahon H, Naidich DP, Goo JM, Lee KS, Leung ANC, Mayo JR, Mehta AC, Ohno Y, Powell CA, Prokop M, Rubin GD, Schaefer-Prokop CM, Travis WD, Van Schil PE, Bankier AA. Guidelines for Management of Incidental Pulmonary Nodules Detected on CT Images: From the Fleischner Society 2017. Radiology. 2017 Jul;284(1):228-243.
- American College of Radiology. Lung CT Screening Reporting and Data System (Lung-RADS). Available at: http://www.acr.org/Quality-Safety/Resources/LungRADS. Accessed March 31st, 2017.
- Biederer J, Schoene A, Freitag S, Reuter M, Heller M. Simulated pulmonary nodules implanted in a dedicated porcine chest phantom: sensitivity of MR imaging for detection. Radiology 2003;227(2):475–83.
- Koyama H, Ohno Y, Kono A, Takenaka D, Maniwa Y, Nishimura Y, Ohbayashi C, Sugimura K. Quantitative and qualitative assessment of non-contrast-enhanced pulmonary MR imaging for management of pulmonary nodules in 161 subjects. Eur. Radiol. 2008;18:2120–2131.
- Chen L, Zhang J, Bao J, et al. Meta-analysis of diffusion-weighted MRI in the differential diagnosis of lung lesions. J Magn Reson Imaging. 2013 Jun;37(6):1351-8.
- Deng Y, Li X, Lei Y, Liang C, Liu Z. Use of diffusion-weighted magnetic resonance imaging to distinguish between lung cancer and focal inflammatory lesions: a comparison of intravoxel incoherent motion derived parameters and apparent diffusion coefficient. Acta Radiol. 2016 Nov;57(11):1310-1317.
- Kono R, Fujimoto K, Terasaki H, Müller NL, Kato S, Sadohara J, Hayabuchi N, Takamori S. Dynamic MRI of solitary pulmonary nodules: comparison of enhancement patterns of malignant and benign small peripheral lung lesions. AJR Am J Roentgenol. 2007 Jan;188(1):26-36.
- Alper F, Kurt AT, Aydin Y, Ozgokce M, Akgun M. The role of dynamic magnetic resonance imaging in the evaluation of pulmonary nodules and masses. Med Princ Pract. 2013;22(1):80-6.
- Yi CA, Jeon TY, Lee KS, Lee JH, Seo JB, Kim YK, Chung MJ. 3-T MRI: usefulness for evaluating primary lung cancer and small nodules in lobes not containing primary tumors. AJR Am J Roentgenol. 2007 Aug;189(2):386-92.
- Tenner MS, Spiller M, Koenig SH, et al. Calcification can shorten T2, but not T1, at magnetic resonance imaging fields: results of a relaxometry study of calcified human meningiomas. Invest Radiol 1995; 30:345–353
- Krinsky G, Rofsky NM, Weinreb JC. Nonspecificity of short inversion time inversion recovery (STIR) as a technique of fat suppression: pitfalls in image interpretation. Am J Roentgenol 1996; 166:523-526.
Figures