4337
Whole-Tumor Histogram Analysis of Multiparametric MRI for Subtype Classification of Breast Cancer1Department of Radiology, Fudan University Shanghai Cancer Center, Shanghai, China, 2Department of Radiology, Longhua Hospital, Shanghai University of Traditional Chinese Medicine, Shanghai, China, 3MR Application Predevelopment, Siemens Healthcare, Erlangen, Germany, 4Application Development, Siemens Shenzhen Magnetic Resonance, Shenzhen, China
Synopsis
Recently, several studies have shown the value of Magnetic Resonance Imaging (MRI) radiomics in non-invasive lesion subtype classification. In this study, we proposed the use of histogram texture features of multiparametric maps to differentiate subtypes of breast cancer. 34 different whole-tumor histogram features were analyzed. Classification was performed between ER-positive and Triple-negative groups resulted in AUROC of 0.94, while classification between ER-positive and HER2-positive groups, and classification between HER2-positive and Triple-negative yielded AUROC of 0.79, and 0.86, respectively.
Introduction
Breast cancer subtypes distinguished by immunohistochemistry are routinely employed to select patient-tailored therapy and predict treatment outcome. Recently, it was suggested that MR texture analysis of breast cancer can potentially provide additional information for the classification of immunohistochemical subtypes of breast cancer1,2. However, there’s little data about the multiparametric features of texture analysis in the subtype classification of breast cancer. The purpose of this study was to evaluate whole-tumor histogram features from the ADC and DCE parametric maps in the correlation of breast cancer subtypes.Methods
This IRB-approved, HIPAA-compliant retrospective study included 54 patients (mean age, 51 years; age range, 24-83 years) who underwent DCE and DWI breast MRI before surgery and were diagnosed with pathologically-confirmed breast invasive ductal carcinoma (IDC). Tumors were characterized by immunohistochemical genotype into 3 categories based on receptor expression: estrogen receptor (ER) positive/human epidermal growth factor receptor 2 (HER2) negative (n=26), HER2 positive (n=17), and triple negative (TN) (n=11). Images were obtained on a 3T MRI scanner (MAGNETOM Skyra; Siemens Healthcare, Erlangen, Germany). Single-shot EPI DWI with b-values of 0, 500 and 1000 s/mm2 was performed. The DCE-MRI consisted of 5 measurements of a 3D FLASH sequence during which 0.05 mmol/kg of Gd-BOPTA (Multihance) was administered at a rate of 2ml/s after a pre-contrast scan. The following parameter maps were automatically generated: ADC from DWI; Wash-in (WI) and Wash-out (WO) from DCE-MRI. The analysis was performed with the MR Multiparametric Analysis prototype software (Siemens Healthcare, Erlangen, Germany). The histogram features included: Mean, Standard deviation (Std), Median, Percentiles (5th, 95th), Skewness, Excess Kurtosis, Difference Entropy, Difference Variance, Contrast and Entropy. Mann Whitney U tests or Student’s t-test were performed using SPSS (v22.0; IBM Corporation, New York) for pairwise comparisons. Receiver operating characteristic (ROC) curve of those significant texture parameters were plotted, and the area under the curve (AUC) of the ROC was calculated.Results
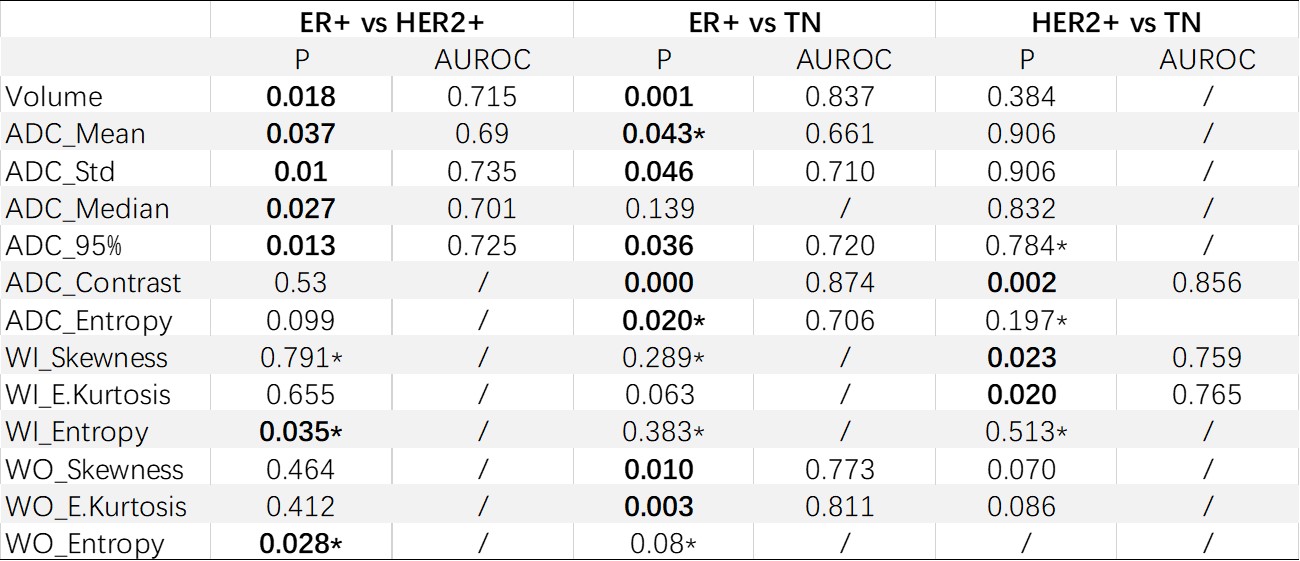
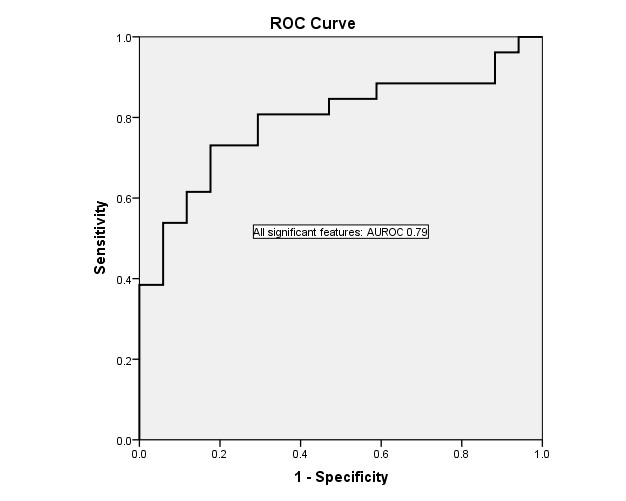
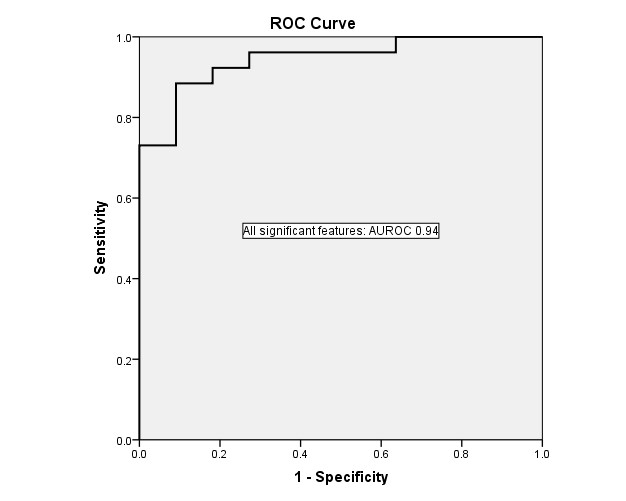
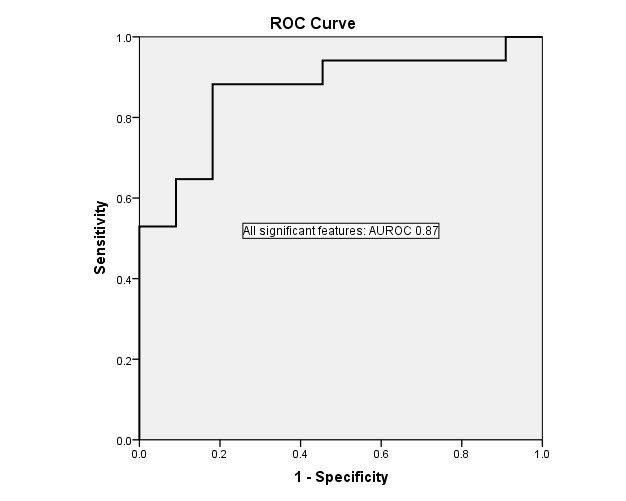
The classification for both pairwise datasets was presented in Table 1. Volume, ADC_Mean, ADC_median, ADC_Std, ADC_Median and ADC_95th parameters demonstrated significant correlations between ER+ and HER2+ groups. Volume, ADC_Std, ADC_95th, ADC_contrast, WO_Skewness, WO_E.Kurtosis, WO_Entropy showed significant correlations between ER+ and TN groups, and ADC_contrast, ADC_Entropy, WO_E.Kurtosis also correlated significantly between HER2+ and TN groups. Areas under the receiver operator characteristics (ROC) curve for the classification between ER+ and HER2+ groups were 0.79 (95% CI: 0.66, 0.93) using all significant features, as shown in figure 1. The classification between ER+ and TN groups, and classification between HER2+ and TN yielded AUROC of 0.96 (95% CI: 0.83, 1.0) and 0.87 (95% CI: 0.73, 1.0), shown in Figure 2 and Figure 3, respectively.Conclusion
We analyzed quantitative texture features to differentiate among triple-negative, ER–positive, HER2-positive breast cancer at DCE and DWI MR imaging. MR multiparametric texture features yielded better results than the previously reported features1, which might be helpful for patient management in clinical practice.Acknowledgements
No acknowledgement found.References
1. Agner SC, Rosen MA, Englander S, et al. " Computerized image analysis for identifying triple-negative breast cancers and differentiating them from other molecular subtypes of breast cancer on dynamic contrast-enhanced MR images: A feasibility study." Radiology. 2014; 272(1): 92-99.
2. Waugh SA, Purdie CA, Jordan LB, et al. " Magnetic resonance imaging texture analysis classification of primary breast cancer." European Radiology. 2016;26(2): 322-330.
Figures