4336
Complementary value of End-to-end Deep Learning and Radiomics in Breast Cancer Classification on Diffusion-Weighted MRI1Division of Medical Image Computing, German Cancer Research Center, Heidelberg, Germany, 2Department of Radiology, German Cancer Research Center, Heidelberg, Germany, 3Institute of Radiology, University Hospital Erlangen, Friedrich-Alexander-Universität Erlangen-Nürnberg, Erlangen, Germany, 4Medical Physics in Radiology, German Cancer Research Center, Heidelberg, Germany, 5Radiological Practice, ATOS Clinic, Heidelberg, Germany, 6Radiology Center Mannheim, Mannheim, Germany
Synopsis
Two fundamentally different approaches have been proposed recently for the classification of breast lesions on diffusion-weighted MRI Images: “Radiomics” extracts quantitative parameters by fitting a biophysical model to the q-space signal and subsequently computes handcrafted features to feed a classifier. Convolutional neural networks on the other hand autonomously learn all processing components in an end-to-end training. To date it is unclear how the two methods compare with respect to overall performance, complementary value of features and combinability. We address these open research questions and propose a combined model that significantly outperforms the two standalone approaches.
Introduction
Mammography screening for early detection of breast lesions currently suffers from high amounts of false positive findings, which result in unnecessary and invasive biopsies. Diffusion-weighted MR imaging (dMRI) is a powerful method with short examination times and without need for contrast agents that has been shown to reduce many of these false-positive findings prior to biopsy. To this end, two fundamentally different approaches have recently been developed for the classification of lesions into malignant and benign following recent advances in the field of Medical Image Analysis1,2. One is the Radiomics model3, where biophysical models are fit to the diffusion-weighted signal to generate quantitative parameters maps, from which handcrafted features are extracted and fed into a classifier. In contrast to this model stands the deep learning approach4, where the raw images are used as input to a convolutional neural network (CNN), which autonomously learns signal exploitation, hierarchical representations and classification in an end-to-end training. To date, it is unclear how the two methods compare with respect to overall performance, redundancy of features and combinability. Therefore, this study addresses the following research questions: Is there a significant difference in performance between Radiomics and CNN? Is there a complementary value in the learned CNN representations compared to Radiomics features so as to boost the combined performance significantly?Methods
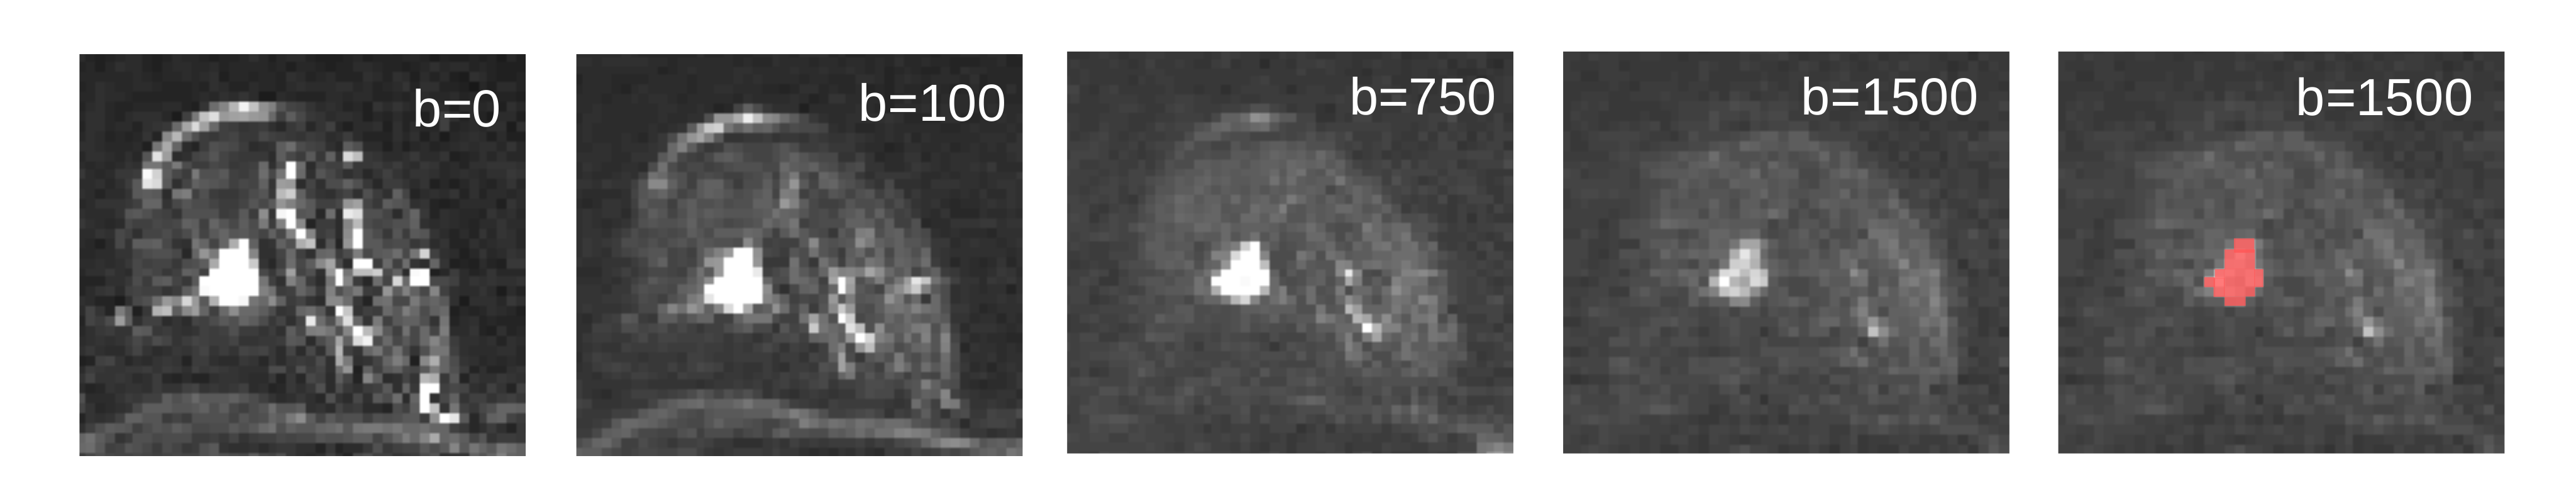
This study is performed on a combined data set of 221 patients acquired at two study sites with 1.5 T MR scanners from different vendors. Patient and imaging characteristics are described in Figure 1.
Radiomics
Figure 2 shows the feature extraction model. The resulting feature vector is fed into a random forest (number of trees = 1000) for classification. In this study, 20 random forests were each trained in a 5-fold cross validation (CV) with 30% feature- and 30% data dropout. Finally, the resulting 20 scores for each patient were averaged.
CNN
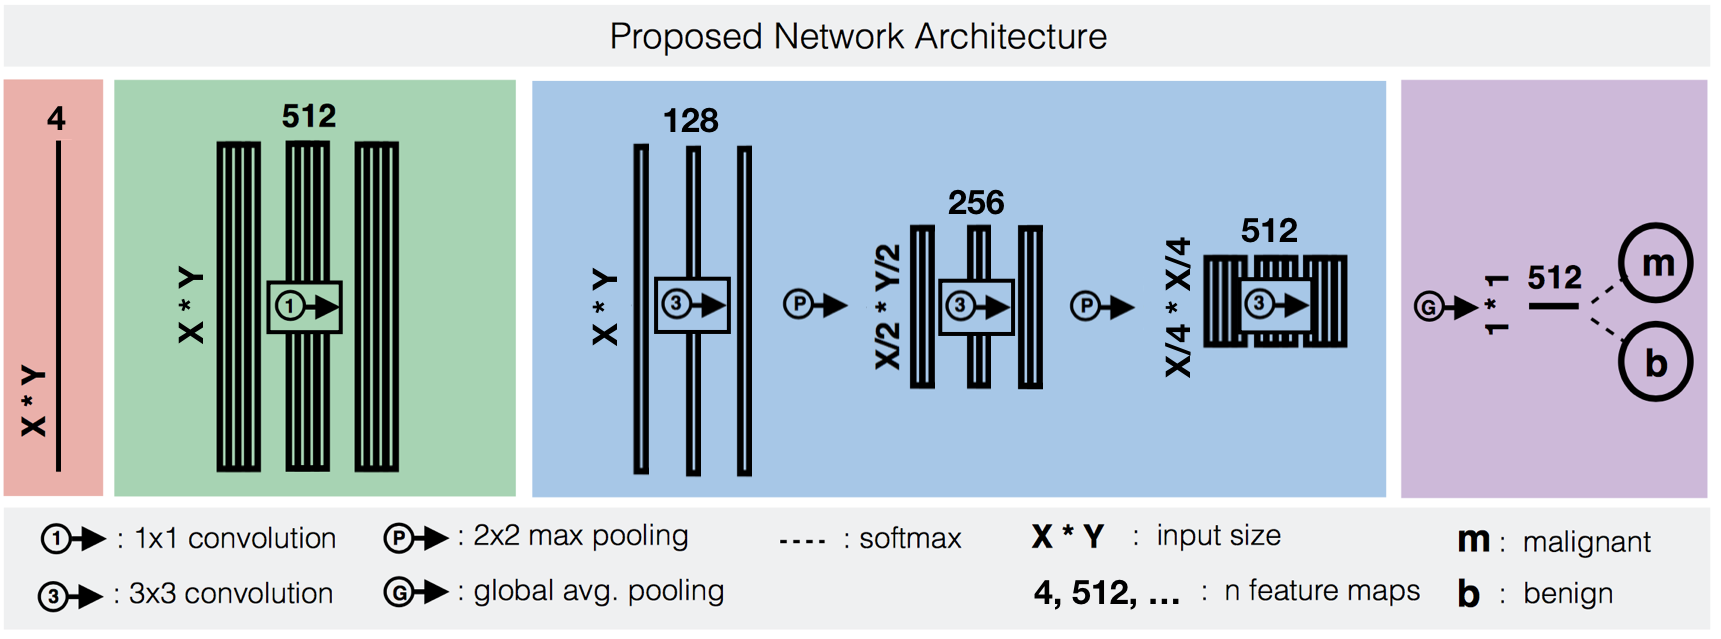
The CNN architecture is shown in Figure 3. The network was trained in a 5-fold CV with 60% training- , 20% validation- and 20% test data (splits mutually exclusive w.r.t patients). The validation data was used for hyper parameter search and model selection. The training data was augmented in form of rotations and mirroring. Dropout was applied after all convolutions with p=0.5. Training was performed in 20 epochs, each processing 60 batches of 24 randomly selected ROI slices. For inference, resulting probabilities of a patient’s slices were weighted by the number of voxels in the respective ROI and averaged to obtain an aggregated 3D score.
Ensemble
When combining CNN and Radiomics, we propose to train the two methods separately and only average the two corresponding output scores for each patient. This is because training the CNN end-to-end is crucial for optimizing all processing components w.r.t the ultimate task, and model combination on earlier stages, e.g at the feature level, would require splitting up the training process.
Results
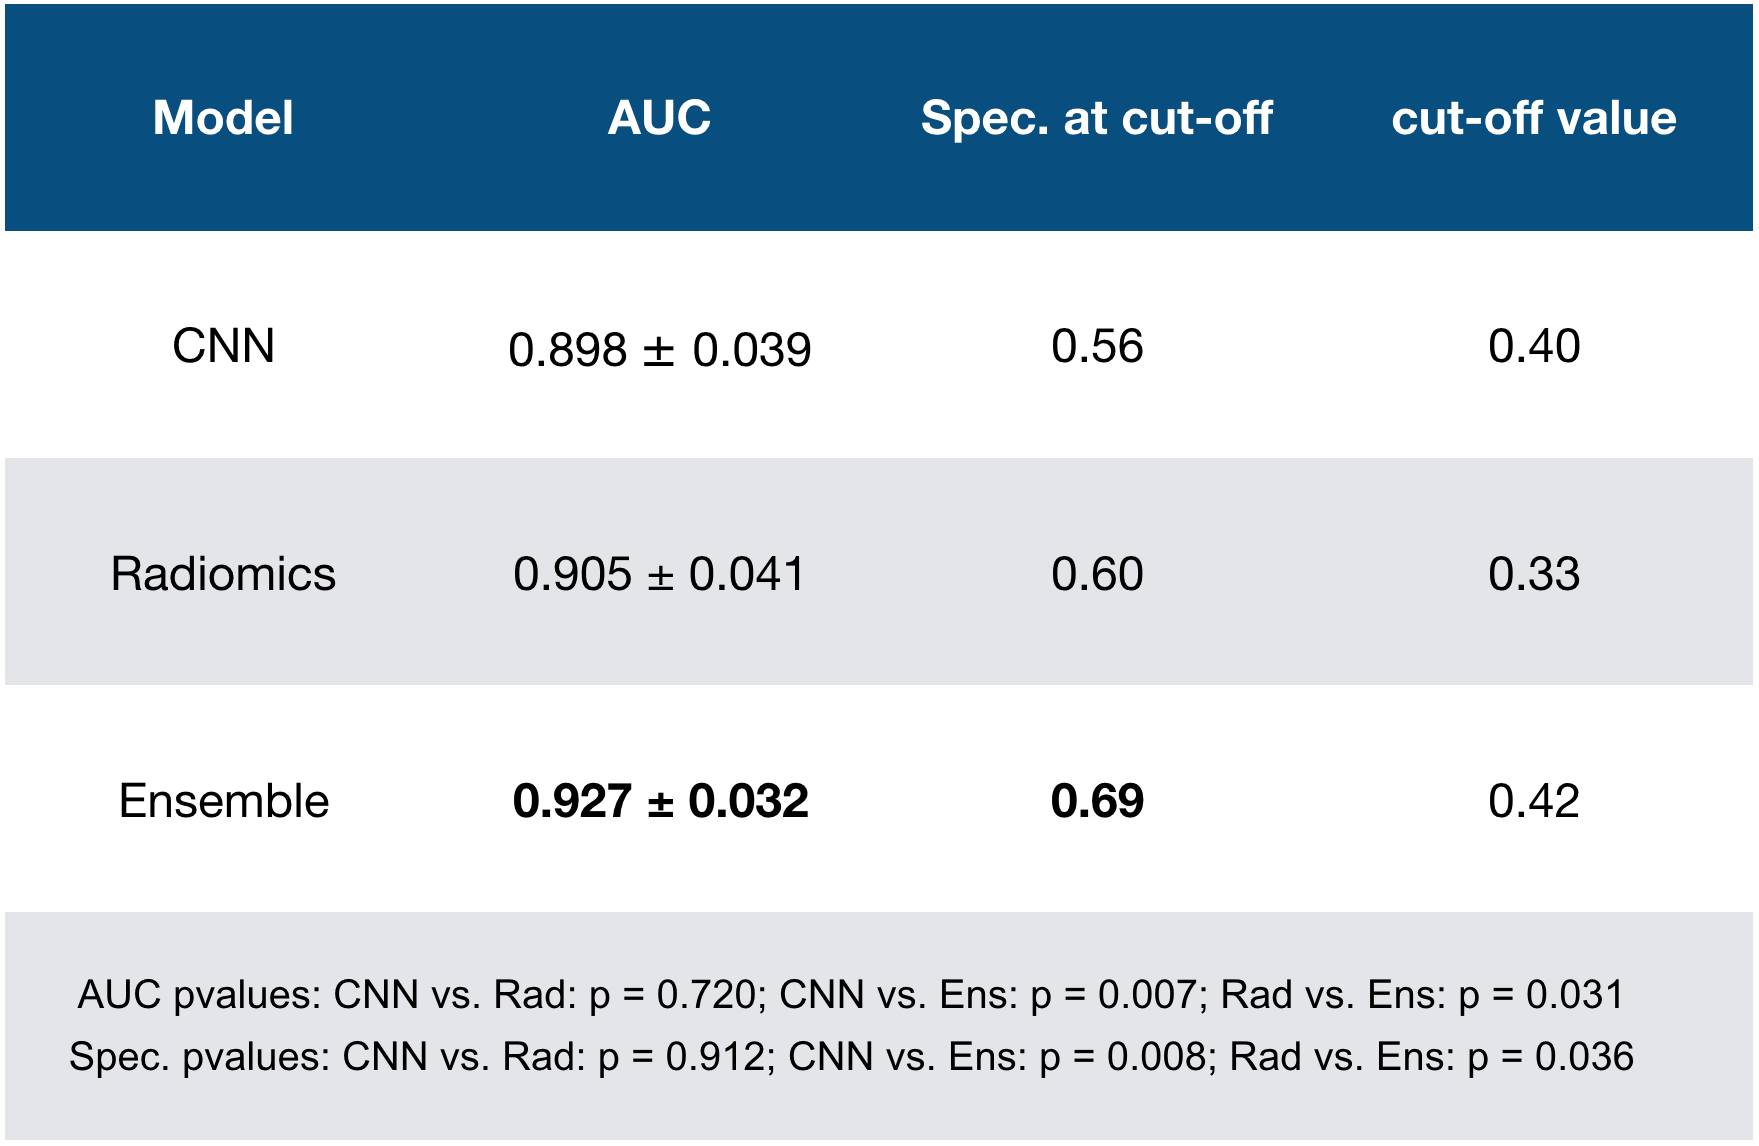
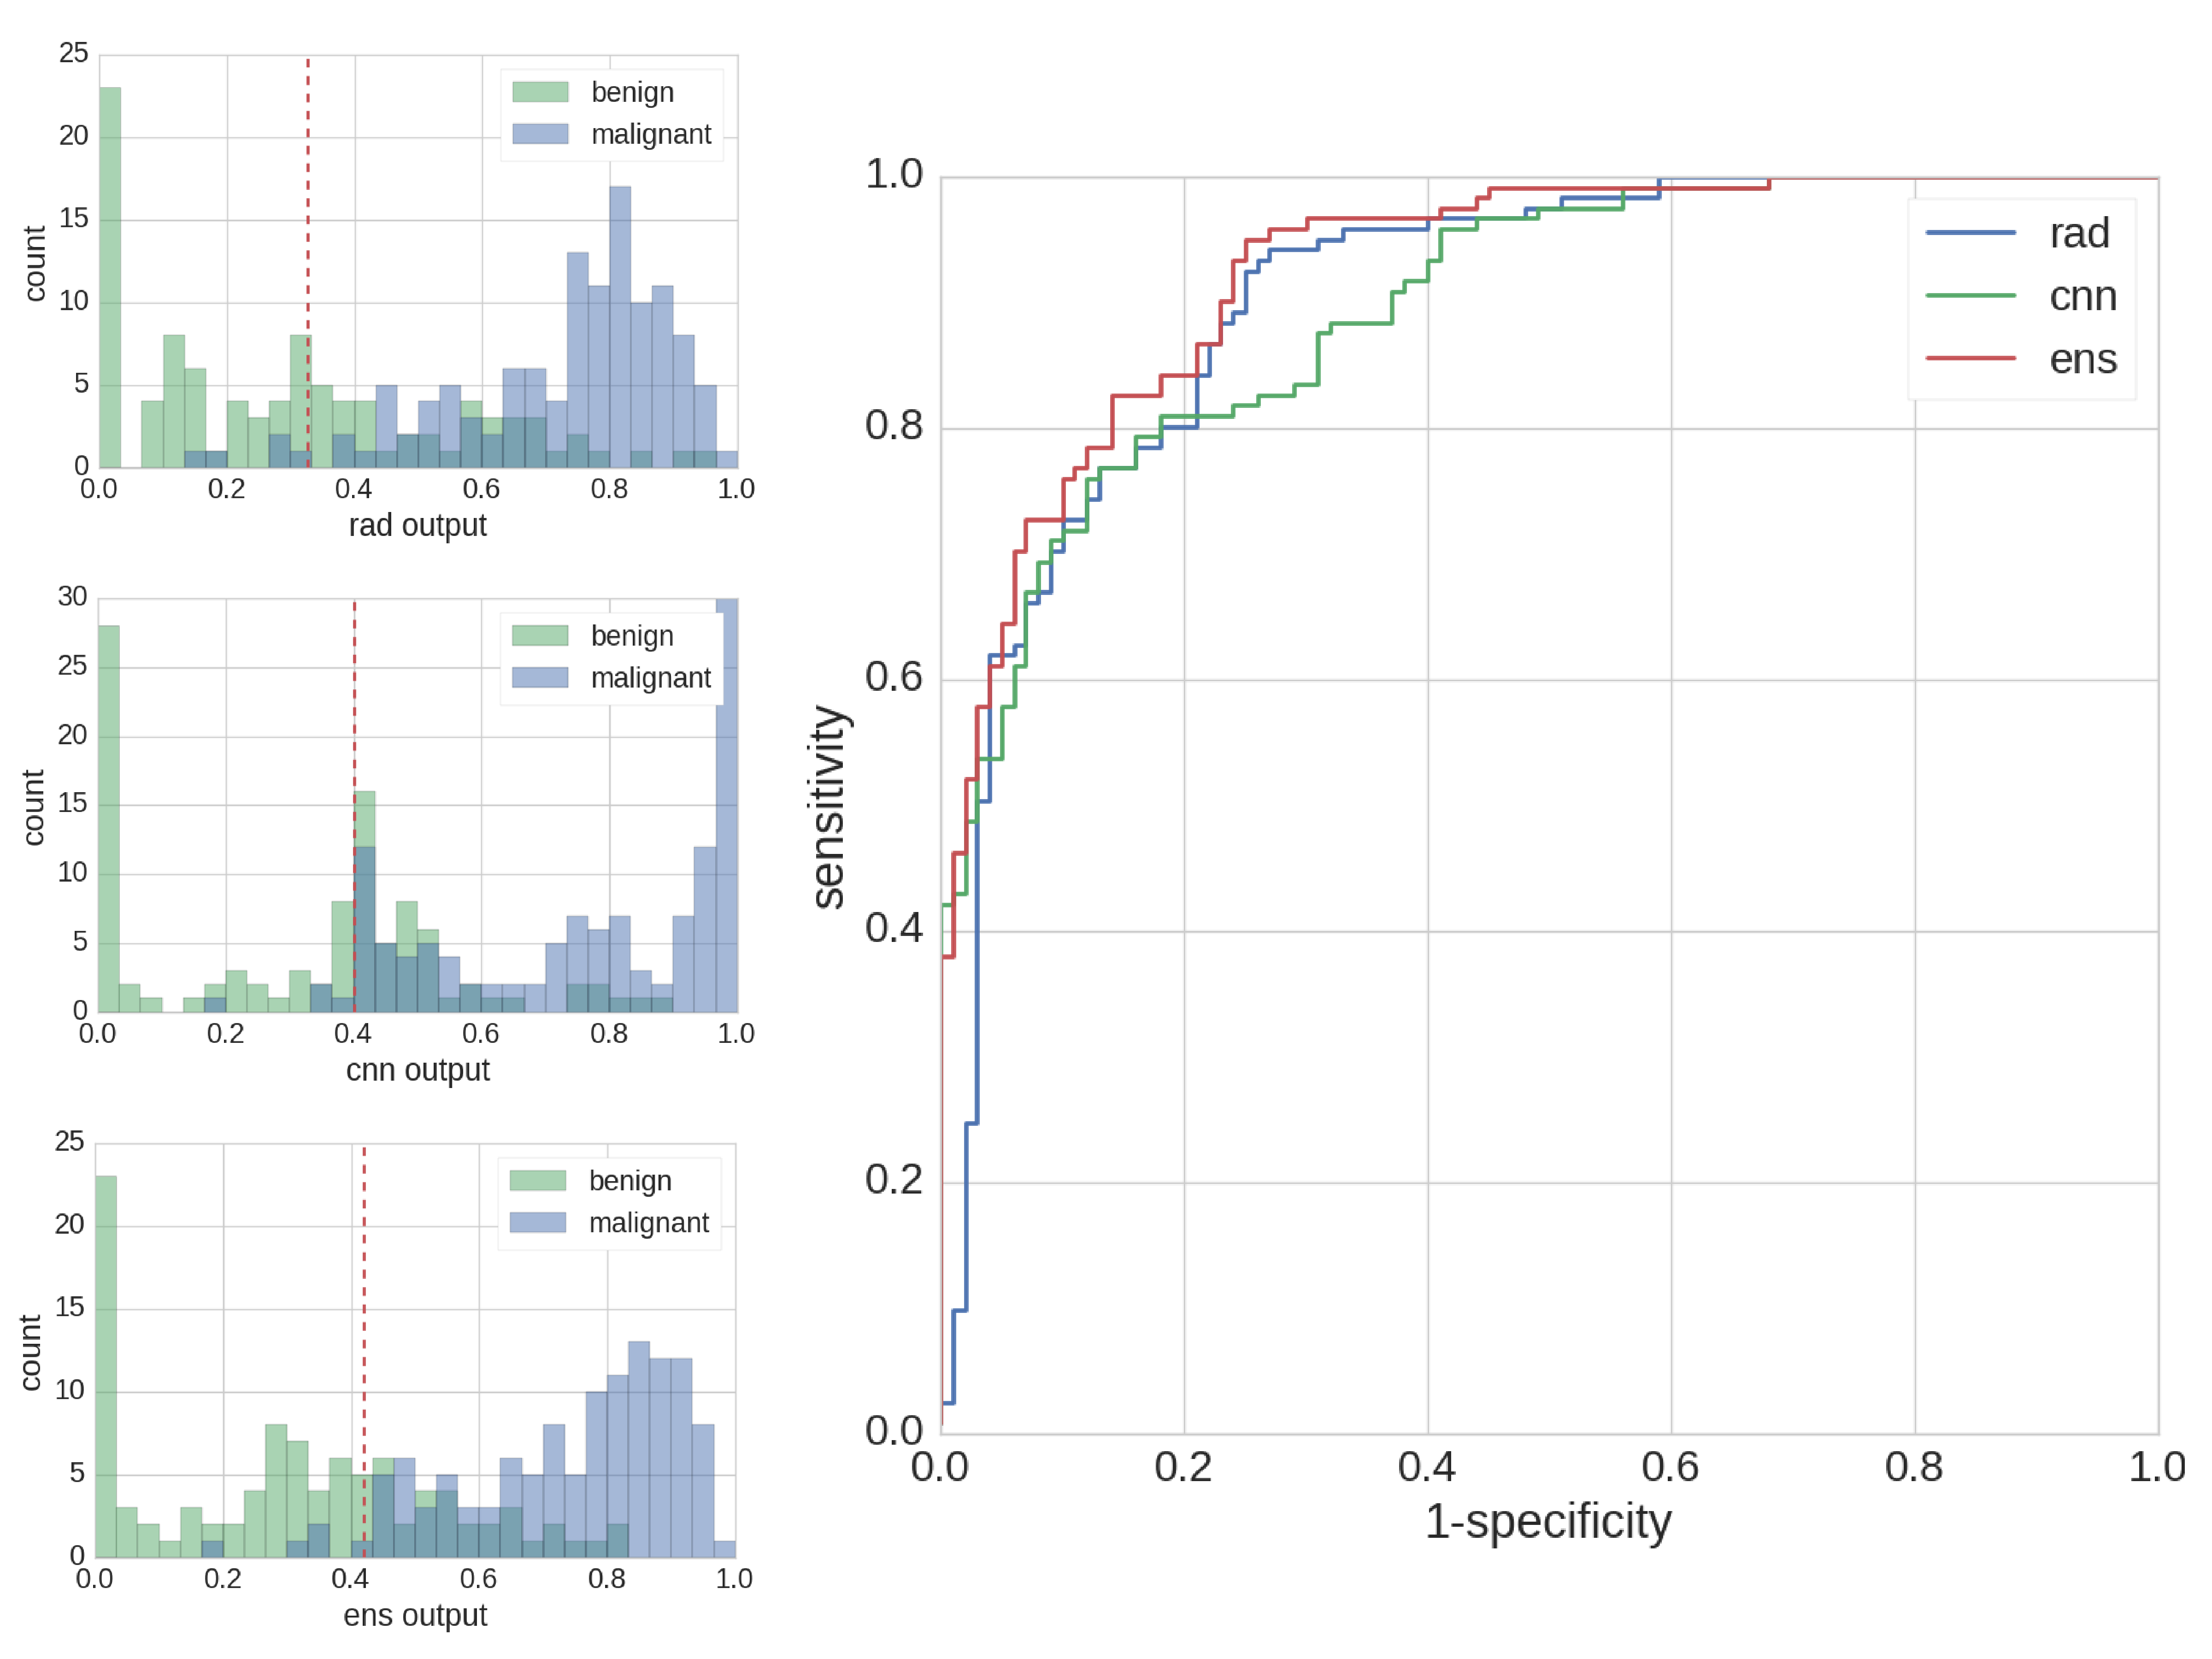
Details on the statistical analysis and corresponding results are presented in Table 1. Output histograms of all compared methods and the ROC curve are shown in Figure 4. Both in AUC and in specificity at a predefined cut-off sensitivity>96%, the ensemble performed significantly superior to Radiomics and CNN. On the same metrics, no significant differences were found between Radiomcis and CNN, however, at low sensitivities (0-50%) the CNN showed higher separation power than Radiomics, while at a sensitivity spectrum of 80-90%, separation power was lower.Discussion and related work
The performance differences across sensitivity spectra indicate a complementary nature of learned CNN representations w.r.t Radiomics features, which results in a significantly superior performance for the ensembled model. The similar standalone performances of CNN and Radiomics do not confirm the findings of previous studies conducted on mammograms5 and contrast enhanced MRI6, where Radiomics outperformed CNN by far. However, neither of the two studies adapted the CNN architecture to the specific problem, but either used a large fully connected model5, which is prone to overfitting on small data sets, or deployed an AlexNet trained only on ImageNet for feature extraction6. Hence, possible reasons for the observed relative improvement of CNN performance are the applied end-to-end training scheme, the adapted light-weight network architecture, but also data set specifics, i.e. adversely affection of small lesion sizes on Radiomics feature groups such as shape or texture. Remarkably, the achieved AUC performances of all explored models are superior to the respective models of the contrast enhanced MRI study6, which hints upon the great potential of dMRI in breast imaging. Future research may attempt to answer the question as to why CNN still perform worse than Radiomics features in some patients. This could be investigated by studying the CNN’s capacity of representing specific Radiomics feature groups.Acknowledgements
No acknowledgement found.References
1. Litjens G, Kooi T, Bejnordi BE, Setio AA, Ciompi F, Ghafoorian M, van der Laak JA, van Ginneken B, Sánchez CI. A survey on deep learning in medical image analysis. arXiv preprint (2017).
2. Aerts HJ, Velazquez ER, Leijenaar RT, Parmar C, Grossmann P, Cavalho S, Bussink J, Monshouwer R, Haibe-Kains B, Rietveld D, Hoebers F. Decoding tumour phenotype by noninvasive imaging using a quantitative radiomics approach. Nature communications. 2014.
3. Bickelhaupt S, Jäger PF, Laun FB, Lederer W, Heidi D, Kuder TA, Paech D, Bonekamp D, Radbruch A, Delorme S, Schlemmer HP, Steudle F and Maier-Hein KH. Radiomics based on adapted Diffusion Kurtosis Imaging clarifies Majority of Suspicious Mammographic Findings. Radiology. in press.
4. Jäger PF, Bickelhaupt S, Laun FB, Lederer W, Heidi D, Kuder TA, Paech D, Bonekamp D, Radbruch A, Delorme S, Schlemmer HP, Steudle F and Maier-Hein KH. Revealing Hidden Potentials of the q-Space Signal in Breast Cancer. In International Conference on Medical Image Computing and Computer-Assisted Intervention 2017 Sep 10 (pp. 664-671).
5. Dhungel N, Carneiro G, Bradley AP. The automated learning of deep features for breast mass classification from mammograms. In International Conference on Medical Image Computing and Computer-Assisted Intervention 2016 Oct 17 (pp. 106-114).
6. Antropova N, Huynh B, Giger M. Performance comparison of deep learning and segmentation-based radiomic methods in the task of distinguishing benign and malignant breast lesions on DCE-MRI. In SPIE Medical Imaging 2017 Mar 3 (pp. 101341G-101341G).
7. Balleyguier C, Ayadi S, Van Nguyen K, Vanel D, Dromain C, Sigal R. BIRADS™ classification in mammography. European journal of radiology. 2007 Feb 28;61(2):192-4.
8. Jensen JH, Helpern JA, Ramani A, Lu H, Kaczynski K. Diffusional kurtosis imaging: The quantification of non‐gaussian water diffusion by means of magnetic resonance imaging. Magnetic resonance in medicine. 2005 Jun 1;53(6):1432-40.
9. Verkooijen HM, Peeters PH, Buskens E, Koot VC, Rinkes IB, Mali WT, van Vroonhoven TJ. Diagnostic accuracy of large-core needle biopsy for nonpalpable breast disease: a meta-analysis. British journal of cancer. 2000 Mar 1;82(5):1017-21.
Figures