4332
Lactate concentration measured by multiple quantum coherence (MQC) MRS in whole human breast tumour is associated with tumour grading1Aberdeen Biomedical Imaging Centre, University of Aberdeen, Aberdeen, United Kingdom, 2Pathology Department, Aberdeen Royal Infirmary, Aberdeen, United Kingdom, 3School of Medicine, University of Aberdeen, Aberdeen, United Kingdom, 4Breast Unit, Aberdeen Royal Infirmary, Aberdeen, United Kingdom, 5Strathclyde Institute of Pharmacy and Biological Sciences, Glasgow, United Kingdom
Synopsis
High level of aerobic glycolysis and an elevated lactate accumulation have been linked to tumour aggressiveness. However, current evidence, mainly based on small animal models or biopsy sections, remains controversial. Since lactate and lipid share the same spectral frequency, conventional MRS is inadequate in measuring lactate under overwhelming lipid signal. Multiple quantum coherence (MQC) MRS allows excellent suppression of lipid even in breast tissues. We applied MQC MRS to measure lactate concentration in grade II and III freshly excised whole human breast tumours to assess if there was a difference between the two groups.
Introduction
Elevated lactate production is central to aerobic glycolysis of tumour metabolism, commonly known as the Warburg effect. The presence of lactate has been suggested to induce increased proliferative activity and in turn poor prognosis1. A higher amount of lactate (>9mmol/L) has been found in metastatic orthotopically implanted mammary tumours in mice2,3 however opposite results were also observed using hyperpolarised 13C-pyruvate MRS4. Current controversy might arise from the heavy reliance on animal models or partial sampling of biopsy. Since lactate and lipid share the same spectral frequency, conventional MRS is inadequate in extracting lactate in breast tissues. Multiple quantum coherence (MQC) MRS allows an efficient suppression of lipid signal. We hypothesise that there is a difference in lactate concentration between high and low grade breast cancer, as indicated by Warburg effect. To probe this hypothesis, we applied MQC MRS5 in freshly excised whole human breast tumours.
Methods
Thirty female patients (age 39 – 78 years, 15 grade II and 15 grade III) with invasive ductal carcinoma participated in the study. Only patients undergoing wide local excision or mastectomy, with a tumour size larger than 1cm were eligible. The patients did not receive any hormonal treatment or chemotherapy, and guide wire was not required for surgery. After tumour excision, the fresh specimen was immediately transported to the imaging centre for MRS scan. Once the scan completed, the fresh specimen was transported to Pathology Department for formalin treatment (Figure 1). The study was approved by the North West – Greater Manchester East Research Ethics Service, and written informed consent was obtained prior to the MRS study.
MRS Acquisition
All data were acquired on a 3T whole body clinical MRI scanner (Achieva TX, Philips Healthcare, Best, Netherlands) using body coil for uniform transmission and a 32-channel receiver coil for high sensitivity detection. Standard T1-weighted anatomical images were acquired with an isotropic voxel size of 1mm, TR/TE of 5.2ms/2.7ms, covering the specimen at the centre of the imaging volume. Lactate and reference spectra were collected from a single voxel snug-fit to the tumour. Lactate spectrum was obtained using MQC MRS5, with TR/TE of 1.25s/144ms, spectral editing frequency at 4.1ppm and 512 averages. The reference spectrum with unsuppressed water was acquired from the same voxel with TR/TE of 1.25s/144ms, 16 averages.
Data Processing
All spectral data were preprocessed following standard procedures and quantified using AMARES algorithm6 in the jMRUI software7. Water and lactate amplitudes, with corresponding chemical shifts at 4.7ppm and 1.3ppm, were quantified from reference and lactate spectra respectively. Lactate concentration was then computed from lactate and water amplitudes accounting for literature breast tissue water composition8 and relaxation properties9.
Statistical Analysis
Statistical analysis was performed in SPSS software (Release 23.0, SPSS Inc., Chicago, IL, USA). Two-sample t-tests were carried out on patient characteristics and lactate concentration to assess any group difference between grades. Correlation analysis was conducted to determine the relationship between lactate concentration against tumour size, age and body mass index. The statistical results were classified as significant if p value was smaller than 0.05.
Results
The patient characteristics of the two groups are shown in Table 1, and there was no significant difference in all the parameters between the two grades. There was a significant difference (p=0.0349, Table 2, Figure 2) in lactate concentration between grade II (5.5±2.4 mmol/kg) and grade III (7.7±2.9 mmol/kg) breast tumours. There was no significant correlation between lactate concentration against tumour size (r=0.1716, p=0.3645, Table 2, Figure 3), age (r=0.1019, p=0.5921, Table 2, Figure 3) or body mass index (r=0.3566, p=0.1033, Table 2, Figure 3). The lactate spectrum from a typical breast tumour is shown in Figure 2(b).Discussion
We found that there was a significantly higher lactate concentration in grade III breast tumours compared to grade II. Lactate concentration was independent of the tumour size, age or body mass index of the patients, indicating that lactate concentration is a sensitive biomarker specific to underlying metabolic process. In our study, we scanned freshly excised tumours immediately after surgery and used large tumour size to ensure precise localisation of MRS. Our result is an important step in addressing the controversy around Warburg effect through lactate concentration observation from whole human breast tumour in a prospective cross sectional study.Conclusion
Our results show that lactate concentration is associated with tumour grading in breast, confirming Warburg effect. This paves the way for the potential clinical application of MQC MRS in assessing tumour aggressiveness and monitoring of breast cancer.Acknowledgements
The authors would like to thank Mr Nicholas Senn for conducting data auditing, Dr Matthew Clemence for clinical scientist support, Dr. Tim Smith for biologist support, Ms Bolanle Brikinns for patient recruitment support, Ms Dawn Younie for logistic support, Prof Andrew M Blamire for advice on MRS. This project is funded by Friends of ANCHOR, and Sai Man Cheung is jointly supported by Elphinstone scholarship, Roland Sutton Academic Trust and John Mallard scholarship.References
1. Doherty JR, Cleveland JL. Targeting lactate metabolism for cancer therapeutics. J Clin Invest. 2013;123(9):3685–92.
2. Serganova I, Rizwan A, Ni X, et al. Metabolic Imaging: A Link between Lactate Dehydrogenase A, Lactate, and Tumor Phenotype. Clin Cancer Res. 2011;17(19):6250–61.
3. Rizwan, A, Serganova, I, Khanin, R, et al. Relationships between LDH-A, lactate, and metastases in 4T1 breast tumors. Clin Cancer Res. 2013; 19(18): 5158 – 5169.
4. Xu HN, Kadlececk S, Profka H, et al. Is higher lactate an indicator of tumor metastatic risk? A pilot MRS study using hyperpolarized 13C-Pyruvate. Acad Radiol. 2014;21(2):223–31.
5. He, Q, Shungu, DC, van Zijl, PCM, et al. Single-scan in vivo lactate editing with complete lipid and water suppression by selective multiple-quantum-coherence transfer (Sel-MQC) with application to tumors. J Magn Reson, Series B. 1995; 106(3): 203 – 211.
6. Vanhamme L, van den Boogaart A. Improved method for accurate and efficient quantification of MRS data with use of prior knowledge. J Magn Reson. 1997;129(1):35–43.
7. Naressi A, Couturier C, Castang I, et al. Java-based graphical user interface for MRUI, a software package for quantitation of in vivo/medical magnetic resonance spectroscopy signals. Comput Biol Med. 2001;31(4):269–86.
8. Sijens, PE, Dorrius, MD, Kappert, P, et al. Quantitative multivoxel proton chemical shift imaging of the breast. Magn Reson Imag. 2010; 28(3): 314 – 319.
9. Annarao, S, Thomas, K, Pillarsetty, N, et al. In vivo lactate T1 and T2 relaxation measurements in ER-positive breast tumours using SS-SelMQC editing sequence. Proceedings of the 19th Annual International Society of Magnetic Resonance in Medicine (ISMRM), Montréal, Québec. 2011; p.3158.
Figures
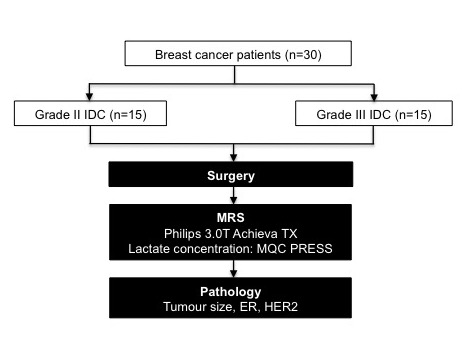
Figure 1. Study design
The study design adopting two-group cross sectional arrangement is shown in a flow chart. Thirty patients with invasive ductal carcinoma (15 grade II and 15 grade III) participated in the study. After wide local excision or mastectomy, the freshly excised tumours were scanned on a 3T clinical MRI scanner to derive lactate concentration of the whole tumour using multiple quantum coherence point resolved spectroscopy (MQC PRESS). Subsequently, histopathological analysis was carried out to derive the tumour size, estrogen receptor (ER) and human epidermal growth factor receptor 2 (HER2) status.
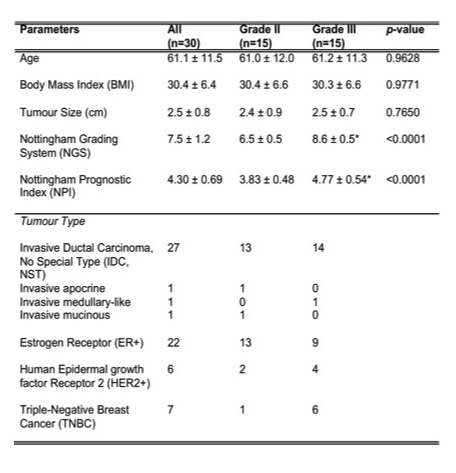
Table 1. Patient demography
Patient demographics and routine histopathological findings of excised breast tumours are shown for each group and the entire cohort. Quantitative data were expressed as mean and standard deviation, while qualitative data expressed as number of positive cases. Significant differences are marked by ‘*’.
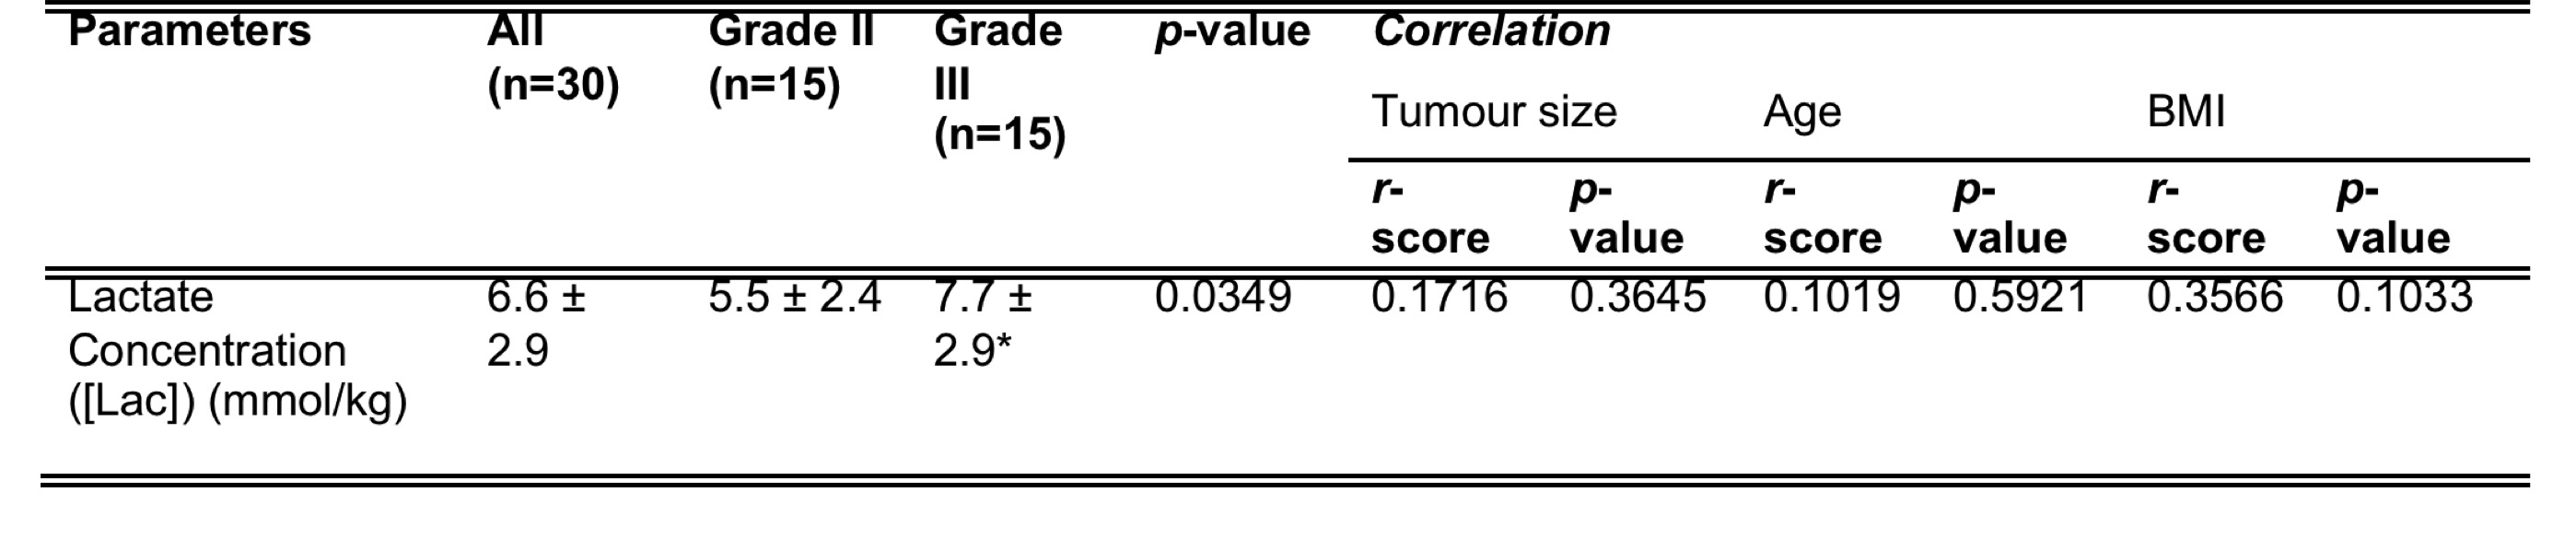
Table 2. A summary of statistical findings in this study
There is a significant higher lactate concentration found in grade III breast tumour compared to grade II and lactate concentration does not correlate with tumour size, age or body mass index of the patients. Significant findings are marked by ‘*’. BMI stands for body mass index.

Figure 2. Group difference results and MQC MRS spectrum
(a). The group difference in lactate concentration is shown in a dot plot. Each dot represents the measurement obtained in each patient, and the dots are organised in two columns corresponding to the tumour grades. The error bar indicates the mean and standard deviation of the parameter in the corresponding group. The t-test was performed between groups and p value shown. There is a significantly higher lactate concentration in grade III breast tumour compared to grade II. (b). A typical MQC MRS spectrum obtained from a breast tumour specimen, showing the clean lactate signal at 1.3ppm.

Figure 3. Correlation results
The lactate concentration was correlated against (a) tumour size, (b) age and (c) body mass index within the entire cohort, and are shown as scatter plots. The regression line is shown, with the corresponding Pearson’s r score and p value displayed. Lactate concentration is independent of tumour size, age or body mass index of the patients.