4329
Time makes the difference: Comparison of ADC values obtained with OGSE and PGSE sequences for differentiation of human breast tumors1Department of Diagnostic Imaging and Nuclear Medicine, Graduate School of Medicine, Kyoto University, Kyoto, Japan, 2Hakubi Center for Advanced Research, Kyoto University, Kyoto, Japan, 3Siemens Healthcare K.K., Tokyo, Japan, 4Siemens Healthcare GmbH, Erlangen, Germany, 5Department of Breast Surgery, Graduate School of Medicine, Kyoto University, Kyoto, Japan
Synopsis
The diffusion time dependence of ADC measurements has been investigated using OGSE and PGSE sequences in human breast tumors. Relative changes in ADC values corresponding to two diffusion times, in addition to ADC values for each diffusion time were calculated in malignant and benign breast lesions as well as in normal breast tissues. Significant differences of ADC changes, in addition to ADC values for each diffusion time, have been found among malignant and benign lesions and normal breast tissue. No ADC changes have been identified in a dedicated breast phantom. ADC maps corresponding to different diffusion times indicate that ADC changes might provide insight in revealing new tissue features like, for instance, intracellular structure of breast tumors.
Introduction
Diffusion
MRI has been established as a useful tool for the detection and
characterization of breast lesions without the need for the application of
contrast agents, and many previous studies have demonstrated the clinical
utility of ADC values in differentiating between malignant and benign breast
lesions or breast tumor subtypes.1,2 The importance of
diffusion-time-dependent diffusion measurements has been emphasized in mice
brain studies.3,4 Diffusion hindrance is supposed to increase with
longer diffusion time, as more water molecules hit obstacles, such as cell
membranes, the density of which increases in cancer tissues. Accordingly, our
purpose was to investigate the association of diffusion parameters with
different diffusion times using oscillating gradient spin-echo (OGSE) and pulsed
gradient spin-echo (PGSE) in human breast tumors and a breast dedicated phantom.Methods
OGSE and PGSE sequences were performed on 11 patients with 12 breast lesions (6 malignant and 6 benign) and a dedicated-breast phantom (with an incorporated compartment exhibiting a range of ADC values using polyvinylpyrrolidone (10-40% PVP), covering clinical values from malignant to benign lesions5), using a 3T system (MAGNETOM Prisma, Siemens Healthcare, Erlangen, Germany) equipped with a dedicated 16-channel breast array coil. DWI was performed with prototype sequences using b-values of 0 and 700 s/mm2, using a) OGSE with trapezoid cosine waveforms6 (frequency = 40 Hz; effective diffusion time = 5.1 ms) and b) pulsed gradient spin-echo (PGSE) (diffusion gradient pulse duration [δ] = 10 ms; diffusion gradient separation [Δ] = 100 ms); repetition time/echo time, 7,500 ms/125 ms; field of view, 330×177 mm2; matrix, 112×60; slice thickness, 3.0 mm; and acquisition time, 2.5 min each for OGSE and PGSE. ROIs were placed in tumors or normal parenchyma on ADC images, under guidance of T2-weighted and CE (contrast-enhanced T1-weighted) images.
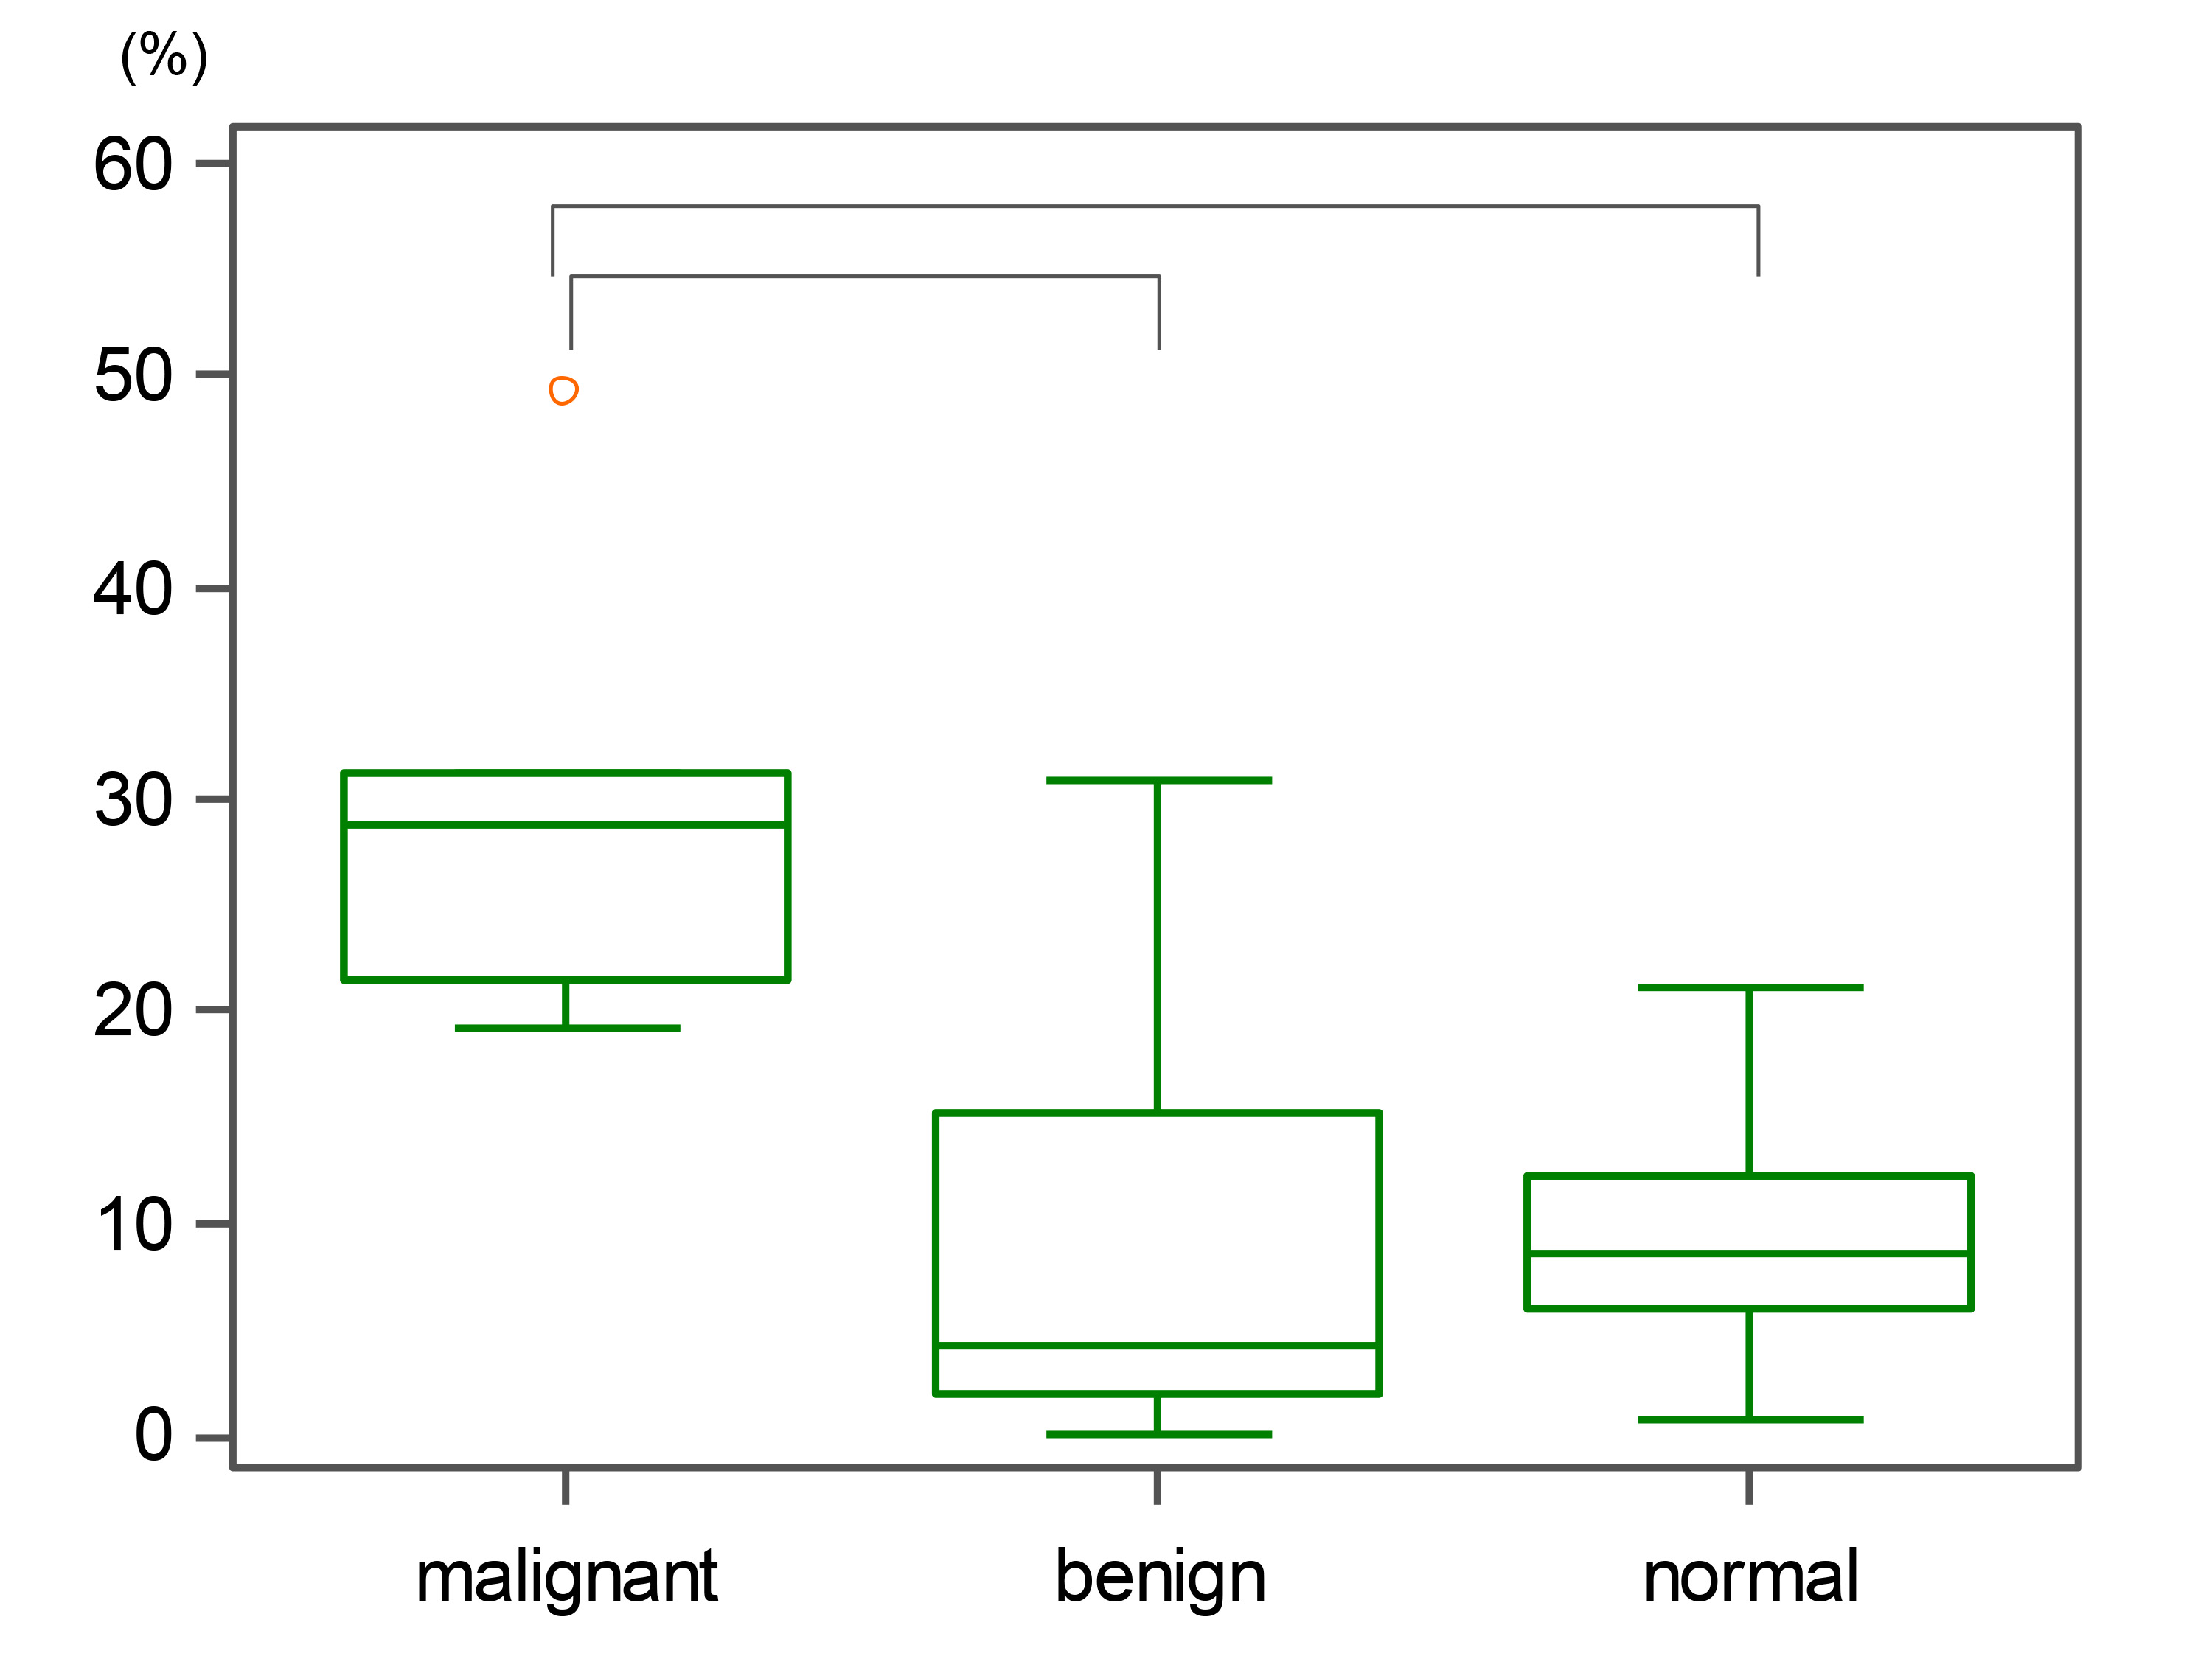
A relative ADC change was calculated as (OGSE-ADC – PGSE-ADC) / OGSE-ADC x 100 (%). ADC values with different diffusion times were compared using Wilcoxon test, and ADC changes in malignant, benign or normal breast tissues were compared using Mann-Whitney test.
Results
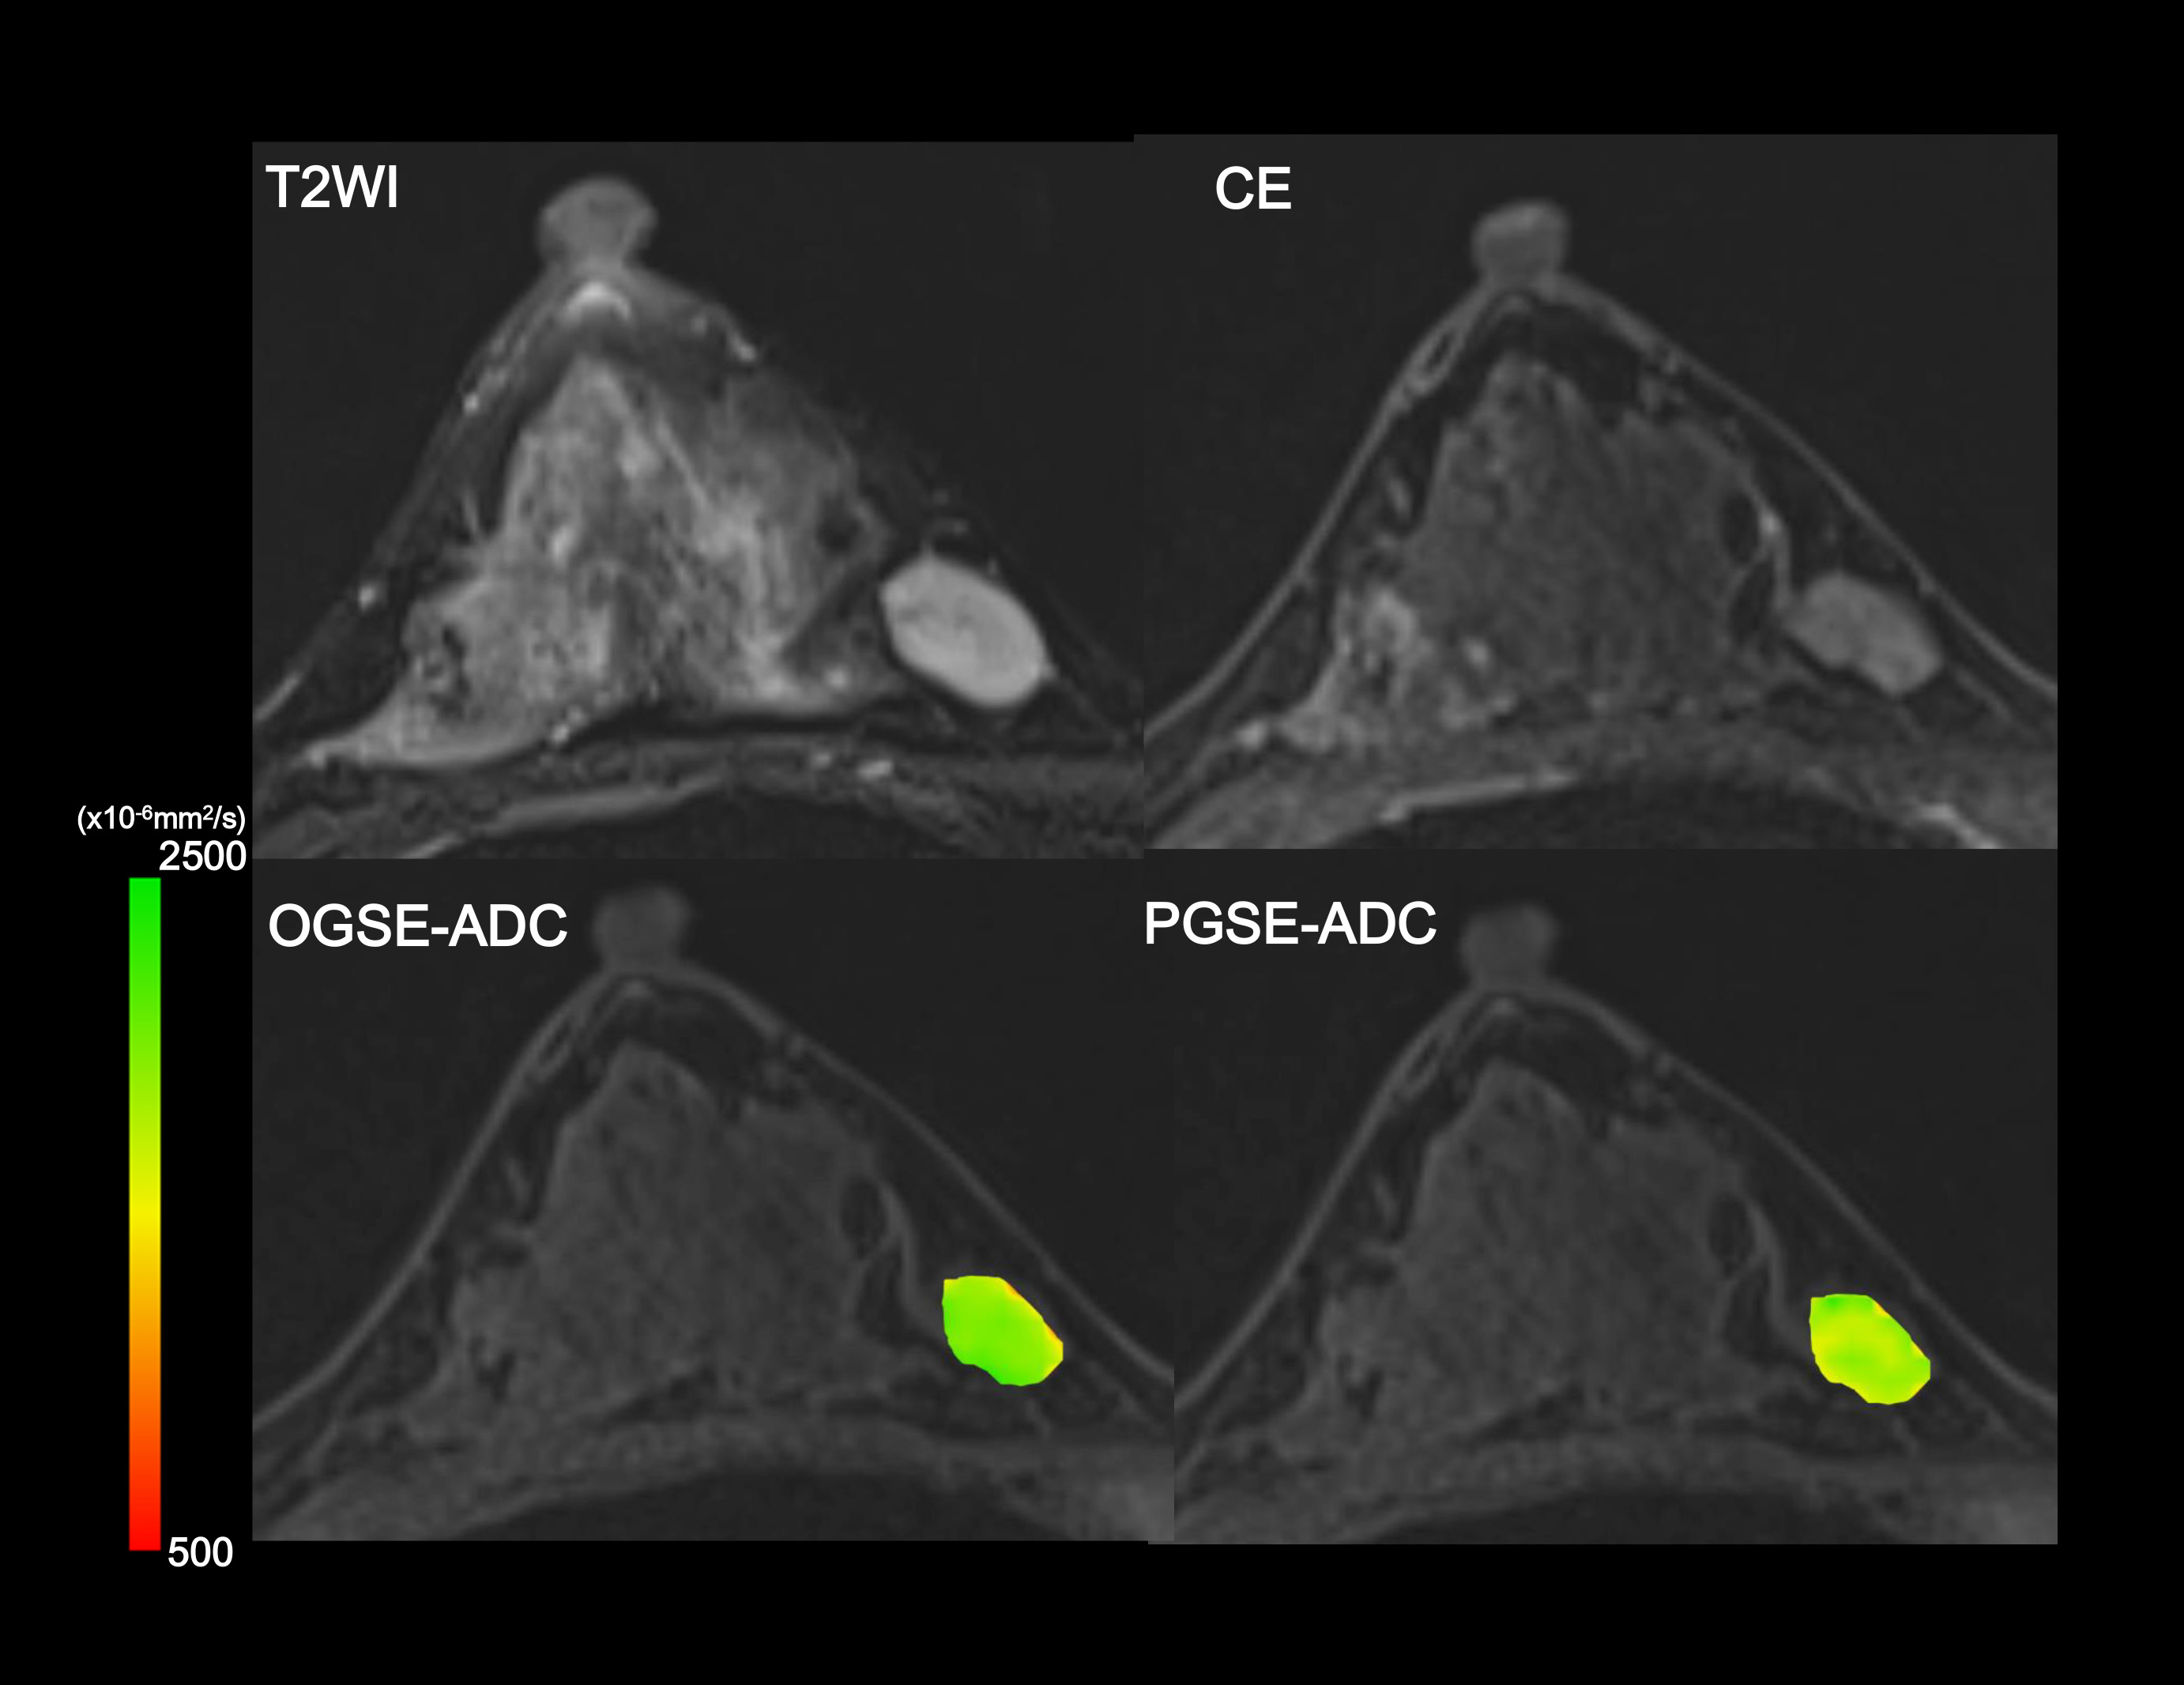
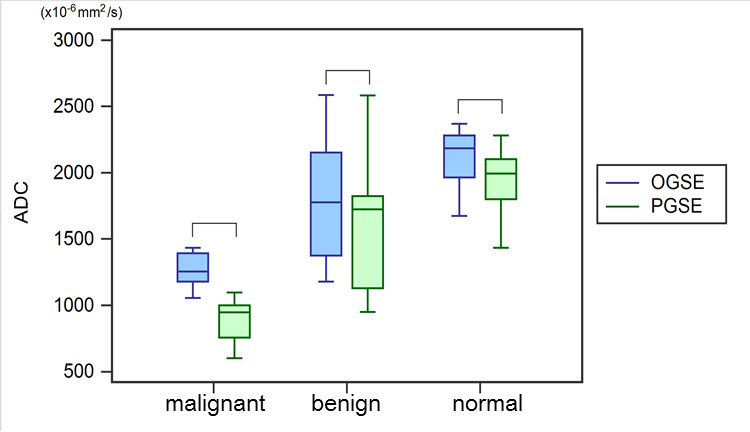
Relative ADC changes between OGSE and PGSE in the PVP breast phantom were negligible (0.3-1.6%). Representative ADC maps of different diffusion times overlaid on T2W and CE images are shown in Figures 1-3. Cyst (ventral lesion) indicates no change between OGSE-ADC and PGSE-ADC, while PGSE-ADC value of invasive ductal carcinoma (IDC, dorsal lesion) remarkably decreases compared to OGSE-ADC (Fig.1). The patterns of ADC changes with diffusion time in IDC clearly reveal central necrosis that were not readily visible in the anatomical images (Fig.2). On the other hand, there is a very small ADC change observed in fibroadenoma (Fig.3). The distribution of ADC values using OGSE and PGSE for malignant and benign lesions and normal breast tissue is summarized in Figure 4. ADC values significantly decreased when the diffusion time increased from OGSE to PGSE in all tissue types (p < 0.05). Figure 5 summarizes relative ADC changes between OGSE-ADC and PGSE-ADC. Relative ADC changes in malignant lesions were significantly larger than in benign lesions or normal tissue (p < 0.05).Discussion
The decrease of ADC values with the increase of diffusion time is in agreement with literature along with our previous investigation7,8, suggesting the hypothesis that diffusion hindrance increases with the diffusion time in the tumor, as more molecules hit many boundaries, such as cell membranes. The area with the largest ADC changes corresponded to the area with low ADC values, suggesting the most proliferating or active part of the tumor. Significant differences in relative ADC changes between malignant and benign lesions indicate that comparing ADC values at different diffusion times, facilitated by OGSE sequences, might help to increase diagnostic accuracy for the differentiation of these lesions without the use of contrast agents.Conclusion
Significantly different ADC values were observed with the increase of diffusion time in malignant and benign breast lesions as well as normal breast tissue. Estimation of relative ADC changes using both OGSE and PGSE might provide better characterization of breast tumors or better diagnostic performance for differentiation of malignant and benign breast lesions.Acknowledgements
The authors would like to thank Mr. Katsutoshi Murata and Mr. Yuta Urushibata from Siemens Healthcare K.K. for the excellent and knowledgeable support.
This work was supported by Hakubi Project of Kyoto University and MEXT KAKENHI Grant No. 15K19786.
References
(1) Partridge SC, Nissan N, Rahbar H, et al. Diffusion-weighted breast MRI: Clinical applications and emerging techniques. J Magn Reson Imaging. 2017;45(2):337-355.
(2) Iima M, Kataoka M, Kanao S, et al. Intravoxel incoherent motion and quantitative non-Gaussian diffusion MRI: Evaluation of the diagnostic and prognostic value of several markers of malignant and benign breast lesions. Radiology in press.
(3) Pyatigorskaya N, Le Bihan D, Reynaud O, et al. Relationship between the diffusion time and the diffusion MRI signal observed at 17.2 Tesla in the healthy rat brain cortex. Magn Reson Med. 2014;72:492-500.
(4) Reynaud O, Winters KV, Hoang DM, et al. Surface-to-volume ratio mapping of tumor microstructure using oscillating gradient diffusion weighted imaging. Magn Reson Med. 2016 ;76(1):237-47.
(5) Keenan KE, Peskin AP, Wilmes LJ, et al. Variability and bias assessment in breast ADC measurement across multiple systems. J Magn Reson Imaging. 2016;44(4):846-55.
(6) Van AT, Holdsworth SJ, Bammer R. In Vivo Investigation of Restricted Diffusion in the Human Brain with Optimized Oscillating Diffusion Gradient Encoding. Magn.Reson.Med. 2014;71(1):83-94.
(7) Iima M, Nobashi T, Imai H, et al. Investigation of diffusion signal behavior at different diffusion times in a human hepatocellular carcinoma xenograft model. Proceedings of the 24th Annual Meeting of ISMRM, Singapore, 2016, p. 3418.
(8) Li H, Arlinghaus L, Chakravarthy A, et al. In vivo imaging of mean cell size and density of human breast tumors. Proceedings of the 24th Annual Meeting of ISMRM, Honolulu, 2017, p.0863.
Figures
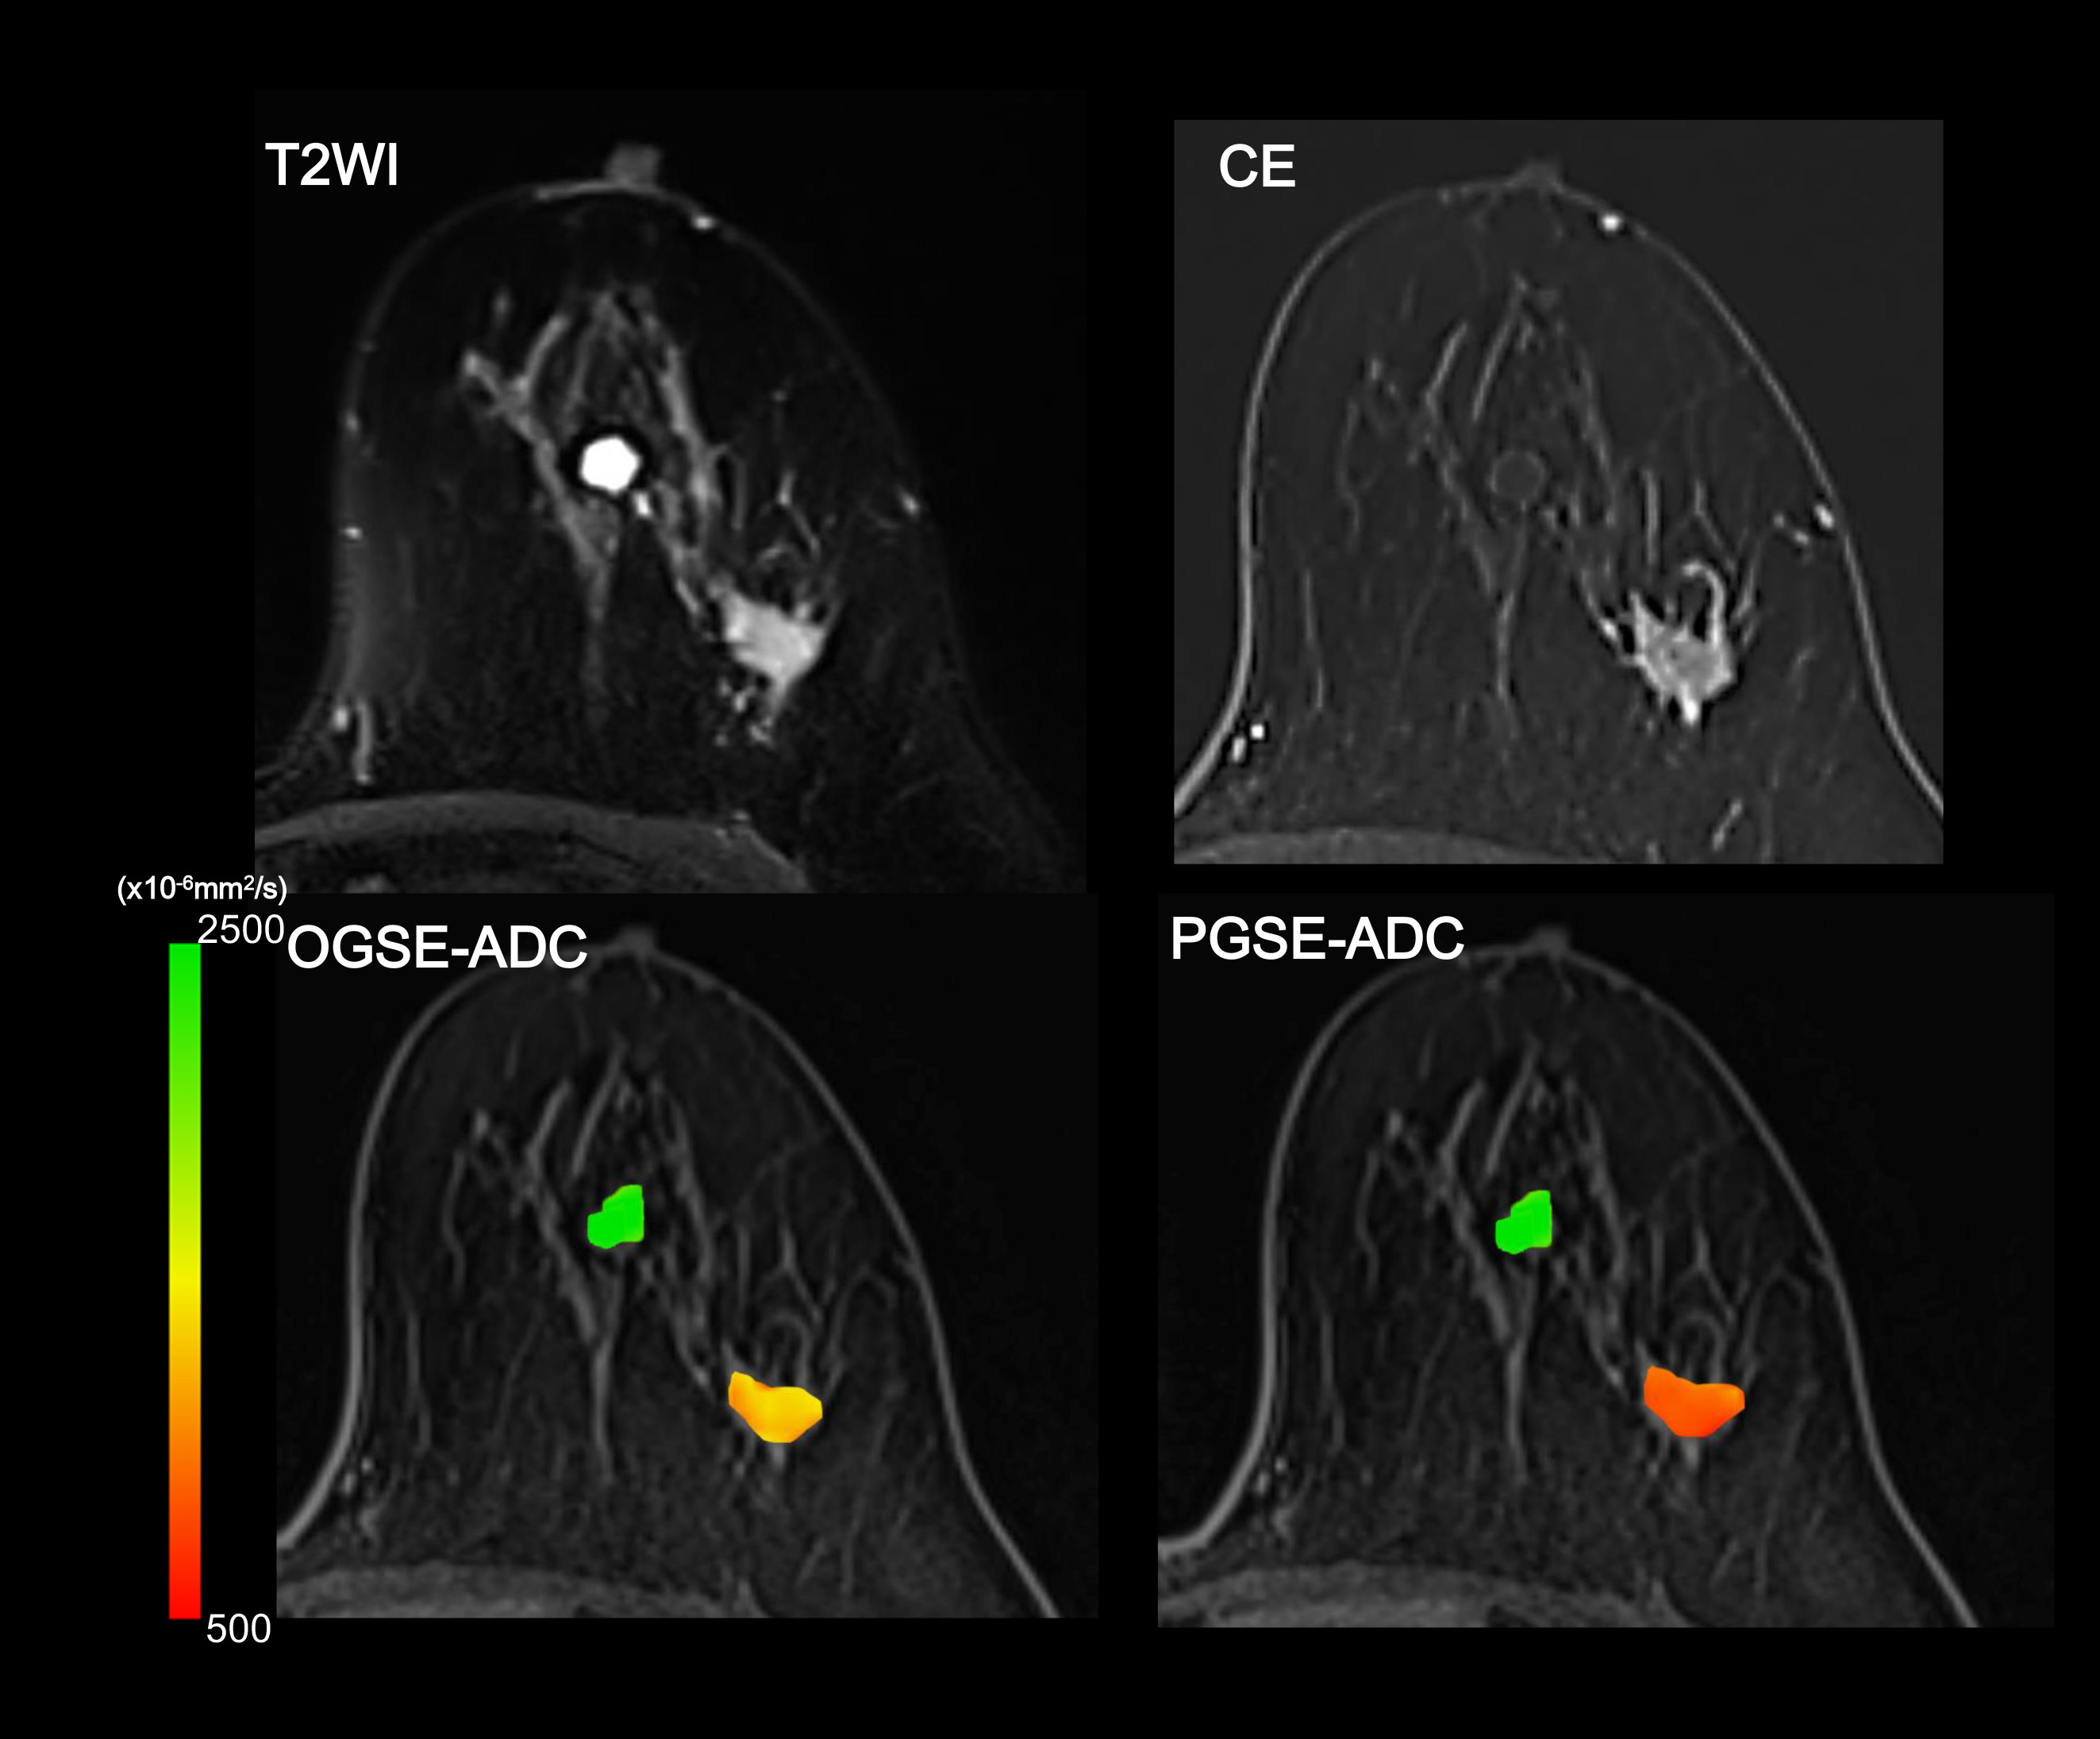
Figure 1: Images of cyst (ventral lesion) and invasive ductal carcinoma (IDC; dorsal lesion). T2W, CE images, and ADC maps using OGSE and PGSE. Cyst shows no ADC change (green) between OGSE-ADC and PGSE-ADC, while IDC shows remarkable decrease of ADC values using OGSE (yellow) compared to PGSE (red). ADC maps of the lesion were overlaid to pre CE images.
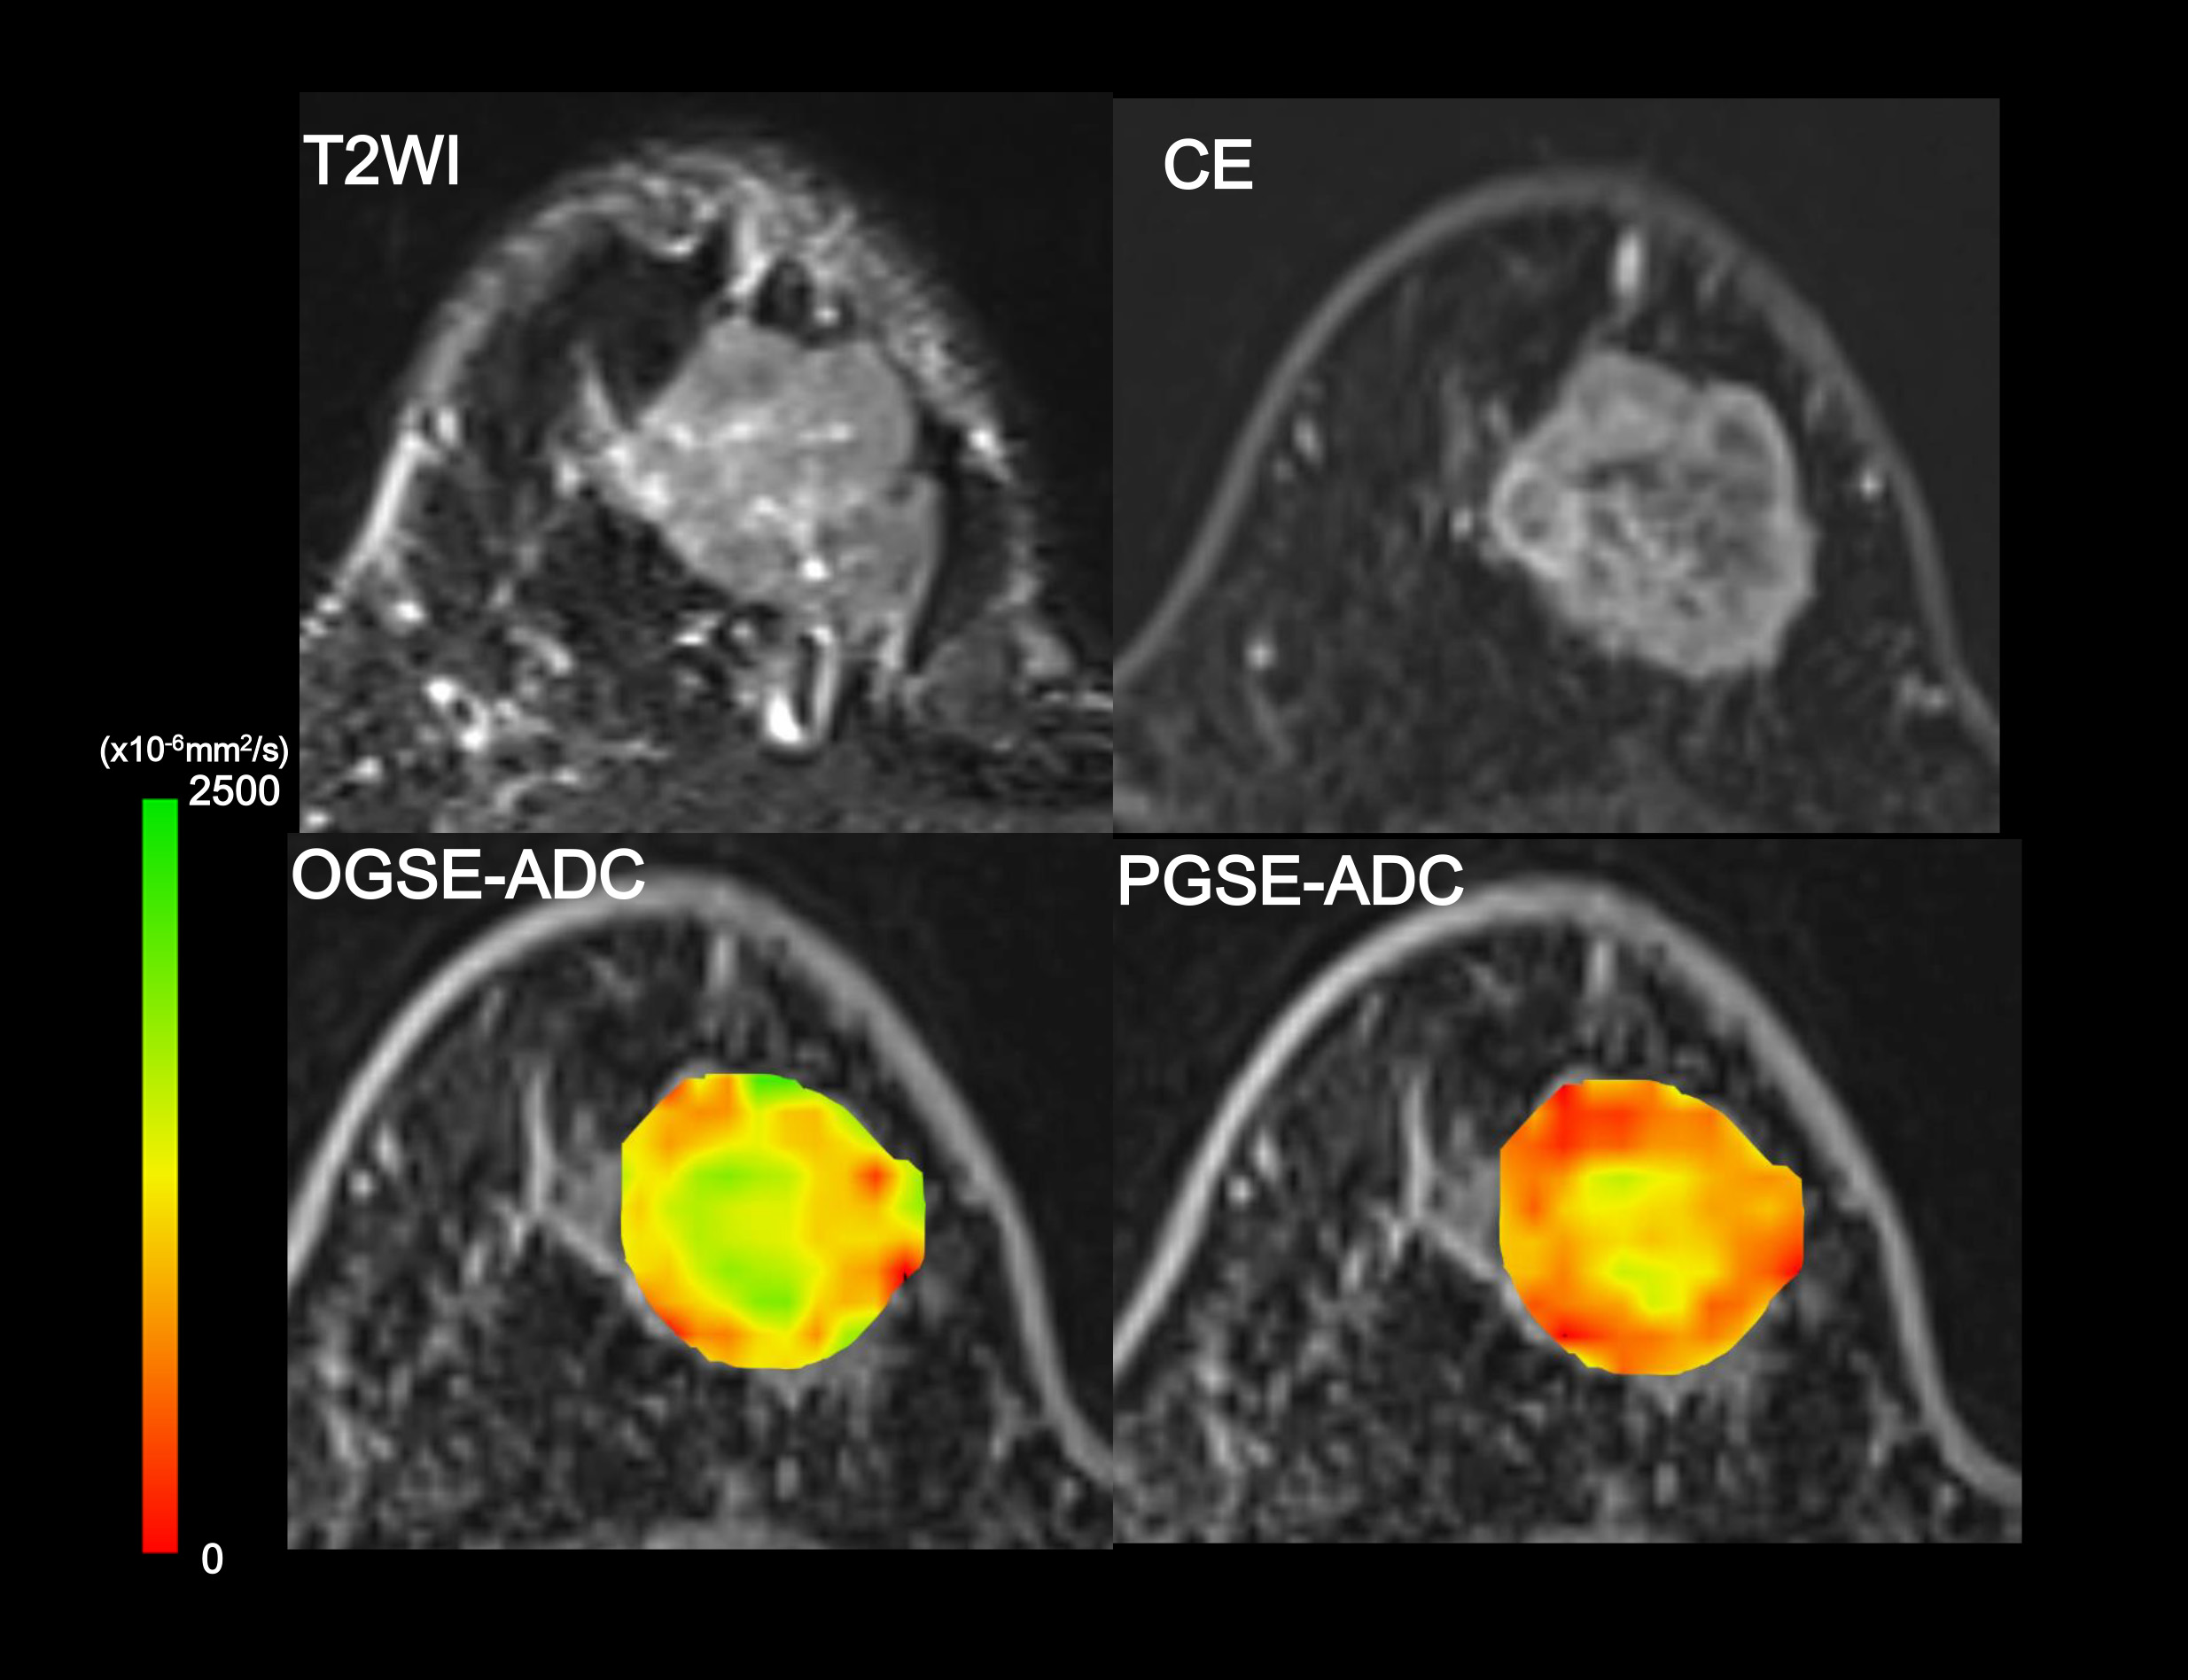
Figure 2: Images of IDC. T2W, CE images, and ADC maps using OGSE and PGSE. IDC with central necrosis can be more clearly appreciated on ADC maps compared to T2W or CE images. PGSE-ADC values of the peripheral lesion of the tumor are lower (red) than OGSE-ADC values (red-yellow-green). ADC maps of the lesion were overlaid to pre CE images.