4328
Attenuation Correction Map Calculation and Truncation Completion for Breast PET/MR Imaging using Deep Learning1Radiology, University of Wisconsin- Madison, Madison, WI, United States, 2Medical Physics, University of Wisconsin- Madison, Madison, WI, United States, 3Carbone Cancer Center, University of Wisconsin- Madison, Madison, WI, United States
Synopsis
While Positron Emission Tomography (PET) used jointly with Magnetic Resonance (MR) Imaging shows promise in breast imaging, unique constraints require novel solutions to achieve attenuation-corrected images. We propose an algorithm for producing a linear attenuation coefficient map and truncation completion created from MR images using deep learning.
Purpose
PET has been shown to have high specificity for breast cancer detection1. The recent availability of simultaneous PET/MR scanners provides the benefit of combining the high sensitivity, morphological details and enhancement kinetics provided by MR imaging with functional imaging provided by PET.
However, simultaneous breast PET/MR imaging has unique challenges. To enable quantitative PET imaging, attenuation and scatter of PET photons must be accounted for based on a linear attenuation coefficient map (or μ-map). In PET/MR, approximate algorithms utilizing image segmentation of two-point Dixon images are often used2. Patients are imaged in the prone position on a breast coil to minimize deformation, optimize coil geometry and signal, and center the breasts in the magnetic field. However, this displaces the patient’s body in the bore, resulting in the patient's back being displaced superiorly out of the maximum MR field of view. When the MR images are truncated and the back is not included to varying degrees based on body habitus, current techniques to generate the necessary attenuation map often fail. The purpose of this work is to establish a robust attenuation correction algorithm of breast PET/MR images that relies on deep learning to recreate the missing portions of the patient’s anatomy (truncation completion).
Methods
Workflow
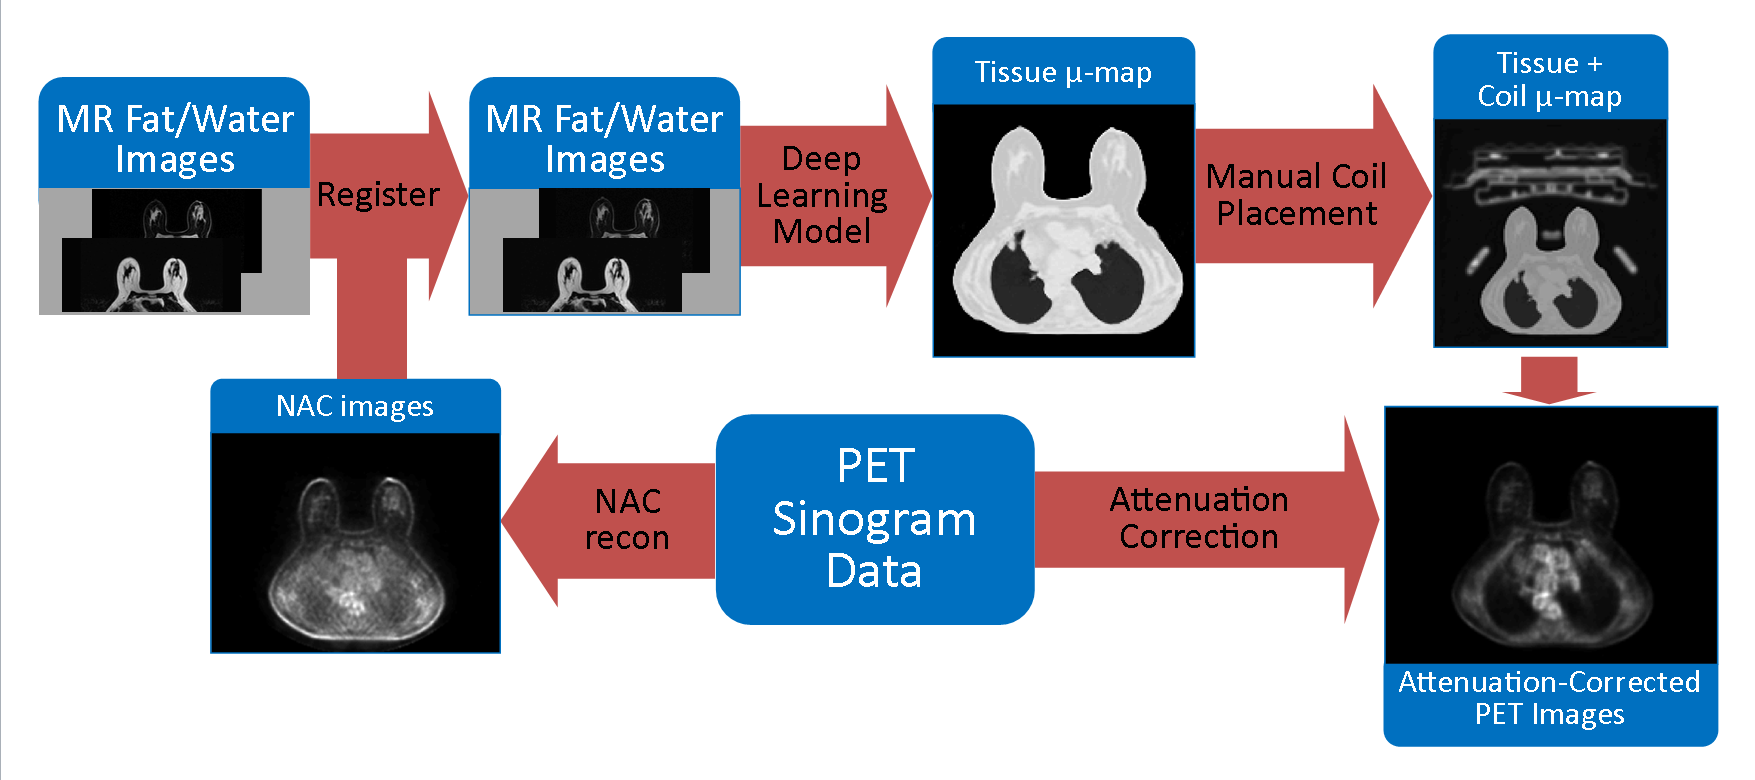
An improved segmentation algorithm was developed to estimate truncation completion, generate the linear attenuation map, and provide training data for a deep learning model. After training the model, the steps of the new workflow were:
- Generate non-attenuation corrected (NAC) images from PET sinogram data
- Co-register MR water and fat images with these NAC images
- Apply a deep learning regression model to MR water/fat images and generate linear attenuation maps
- Add in coil attenuation data in the correct location of the attenuation map
- Insert the new linear attenuation map into the existing PET reconstruction pipeline.
The steps of this workflow are illustrated in Figure 1.
Imaging and Data
11 subjects underwent informed consent and were scanned on a PET/MR scanner (Signa PET/MR, GE Healthcare, Waukesha, WI) in this IRB-approved, HIPAA-compliant study. Subjects were scanned 90 minutes after injection of 18F-FDG, and received a gadolinium contrast injection (0.1 mmol/kg) during the scan session. Non-contrast, two-point Dixon water/fat images used for the vendor-supplied attenuation correction algorithm2 were used to generate the linear attenuation map as described above. For all subjects utilized in this study, the vendor-provided online generation of linear attenuation maps failed due to segmentation errors resulting from image truncation. Target linear attenuation maps were created by a custom algorithm that segmented tissue and lungs and assigned appropriate linear attenuation values. Target data was split into training (60%), validation (20%), and test (20%) sets for independent evaluation of the model. The test data set was kept separate during model training.
Deep Learning Model
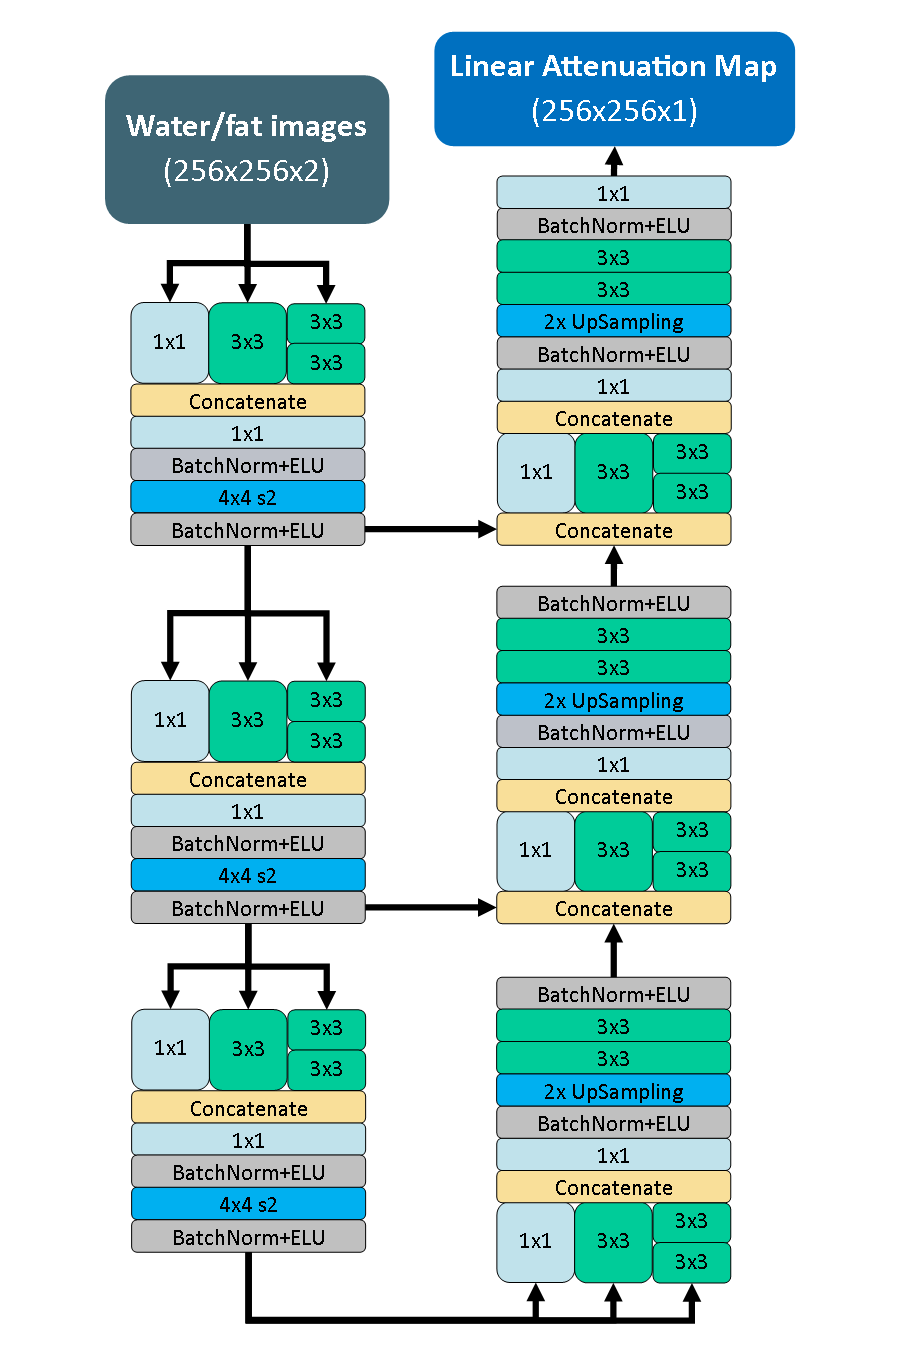
The goals of the deep learning model were to accept MR water/fat images and generate a linear attenuation map as an output. A convolutional neural network designed in the fully convolutional encoder-decoder format with an architecture inspired by the Inception V3 network3 was used for this purpose. The architecture of the model is depicted in Figure 2. The network was constructed in Keras (https://github.com/fchollet/keras) and trained using the ADAM4 optimization method with mean-squared error as a loss function.
Evaluation
Evaluation consisted of comparing the results of the deep learning model to the target linear attenuation maps, and the corresponding attenuation-corrected PET images of each. Comparison was done using Structural Similarity Index (SSIM)5, where a perfect score is 1.
Results
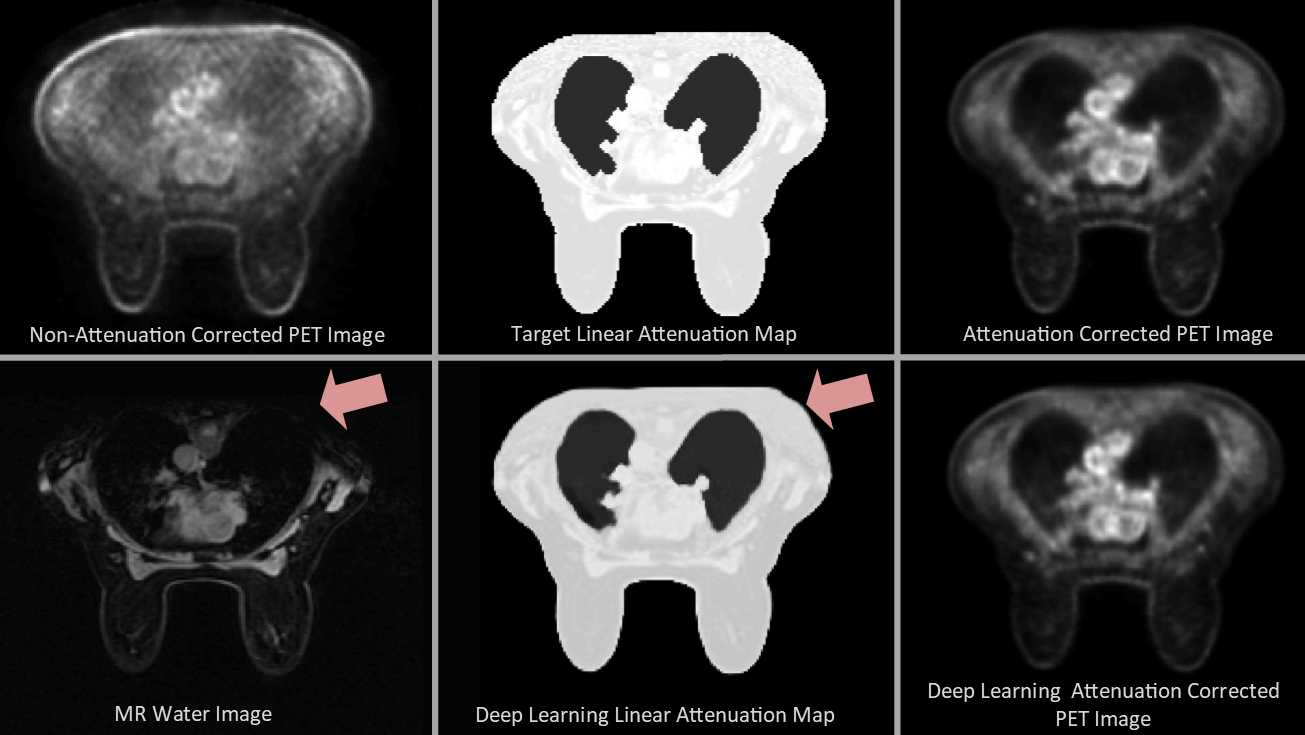
For the cohort of 11 subjects, the deep learning model replicated the target linear attenuation maps in the test set with a mean SSIM of .972 (Min: 0.935, Max: 0.984). PET attenuation-corrected images using both target and deep-learning based linear attenuation maps were generated successfully in all subjects. The attenuation-correction images from a test subject had a mean SSIM of .9982 within the tissue of the subject. Figure 3 shows an example comparison of the resulting attenuation correction maps and reconstructed PET images.Discussion and Conclusion
The inclusion of a deep learning-based approach allows truncation completion of MR images in an efficient and successful manner. The new algorithm allowed successful completion of the PET reconstruction pipeline in all subjects. Note that the bone was not included in the attenuation correction model here, which is known to result in a residual bias of approximately 5%6. Future work will incorporate bone information from CT images to enable improved quantitative PET accuracy and allow an improved gold-standard for comparison.Acknowledgements
The authors would like to acknowledge support from the Department of Radiology at the Authors' institution, the NIH/NCI (T32 CA009206, P30 CA014520), and GE Healthcare.References
1. Berg WA, Madsen KS, Schilling K, Tartar M, Pisano ED, Larsen LH, Narayanan D, Kalinyak JE. Comparative effectiveness of positron emission mammography and MRI in the contralateral breast of women with newly diagnosed breast cancer. American Journal of Roentgenology. 2012;198(1):219–232.
2. Beyer T, Lassen ML, Boellaard R, Delso G, Yaqub M, Sattler B, Quick HH. Investigating the state-of-the-art in whole-body MR-based attenuation correction: an intra-individual, inter-system, inventory study on three clinical PET/MR systems. Magnetic Resonance Materials in Physics, Biology and Medicine. 2016;29(1):75–87.
3. Szegedy C, Vanhoucke V, Ioffe S, Shlens J, Wojna Z. Rethinking the Inception Architecture for Computer Vision. 2015.
4. Kingma DP, Ba J. Adam: A Method for Stochastic Optimization. 2014:1–15.
5. Wang Z, Bovik AC, Sheikh HR, Simoncelli EP. Image quality assessment: From error visibility to structural similarity. IEEE Transactions on Image Processing. 2004;13(4):600–612.
6. Aznar MC, Sersar R, Saabye J, Ladefoged CN, Andersen FL, Rasmussen JH, Lofgren J, Beyer T. Whole-body PET/MRI: The effect of bone attenuation during MR-based attenuation correction in oncology imaging. European Journal of Radiology. 2014;83(7):1177–1183.
Figures