4325
Correlation of Breast Stiffness Measured by Ultrasound with Breast Density Measured on MRI Matched by Using a Prone-Supine Deformation Model1Center for Functional Onco-Imaging, Department of Radiological Sciences, University of California Irvine, Irvine, CA, United States, 2Department of Radiology, E-Da Hospital and I-Shou University, Kaohsiung, Taiwan, 3Department of Radiology, Tzu-Chi General Hospital, Taichung, Taiwan, 4Breast Center, Tzu-Chi General Hospital, Taichung, Taiwan
Synopsis
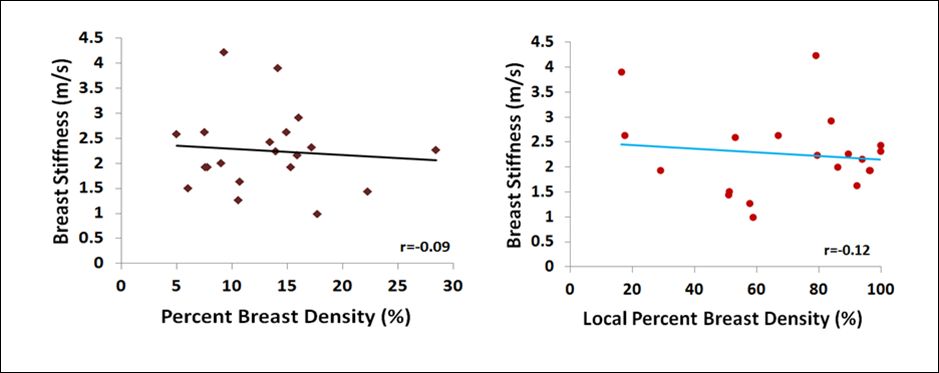
We correlated breast tissue stiffness measured by US elastography with the MR-measured density from the whole breast and the tissue in the US stiffness measurement window. Twenty women were studied, and only the normal breast was analyzed. A finite element model was applied to deform the prone MRI to match with supine US images by using the inversed gravity loaded transformation to locate the corresponding tissue region. There were no correlation between breast stiffness and the whole breast percent density (r=-0.09) and the local percent density (r=-0.12), suggesting that breast density and stiffness may be independent cancer risk factors.
Abstract
Background and Purposes: Mammographic density (MD) is a well-documented risk factor for developing breast cancer. Histological studies have shown that high MD tissue had a significantly greater proportion of stroma, collagen, epithelium, and increased proteoglycan expression, compared to low MD tissue 1, but how they are related to cancer risk is not clear. Breast stiffness, reflecting the physical forces generated by interactions between cells, and between cells and the extracellular matrix, influences a variety of cell functions 2 and is also associated with breast cancer risk 3, 4. Tissue stiffness can be evaluated by ultrasound (US) elastography methods. In recent years, US elastography has been used for the clinical diagnosis and evaluation of breast tumors. US elastography of normal breast tissue is less studied. Since both high MD and stiffness are associated with increased breast cancer risk, it is of interest to investigate if a direct link exists between high breast density and high tissue stiffness. The purpose of this study is to compare tissue stiffness measured from the dense area in US image with the MR-measured whole breast volumetric density and the local density from the region where the US stiffness was measured. The association between density and stiffness was investigated to help understanding whether they are dependent or independent risk factors.
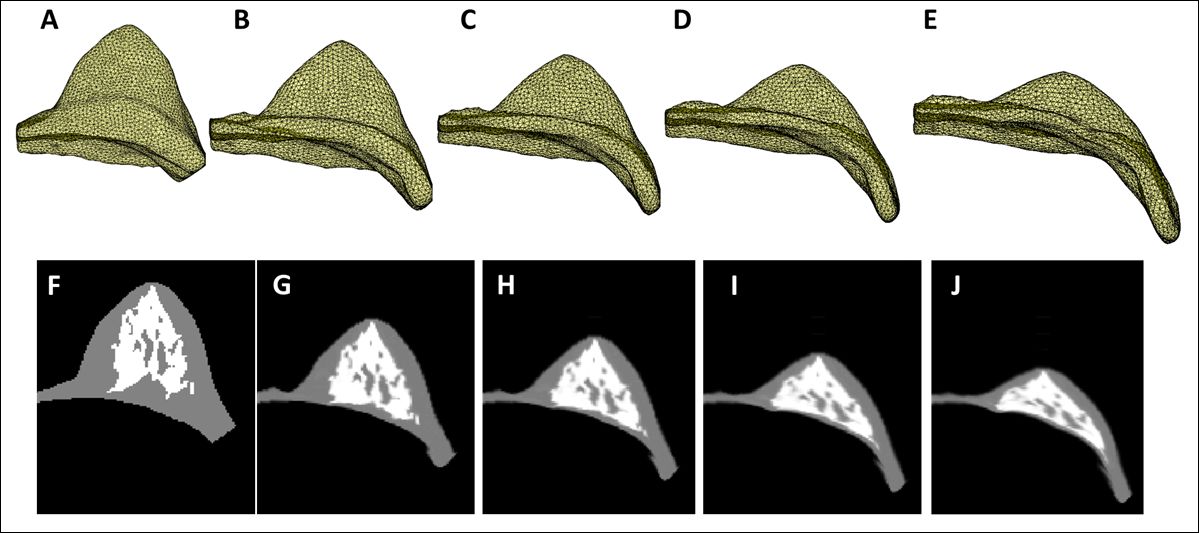
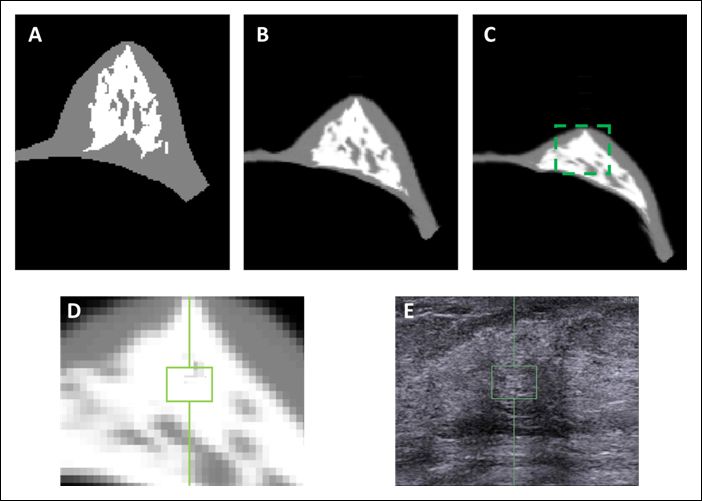
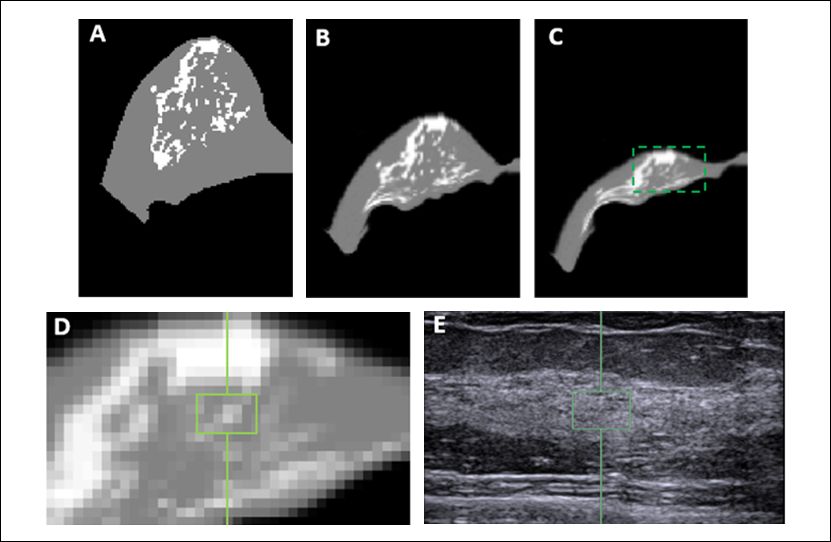
Materials and Methods: MRI and whole breast ultrasound were performed in 20 patients (age range 24-78, mean 51.7 y/o) with suspicious unilateral lesions. The subject received routine US, US elastography, and breast MRI of the bilateral breasts on the same day. MRI was performed on a 1.5 Tesla Siemens scanner by using a 16-channel phased-array coil. The breast volume and density were measured on pre-contrast spin echo T1W images (TR=726 msec; TE=8.2 msec; field of view=320 mm; slide thickness=3 mm). Only the contralateral normal breast tissue was analyzed. US elastography of the breast tissue stiffness was measured from the echogenic homogeneous fibroglandular tissues in the central breast area underneath the nipple with a Siemens ACUSON S2000TM ultrasound system. The mean depth of the ROI from the skin surface was 1.41±0.38cm (range 0.6cm ~2.2cm). The system adopts the Virtual Touch Tissue Imaging Quantification (VTIQ) technology to calculate shear wave speed in unit of (m/s). To quantify breast density, an automatic, computer algorithm-based, segmentation method was used to segment the whole breast and fibroglandular tissues on 3D MRI 5. Bias-field correction and fuzzy-c-means algorithm was applied to separate the fat from the fibroglandular tissue 6. After the breast segmentation, a finite element model was applied to deform the prone MRI to match the supine US images, by using the inversed gravity loaded transformation (Figure 1). After matching, the tissue window used in US elastography measurement could be located on the deformed supine MRI to measure the breast density in the corresponding region (Figures 2 and 3). The Pearson’s correlation was applied to assess the association between US-measured breast stiffness and patients’ age, breast volume, whole breast percent density, and local percent density.
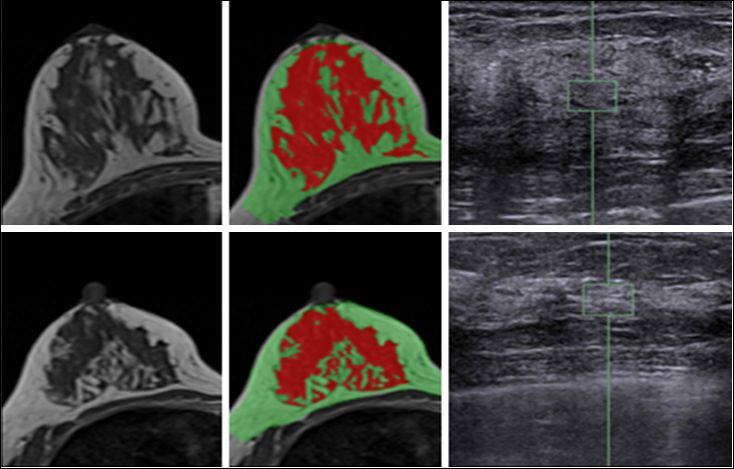
Results: The mean breast tissue stiffness was 2.3±0.8 m/s (range 1.0 to 4.2 (m/s)). The breast volume of the 20 women ranged from 320.7cm3 to 880.3cm3 (mean±STD, 584.4±170.4 cm3), and the fibroglandular tissue volume ranged from 33.4cm3 to 161.4cm3 (mean±STD, 72.7±31.3cm3). The percent breast density of the 20 women ranged from 5.0% to 28.4% (mean±STD, 13.1±5.8%). The percent breast density was negatively correlated with age (r=-0.56), and breast stiffness was weakly correlated with age (r=0.29). Overall, there was no correlation between breast stiffness and breast volume (r=-0.14), or the whole breast percent density (r=-0.09). There was also no correlation between breast tissue stiffness and the local percent density measured from the corresponding region (r=-0.12) (Figure 4). Figure 5 shows two case examples.
Conclusions: In this study we correlated the US-measured breast stiffness with MR-measured whole breast and local percent density. The stiffness was measured from echogenic homogeneous fibroglandular tissues by US elastography. An automatic, computer algorithm-based, segmentation method was used to segment the whole breast and fibroglandular tissues on MRI. A finite element model was applied to transform prone MRI to supine view to match with US images, by using the inversed gravity loaded transformation. No correlation was found between US-stiffness and the whole breast or local percent density, suggesting that breast stiffness is not solely related to the amount of fibroglandular tissue, and further studies are needed to investigate whether they are dependent or independent cancer risk factors.
Acknowledgements
This work was supported in part by NIH/NCI Grant No. R01 CA127927, R21 CA170955, and R03 CA136071.References
1. Li T. Cancer Epidemiol Biomarkers Prev. 2005;14:343–9. ; 2. Butcher DT. Nat Rev Cancer. 2009;9:108–22. ; 3. Kass L. Int J Biochem Cell Biol. 2007;39:1987–94. ; 4. Boyd NF. PLoS One. 2014 Jul 10;9(7):e100937. ; 5. Lin M. Med Phys. 2013 Dec;40(12):122301. ; 6. Nie K. Med Phys. 2008 Dec;35(12):5253-62.Figures