4324
3D MRI for Quantitative Analysis of Quadrant Percent Density (QPD): Correlation with Location of Breast Cancer Growing in Different Quadrants1Center for Functional Onco-Imaging, Department of Radiological Sciences, University of California Irvine, Irvine, CA, United States, 2Department of Radiology, E-Da Hospital and I-Shou University, Kaohsiung, Taiwan, 3Department of Radiology, Tzu-Chi General Hospital, Taichung, Taiwan, 4Breast Center, Tzu-Chi General Hospital, Taichung, Taiwan
Synopsis
We applied an MR-based quadrant percent density (QPD) method to investigate the association between the occurrence of cancer and the amount of dense tissue. Computer-aided method was applied to segment the breast and dense tissue, and then a breast was divided into four quadrants using nipple, centroid, and chestwall as the anatomic landmarks. In a total of 206 women, 88 (42.7%) had cancer growing in the upper-outer quadrant. Only 42 (20.4%) women had cancer growing in the quadrant with the highest QPD, suggesting that the amount of dense tissue cannot explain the disproportional occurrence of breast cancer in different quadrants.
Abstract
Background and Purposes: Breast cancer occurs more frequently in the upper-outer (UO) quadrant, but whether this higher cancer incidence is related to the greater amount of dense tissue is not known. Quadrant or local breast density measured on mammography has been proposed before1-3. Since mammography acquires 2-dimensional projection images, it cannot truly provide a reliable assessment of density in four quadrants. Breast MRI acquires 3-dimensional volumetric images that show a good contrast between fibroglandular and fatty tissues. Computer-aided segmentation methods are available to be applied to measure breast volume and fibroglandular tissue volume quantitatively4, as well as to separate a breast into four quadrants for measurement of quadrant density5. Morphologically, bilateral breasts in a healthy woman are thought to be symmetrical6. The purpose of this study is to investigate the association between cancer incidence and density, by correlating the quadrant location of tumor in the diseased breast with the quadrant percent breast density (QPD) in the contralateral normal breast.
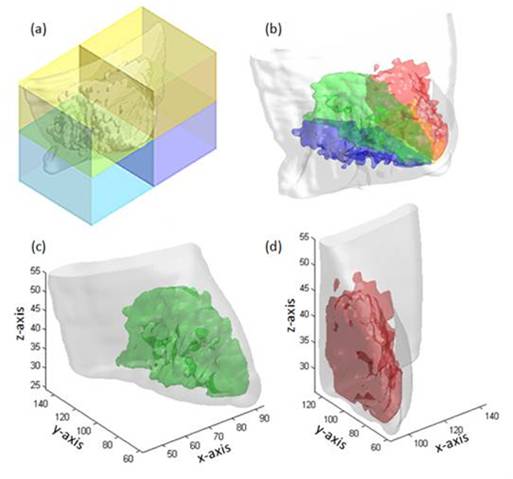
Materials and Methods: In total, 206 women (37 Western and 169 Asian women, mean age 46) with unilateral breast cancer were studied. The tumor was segmented and the quadrant location of the breast cancer in the diseased breast was determined using a computer-aided method based on the DCE-MRI sequence. The MR images of the contra-lateral normal breast were used for overall and quadrant breast density quantification. The MR density measurement was done with a template-based automatic segmentation method 4, by using the chest body region on a middle slice as the template. Within the chest template, three body landmarks (thoracic spine and bilateral boundary of the pectoralis muscle) were identified for performing the initial V-shape cut to determine the posterior lateral boundary of the breast. The chest template was mapped to each subject's image space to obtain a subject-specific chest model for exclusion. N3+FCM algorithm was used to segment fibroglandular tissue and fatty tissue. The segmented breast and fibroglandular tissue from all slices were then reconstructed into a 3D model. The orientation of the breast was corrected based on the centroid of the breast and the chestwall 5, and then the nipple was used as the anatomic landmark to divide the breast into four quadrants: Upper-Outer (UO), Upper-Inner (UI), Lower-Outer (LO), Lower-Inner (LI). After the breast quadrants and the tumor were segmented, the location of the tumor could be determined. If more than 50% of the tumor was in a specific quadrant, that quadrant was determined as the dominant quadrant. In this study, only tumors located in a clear dominant quadrant were included in the analysis.
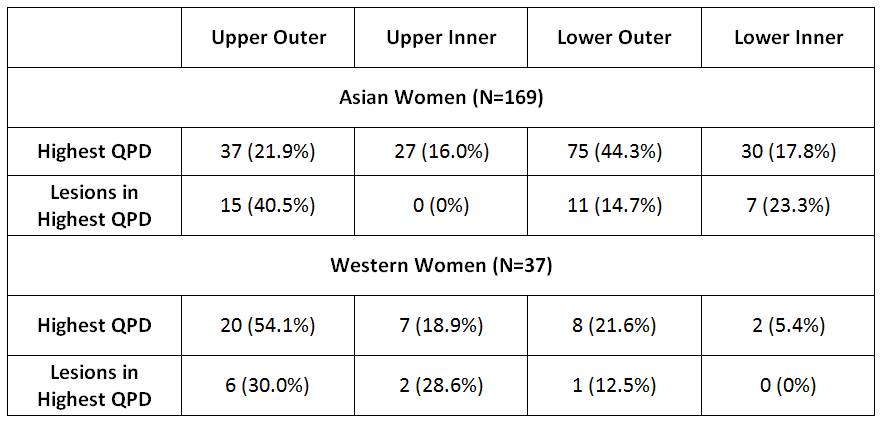
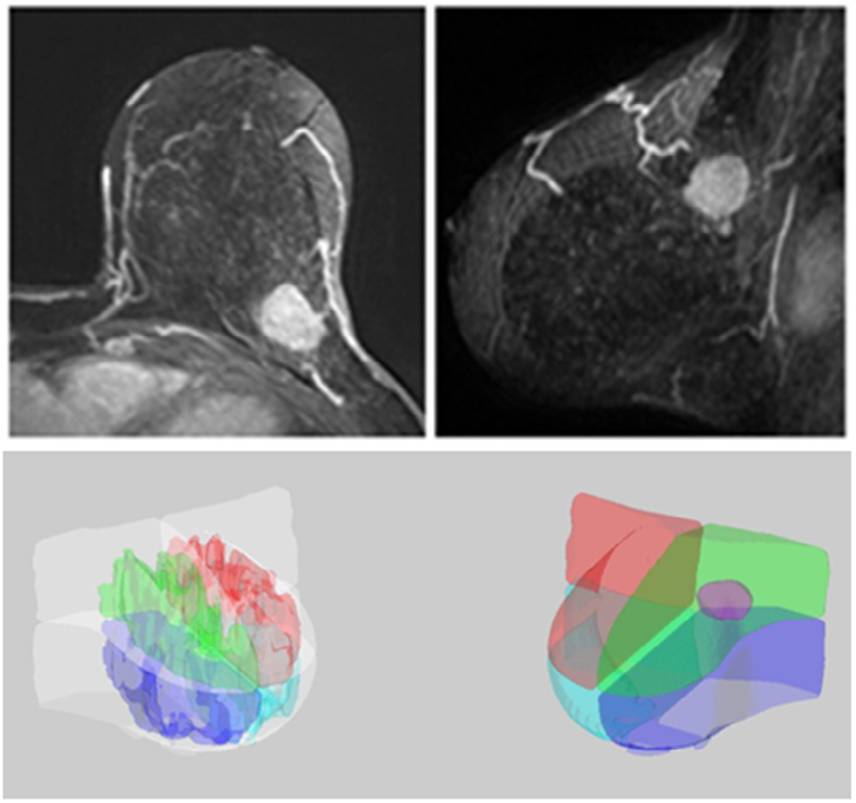
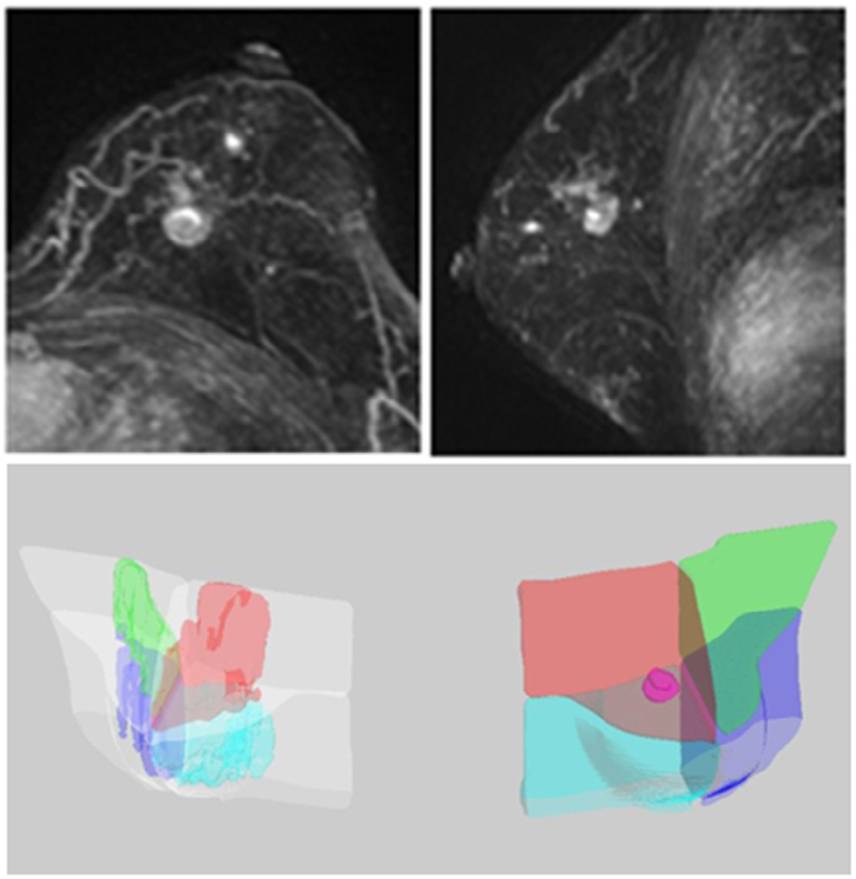
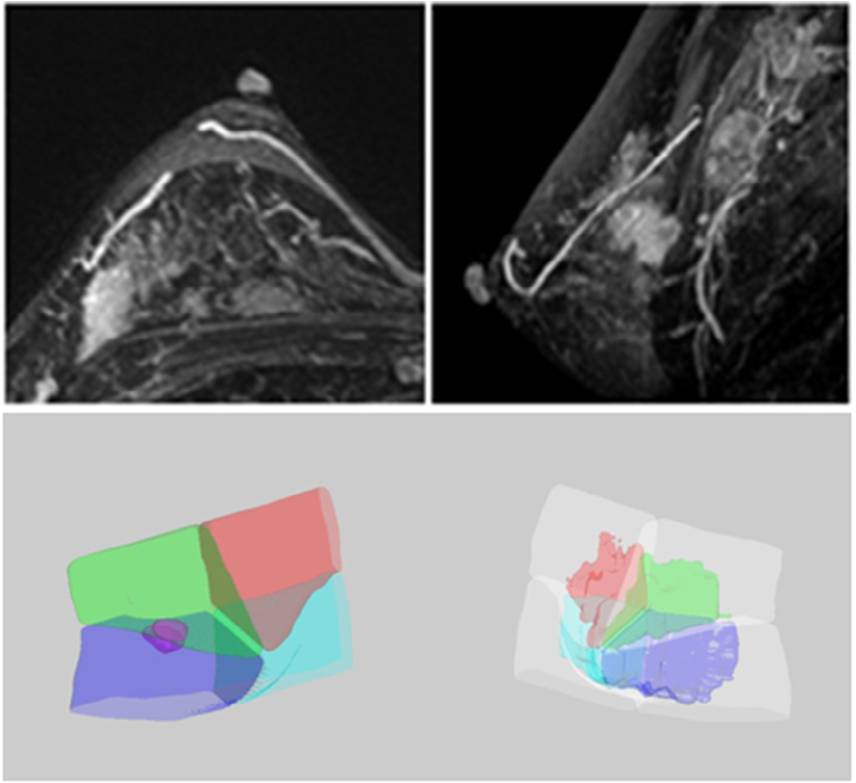
Results: Breast cancer is more likely to grow in the upper-outer quadrant (88, 42.7%), a tendency observed in both Asian and Western women (43.2% vs. 40.6%). Figure 1 illustrates how the breast tissue and fibroglandular tissue are divided into four quadrants. Table 1 shows the distribution percentage of the highest QPD among 4 quadrants, and the percentage of lesions growing in the highest QPD. The highest QPD was noted most frequently in the upper-outer (UO) quadrant in Western women (20/37=54.1%), but in the lower-outer (LO) quadrant in Asian women (75/169, 44.3%). Overall, in a total of 206 women, only 42 (42/206, 20.4%) had breast cancer occurring in the breast quadrant with the highest QPD, with 21 in the UO quadrant. Figures 2-4 show three case examples of tumors occurring in different quadrants, two in the highest QPD (Figures 2 and 3), and one not in the highest QPD (Figure 4).
Conclusions: We used a recently developed method to quantify the QPD based on MR images, and then to correlate the occurrence of tumor with the quadrant density. The results show that breast cancer grows more frequently in the upper-outer quadrant, in both Asian and western women. The finding is consistent with most of the literature reports. The density in the UO quadrant was the highest in the Western women; but the Asian women had the highest QPD in the LO quadrant. In the combined analysis, only 20.4% of women had breast cancer growing in the breast quadrant with the highest QPD. The results showed that the development of breast cancer in a specific quadrant could not be explained by the density in that quadrant, and further studies are needed to find the biological reasons accounting for the higher breast cancer incidence in the UO quadrant, and the disproportional occurrence of breast cancer in different quadrants.
Acknowledgements
This work was supported in part by NIH/NCI grants R01 CA127927, R21 CA170955 and R03 CA136071.References
1. Ursin G. Breast Cancer Res. 2005;7(5):R605–8. ; 2. Vachon CM. Cancer Epidemiol Biomarkers Prev. 2007;16(1):43-9. ; 3. Chan S. BMC Cancer. 2017 Apr 17;17(1):274. 4. Lin M. Med Phys. 2013;40(12):122301. ; 5. Fwu PT. Transl Oncol. 2015;8(4):250-7. 6. Alterson R. Phys Med Biol 2003;48:3431-43.Figures