4322
Are the thousands of images generated by each ultrafast dynamic contrast enhancement (DCE) MRI of breast cancer effectively summarized by color intensity projection (CIP) images?1VU University Medical Center, Amsterdam, Netherlands
Synopsis
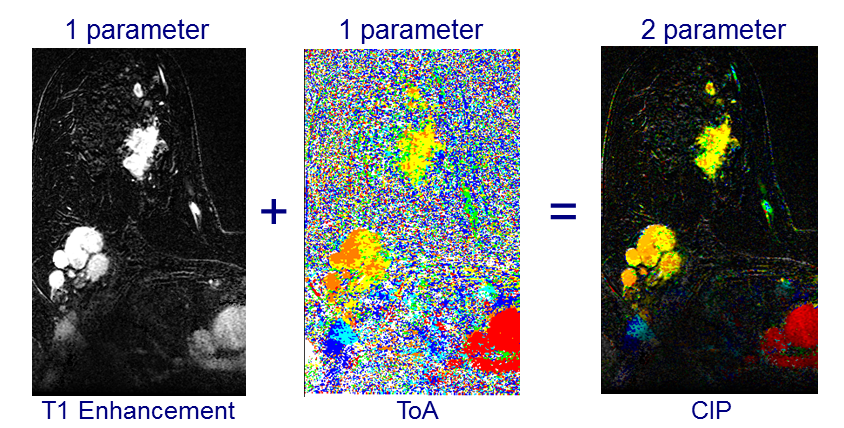
Ultrafast dynamic contrast enhancement (DCE) is a MRI sequence that, when used standalone, can serially screen for breast cancer in 2 minutes. However, each acquisition generates thousands of 2D images in a 4D stack. Color intensity projections (CIP) images are 2 parameter color images that encode the time of arrival (ToA) of contrast agent in the hue (red, orange, yellow, green, cyan, blue) and the amount of contrast enhancement in the brightness. A CIP image of each ultrafast slice provides an informative summary to radiologists with the same sensitivity and specificity to malignancies as the ultrafast 4D stack.
Introduction
Current protocols screening for breast cancer take about 20 minutes of MRI acquisition time. Abbreviated protocols are being developed that take less than 5 minutes [KuhlCK2014, HeacockL2016, MachidaY2016, MangoVL2016, MoschettaM2016] for screening women at high risk of breast cancer [KuhlCK2005, LeachMO2005, KuhlCK2010, SardanelliF2011, HeijnsdijkEA2012, PassaperumaK2012, ObdeijnIM2014, EmausMJ2015, ZelstJCM2017]. The standalone 4D ultrafast DCE MRI sequence [BoetesC1994, SardanelliF2000, SaranathanM2012, LeY2012, MannRM2014, PlatelB2014, AbeH2016, MusRD2017] takes about 4 minutes including localizers but generates thousands of images per acquisition placing a burden on radiologists. The purpose of this study was to assess whether color intensity projections (CIP) images [CoverKS2007] are an effective summary of the ultrafast 4D stack of images.Methods
The 115 second ultrafast DCE sequence acquired 19 consecutive frames every 4.26 seconds with 152 slices per frame yielding a 4D stack with 2,888 2D images for each of water and fat. For each of the 89 patients in the study, two radiologists - with 8 and 4 years of experiences reading breast cancer MRIs respectively - recorded a BIRADS [DOrsiCJ2013] using only the CIP images first, and subsequently using both the CIP images and the 4D stack. No prior MRI images were used in the study. A total of 26 patients had malignancies. The p-value for the CIP and 4D sensitivities and specificities were calculated using the Fisher exact test [EmausMJ2015].
CIP summarizes a time series of greyscale images into a single color image by encoding the time of arrival (ToA) of contrast agent at each voxel in the hue (red, orange, yellow, green, cyan, blue) and the amount of contrast agent in the brightness. The time of arrival (ToA) of contrast agent for each voxel was defined as the frame which had the largest increase in signal from the previous frame (Figure 1). The enhancing of the aortic arch was defined as the zero frame and indicated with the red hue. The CIP images for the study were uploaded to clinical PACS so they could be read using the same PACS workstation as the clinical images but clearly labelled for research only.
Results
For reader 1, the CIP and 4D sensitives were 96% and 96% (p=1.0) with specificities of 59% and 70% (p=0.26) respectively. The statistics for reader 2 were 96% and 100% (p=1.0) with 62% and 71% (p=0.34) specificities, respectively. Therefore, there was no statistically significant difference between CIP and 4D stack, in terms of the sensitivity and specificity, when distinguishing between malignancies and benign tumors. The readers could not assign a BIRADS score to CIP in 1 and 5 patients respectively, primarily because of enhancing background [GiessCS2014]. These undefined BIRADS scores resulted in the slightly lower sensitivities and specificities provided above.
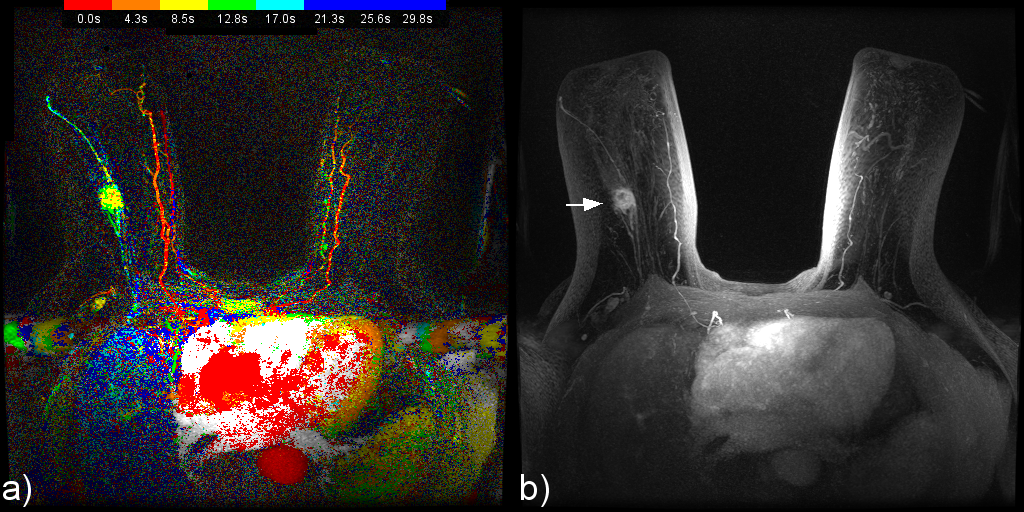
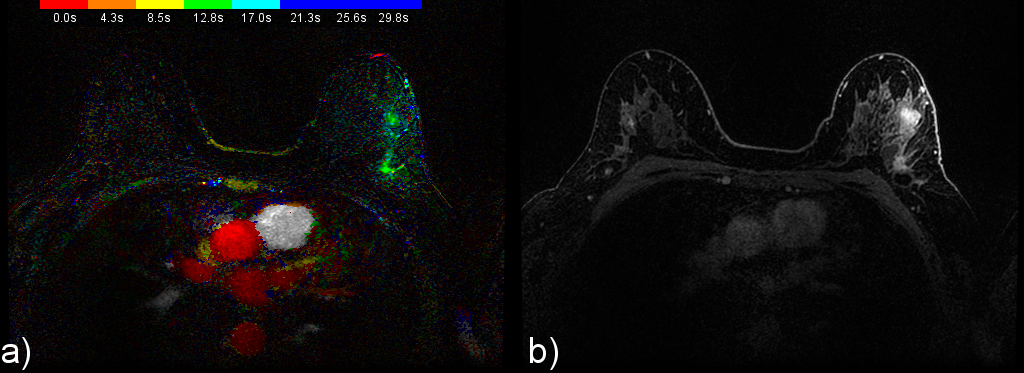
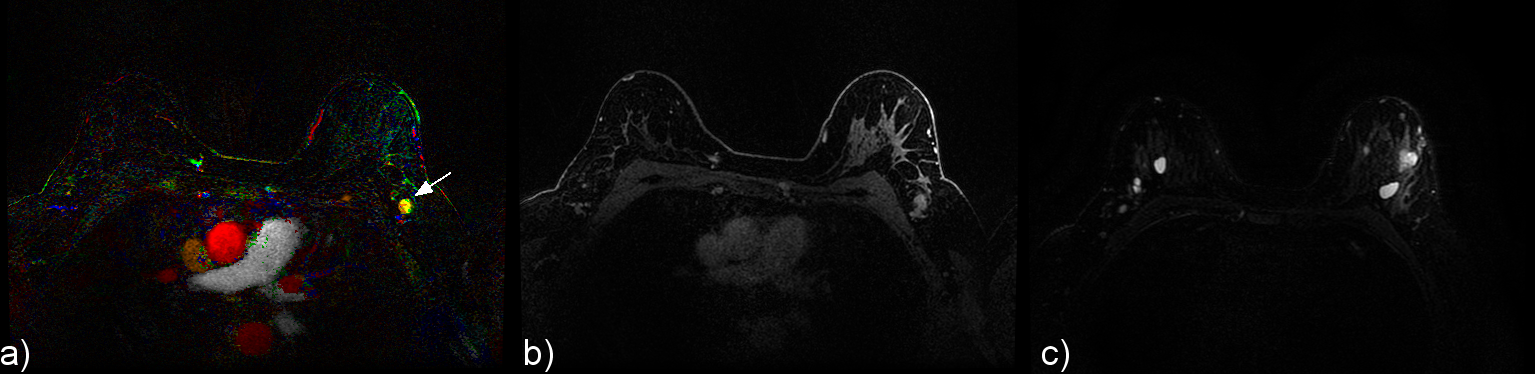
Figures 2, 3 and 4 provide examples of CIP for two patients.
Discussion
As the current study shows, CIP provides an effective summary of the thousands of images provided by each ultrafast acquisition. For each voxel, the encoding of the ToA in the hue combined with the amount of contrast agent seems to provide much of the information required by radiologist to detect malignancies while recognizing benign lesions. However, as with any processed version of the ultrafast 4D stack, the original 4D stack should always be reviewed for breast cancer screening with CIP only providing supplementary information.
While the current study was conducted without prior DCE images to aid the radiologists, with serial screening prior DCE images are readily available. Prior DCE images should significantly improve the specificity of the standalone ultrafast sequence found in the current study. The current full diagnostic protocols (FDP) for MRI screening of breast cancer has additional sequences to improve specificity when prior DCE images are not available [AbramoviciG2011]. The FDP typically includes both pre and post contrast high resolution T1 sequences, a high resolution T2 sequence, and/or a DWI sequence, and more recently, an ultrafast sequence.
While the ultrafast sequence runs in about 2 minutes, if used standalone for serial screening for breast cancer, inclusion of the localizers would bring the total acquisition time to about 4 minutes.
Conclusion
At one color image per slice, rather than the 10 or 20 greyscale images for the ultrafast 4D stack, and with the same sensitivity and specificity, CIP provides an effective summary of the ultrafast images for screening for breast cancer. CIP images may provide an effective assist to radiologists reading the thousands of images generated by each ultrafast DCE MRI sequence, especially when only PACS workstations - without advanced viewing tools for MRIs of breast cancer - are available.Acknowledgements
Funded by Cancer Center Amsterdam.References
AbeH2016. Abe H, Mori N, Tsuchiya K, Schacht DV, Pineda FD, Jiang Y, Karczmar GS. Kinetic Analysis of Benign and Malignant Breast Lesions With Ultrafast Dynamic Contrast-Enhanced MRI: Comparison With Standard Kinetic Assessment. AJR Am J Roentgenol. 2016;207:1159-1166.
AbramoviciG2011. Abramovici G, Mainiero MB. Screening breast MR imaging: comparison of interpretation of baseline and annual follow-up studies. Radiology. 2011;259:85-91.
BoetesC1994. Boetes C, Barentsz JO, Mus RD, van der Sluis RF, van Erning LJ, Hendriks JH, Holland R, Ruys SH. MR characterization of suspicious breast lesions with a gadolinium-enhanced TurboFLASH subtraction technique. Radiology 1994;193:777-781.
CoverKS2007. Cover KS, Lagerwaard FJ, van den Berg R, Buis DR, Slotman BJ. Color intensity projection of digitally subtracted angiography for the visualization of brain arteriovenous malformations. Neurosurgery 2007;60:511–515.
DOrsiCJ2013. D'Orsi CJ, Sickles EA, Mendelson EB, Morris EA, Bassett LW, Bohm-Velz M, Berg WA, Comstock CE, Lee CH.. ACR BI-RADS Atlas, Breast Imaging Reporting and Data System. Reston, VA, American College of Radiology; 2013.
EmausMJ2015. Emaus MJ, Bakker MF, Peeters PH, Loo CE, Mann RM, de Jong MD, Bisschops RH, Veltman J, Duvivier KM, Lobbes MB, Pijnappel RM, Karssemeijer N, de Koning HJ, van den Bosch MA, Monninkhof EM, Mali WP, Veldhuis WB, van Gils CH. MR Imaging as an Additional Screening Modality for the Detection of Breast Cancer in Women Aged 50-75 Years with Extremely Dense Breasts: The DENSE Trial Study. Design Radiology 2015 Nov;277:527-537.
GiessCS2014. Giess CS, Yeh ED, Raza S, Birdwell RL. Background parenchymal enhancement at breast MR imaging: normal patterns, diagnostic challenges, and potential for false-positive and false-negative interpretation. Radiographics. 2014;34:234-47.
HeacockL2016. Heacock L, Melsaether AN, Heller SL, Gao Y, Pysarenko KM, Babb JS, Kim SG, Moy L. Evaluation of a known breast cancer using an abbreviated breast MRI protocol: Correlation of imaging characteristics and pathology with lesion detection and conspicuity. Eur J Radiol. 2016;85:815-823.
HeijnsdijkEA2012. Heijnsdijk EA, Warner E, Gilbert FJ, Tilanus-Linthorst MM, Evans G, Causer PA, Eeles RA, Kaas R, Draisma G, Ramsay EA, Warren RM, Hill KA, Hoogerbrugge N, Wasser MN, Bergers E, Oosterwijk JC, Hooning MJ, Rutgers EJ, Klijn JG, Plewes DB, Leach MO, de Koning HJ. Differences in natural history between breast cancers in BRCA1 and BRCA2 mutation carriers and effects of MRI screening-MRISC, MARIBS, and Canadian studies combined. Cancer Epidemiol Biomarkers Prev. 2012;21:1458-68.
KuhlCK2005. Kuhl CK, Schrading S, Leutner CC, Morakkabati-Spitz N, Wardelmann E, Fimmers R, Kuhn W, Schild HH. Mammography, breast ultrasound, and magnetic resonance imaging for surveillance of women at high familial risk for breast cancer. J Clin Oncol 2005;23:8469-76.
KuhlCK2010. Kuhl C, Weigel S, Schrading S, Arand B, Bieling H, König R, Tombach B, Leutner C, Rieber-Brambs A, Nordhoff D, Heindel W, Reiser M, Schild HH. Prospective multicenter cohort study to refine management recommendations for women at elevated familial risk of breast cancer: the EVA trial. J Clin Oncol 2010;28:1450-1457.
KuhlCK2014. Kuhl CK, Schrading S, Strobel K, Schild HH, Hilgers RD, Bieling HB. Abbreviated breast magnetic resonance imaging (MRI): first postcontrast subtracted images and maximum-intensity projection-a novel approach to breast cancer screening with MRI. J Clin Oncol. 2014;32:2304-2310.
LeY2012. Le Y, Kroeker R, Kipfer HD, Lin C. Development and evaluation of TWIST Dixon for dynamic contrast-enhanced (DCE) MRI with improved acquisition efficiency and fat suppression. J Magn Reson Imaging 2012;36:483-491.
LeachMO2005. Leach MO, Boggis CR, Dixon AK, Easton DF, Eeles RA, Evans DG, Gilbert FJ, Griebsch I, Hoff RJ, Kessar P, Lakhani SR, Moss SM, Nerurkar A, Padhani AR, Pointon LJ, Thompson D, Warren RM; MARIBS study group. Screening with magnetic resonance imaging and mammography of a UK population at high familial risk of breast cancer: a prospective multicentre cohort study (MARIBS). Lancet. 2005 May 21-27;365(9473):1769-78.
MachidaY2016. Machida Y, Shimauchi A, Kanemaki Y, Igarashi T, Harada M, Fukuma E. Feasibility and potential limitations of abbreviated breast MRI: an observer study using an enriched cohort. Breast Cancer 2016;doi:10.1007/s12282-016-0718-z.
MangoVL2016. Mango VL, Morris EA, David Dershaw D, Abramson A, Fry C, Moskowitz CS, Hughes M, Kaplan J, Jochelson MS. Abbreviated protocol for breast MRI: are multiple sequences needed for cancer detection? Eur J Radiol. 2015;84:65-70. MannRM2014.
Mann RM, Mus RD, van Zelst J, Geppert C, Karssemeijer N, Platel B. A novel approach to contrast enhanced breast magnetic resonance imaging for screening high-resolution ultrafast dynamic imaging. Invest Radiol. 2014;49:579-585.
MusRD2017. Mus RD, Borelli C, Bult P, Weiland E, Karssemeijer N, Barentsz JO, Gubern-Mérida A, Platel B, Mann RM. Time to enhancement derived from ultrafast breast MRI as a novel parameter to discriminate benign from malignant breast lesions. Eur J Radiol. 2017;89:90-96.
MoschettaM2016. Moschetta M, Telegrafo M, Rella L, Stabile Ianora AA, Angelelli G. Abbreviated Combined MR Protocol: A New Faster Strategy for Characterizing Breast Lesions. Clin Breast Cancer 2016;16:207-211.
ObdeijnIM2014. Obdeijn IM, Winter-Warnars GA, Mann RM, Hooning MJ, Hunink MG, Tilanus-Linthorst MM. Should we screen BRCA1 mutation carriers only with MRI? A multicenter study. Breast Cancer Res Treat 2014;144:577-582.
PassaperumaK2012. Passaperuma K, Warner E, Causer PA, Hill KA, Messner S, Wong JW, Jong RA, Wright FC, Yaffe MJ, Ramsay EA, Balasingham S, Verity L, Eisen A, Curpen B, Shumak R, Plewes DB, Narod SA. Long-term results of screening with magnetic resonance imaging in women with BRCA mutations. Br J Cancer 2012;107:24-30.
PlatelB2014. Platel B, Mus R, Welte T, Karssemeijer N, Mann R. Automated characterization of breast lesions imaged with an ultrafast DCE-MR protocol. IEEE Trans Med Imaging 2014;33:225-232. SardanelliF2000. Sardanelli F, Rescinito G, Giordano GD, Calabrese M, Parodi RC. MR dynamic enhancement of breast lesions: high temporal resolution during the first-minute versus eight-minute study. J Comput Assist Tomogr. 2000; 24:724-731.
SaranathanM2012. Saranathan M, Rettmann DW, Hargreaves BA, Clarke SE, Vasanawala SS. DIfferential Subsampling with Cartesian Ordering (DISCO): a high spatio-temporal resolution Dixon imaging sequence for multiphasic contrast enhanced abdominal imaging. J Magn Reson Imaging 2012;35:1484-1492.
ZelstJCM2017. van Zelst JCM, Mus RDM, Woldringh G, Rutten MJCM, Bult P, Vreemann S, de Jong M, Karssemeijer N, Hoogerbrugge N, Mann RM. Surveillance of Women with the BRCA1 or BRCA2 Mutation by Using Biannual Automated Breast US, MR Imaging, and Mammography. Radiology. 2017;285(2):376-388.
Figures