4320
Repeatability of 3D MR Fingerprinting Measurements in Normal Breast TissueAnanya Panda1, Yong Chen2, Satyam Ghodasara3, Katherine Wright1, Nicole Seiberlich4,5, Mark Alan Griswold1,4,5, and Vikas Gulani1,4,5
1Radiology, Case Western Reserve University, Cleveland, OH, United States, 2Radiology, University of North Carolina, Chapel Hill, NC, United States, 3Case Western School of Medicine, Cleveland, OH, United States, 4Radiology, University Hospitals Cleveland Medical Center, Cleveland, OH, United States, 5Biomedical Engineering, Case Western Reserve University, Cleveland, OH, United States
Synopsis
3D Breast Magnetic Resonance Fingerprinting (MRF) allows simultaneous breast tissue T1 and T2 mapping. In this study, same session repeatability of 3D MRF technique in normal breast tissue was evaluated (test/retest 10 minutes apart) and in two consecutive visits. The within subject coefficient of variance (wCV) for two visit scans was < 6% for T1 and < 5% for T2. The wCV for test-retest scan for T1 was <5% and for T2 was 6.5%. One-week repeatability of 3D MRF was good for both T1 and T2 (ICC T1: 0.81 T2: 0.88 at second visit). These variations are smaller than observed inter-subject variability. Thus breast MRF may be useful for longitudinal patient follow-up.
Target Audience
Basic and clinical scientists interested in quantitative imaging and breast MRI.Introduction
3D-Magnetic Resonance Fingerprinting (MRF) is a recently developed technique which provides volumetric breast coverage and allows simultaneous mapping of T1 and T2 relaxation times of breast tissue in a clinically feasible scan1. The T1 and T2 relaxation times for normal breast tissue obtained from 3D MRF have been comparable to literature values at 3T2. Clinically, measurements obtained from 3D MRF may be useful in lesion characterization or assessment of treatment response. However, in order to interpret the T1 and T2 in tumors and change after treatment, it is important to understand the repeatability of this technique in normal breast tissue. The purpose of this work is to evaluate 3D breast MRF test-retest repeatability in the same visit and across two different visits in normal breast tissue.Methods
In this IRB approved study, 12 healthy pre-menopausal volunteers were scanned with 3D MRF twice within 7-15 days. In addition, 5 volunteers also consented to a test-retest scan in the same sitting, in which 3D MRF was done before and after repositioning with a 10 minute scan interval. All scans were performed on a 3T scanner (Verio, Siemens) using an 8-channel breast coil. The 3D MRF sequence was based on a FISP acquisition with a fat-saturation module1. Other imaging parameters included: FOV=40×40 cm; matrix size 256×256; slice thickness 3 mm; number of partitions, 48; partial Fourier in the partition direction, 6/8. The overall acquisition time for 48 partitions was 5.5 minutes. The 3D MRF partition with the largest area of normal breast tissue in that partition was selected. Region of Interests (ROIs) were manually drawn by one radiologist (7 years radiology experience). Separate ROIs were drawn for right and left breast (Figure 1). For retest and repeatability analysis, ROIs were drawn on the partition showing anatomy of breast tissue as the reference scan. The mean T1 and T2 values from all voxels within each ROI were obtained. For both test-retest (n = 5) and two-visit (n = 12) repeatability, the between-subject coefficient of variance (bCV), and within-subject coefficient of variance (wCV) were computed for both breasts. Intraclass correlation coefficient (ICC) and coefficient of repeatability (CR) were also estimated for both breasts.Results
The mean age was 28 years, median age 29 years, range 22-33 years. Table 1 summarizes all results for two-visit as well as test-retest repeatability analysis. Figure 2 shows relationship of T1 and T2 values between visit 1 and visit 2. Figure 3 shows Bland-Altman plots for two-visit repeatability for all ROIs in both breasts. While bCV was in the range of 10-15% (Table 1), the wCV was 5.5-5.7% for T1 and 4.3-4.8% for T2. Agreement was good-to-excellent for both T1 and T2 (ICC > 0.75). Figure 3 shows test-retest relationship for T1 and T2 for both breasts. Again the bCV was higher but the wCV was within 3-7% for T1 and T2 (Table 1).Discussion
This work shows the repeatability of 3D MRF measurements in a single-institution setting. The wCV for breast MRF is comparable or smaller than wCV of ADC (5-11%) reported previously3,4,5. The higher bCV indicates a larger inter-subject variation either due to difference in breast tissue composition or scanning in different phases of hormonal cycles across different subjects.. While repeat scans were not confined to a particular phase of menstrual cycle, the high ICC and low wCV suggests that the values are repeatable across different cycles, though further work is needed. Thus 3D MRF may be useful in longitudinal follow-up of individual subjects and affect size greater than 7% ought to be measurable in longitudinal follow-ups.Conclusion
3D MRF measurements in normal breast tissue are repeatable across various scan timings and may be useful in clinical applications in breast imaging.Acknowledgements
Research Support: NIH grants 1R01DK098503, 1R00EB016728 and Siemens HealthineersReferences
1. Chen Y, et al. 3D Magnetic Resonance Fingerprinting for Quantitative Breast Imaging,, Abstract 0399, 24th ISMRM, 2016. 2. Rakow-Penner R, et al. Relaxation times of breast tissue at 1.5T and 3T measured using IDEAL. JMRI. 2006;23:87-91. 3. Aliu S, et al. Repeatability of Quantitative MRI Measurements in Normal Breast Tissue. Trans Oncol. 2014:7:130-137. 4. O’Flynn EAM, et al. Diffusion weighted imaging of the normal breast: reproducibility of apparent diffusion coefficient measurements and variation with menstrual cycle and menopausal status. Eur Radiol. 2012. 22; 1512-1518. 5 Newitt DC, et al. Reproducibility of ADC measurements by Breast DWI: Results of the ACRIN 6698 Trial. Abstract 0949, 25th ISMRM 2017.Figures
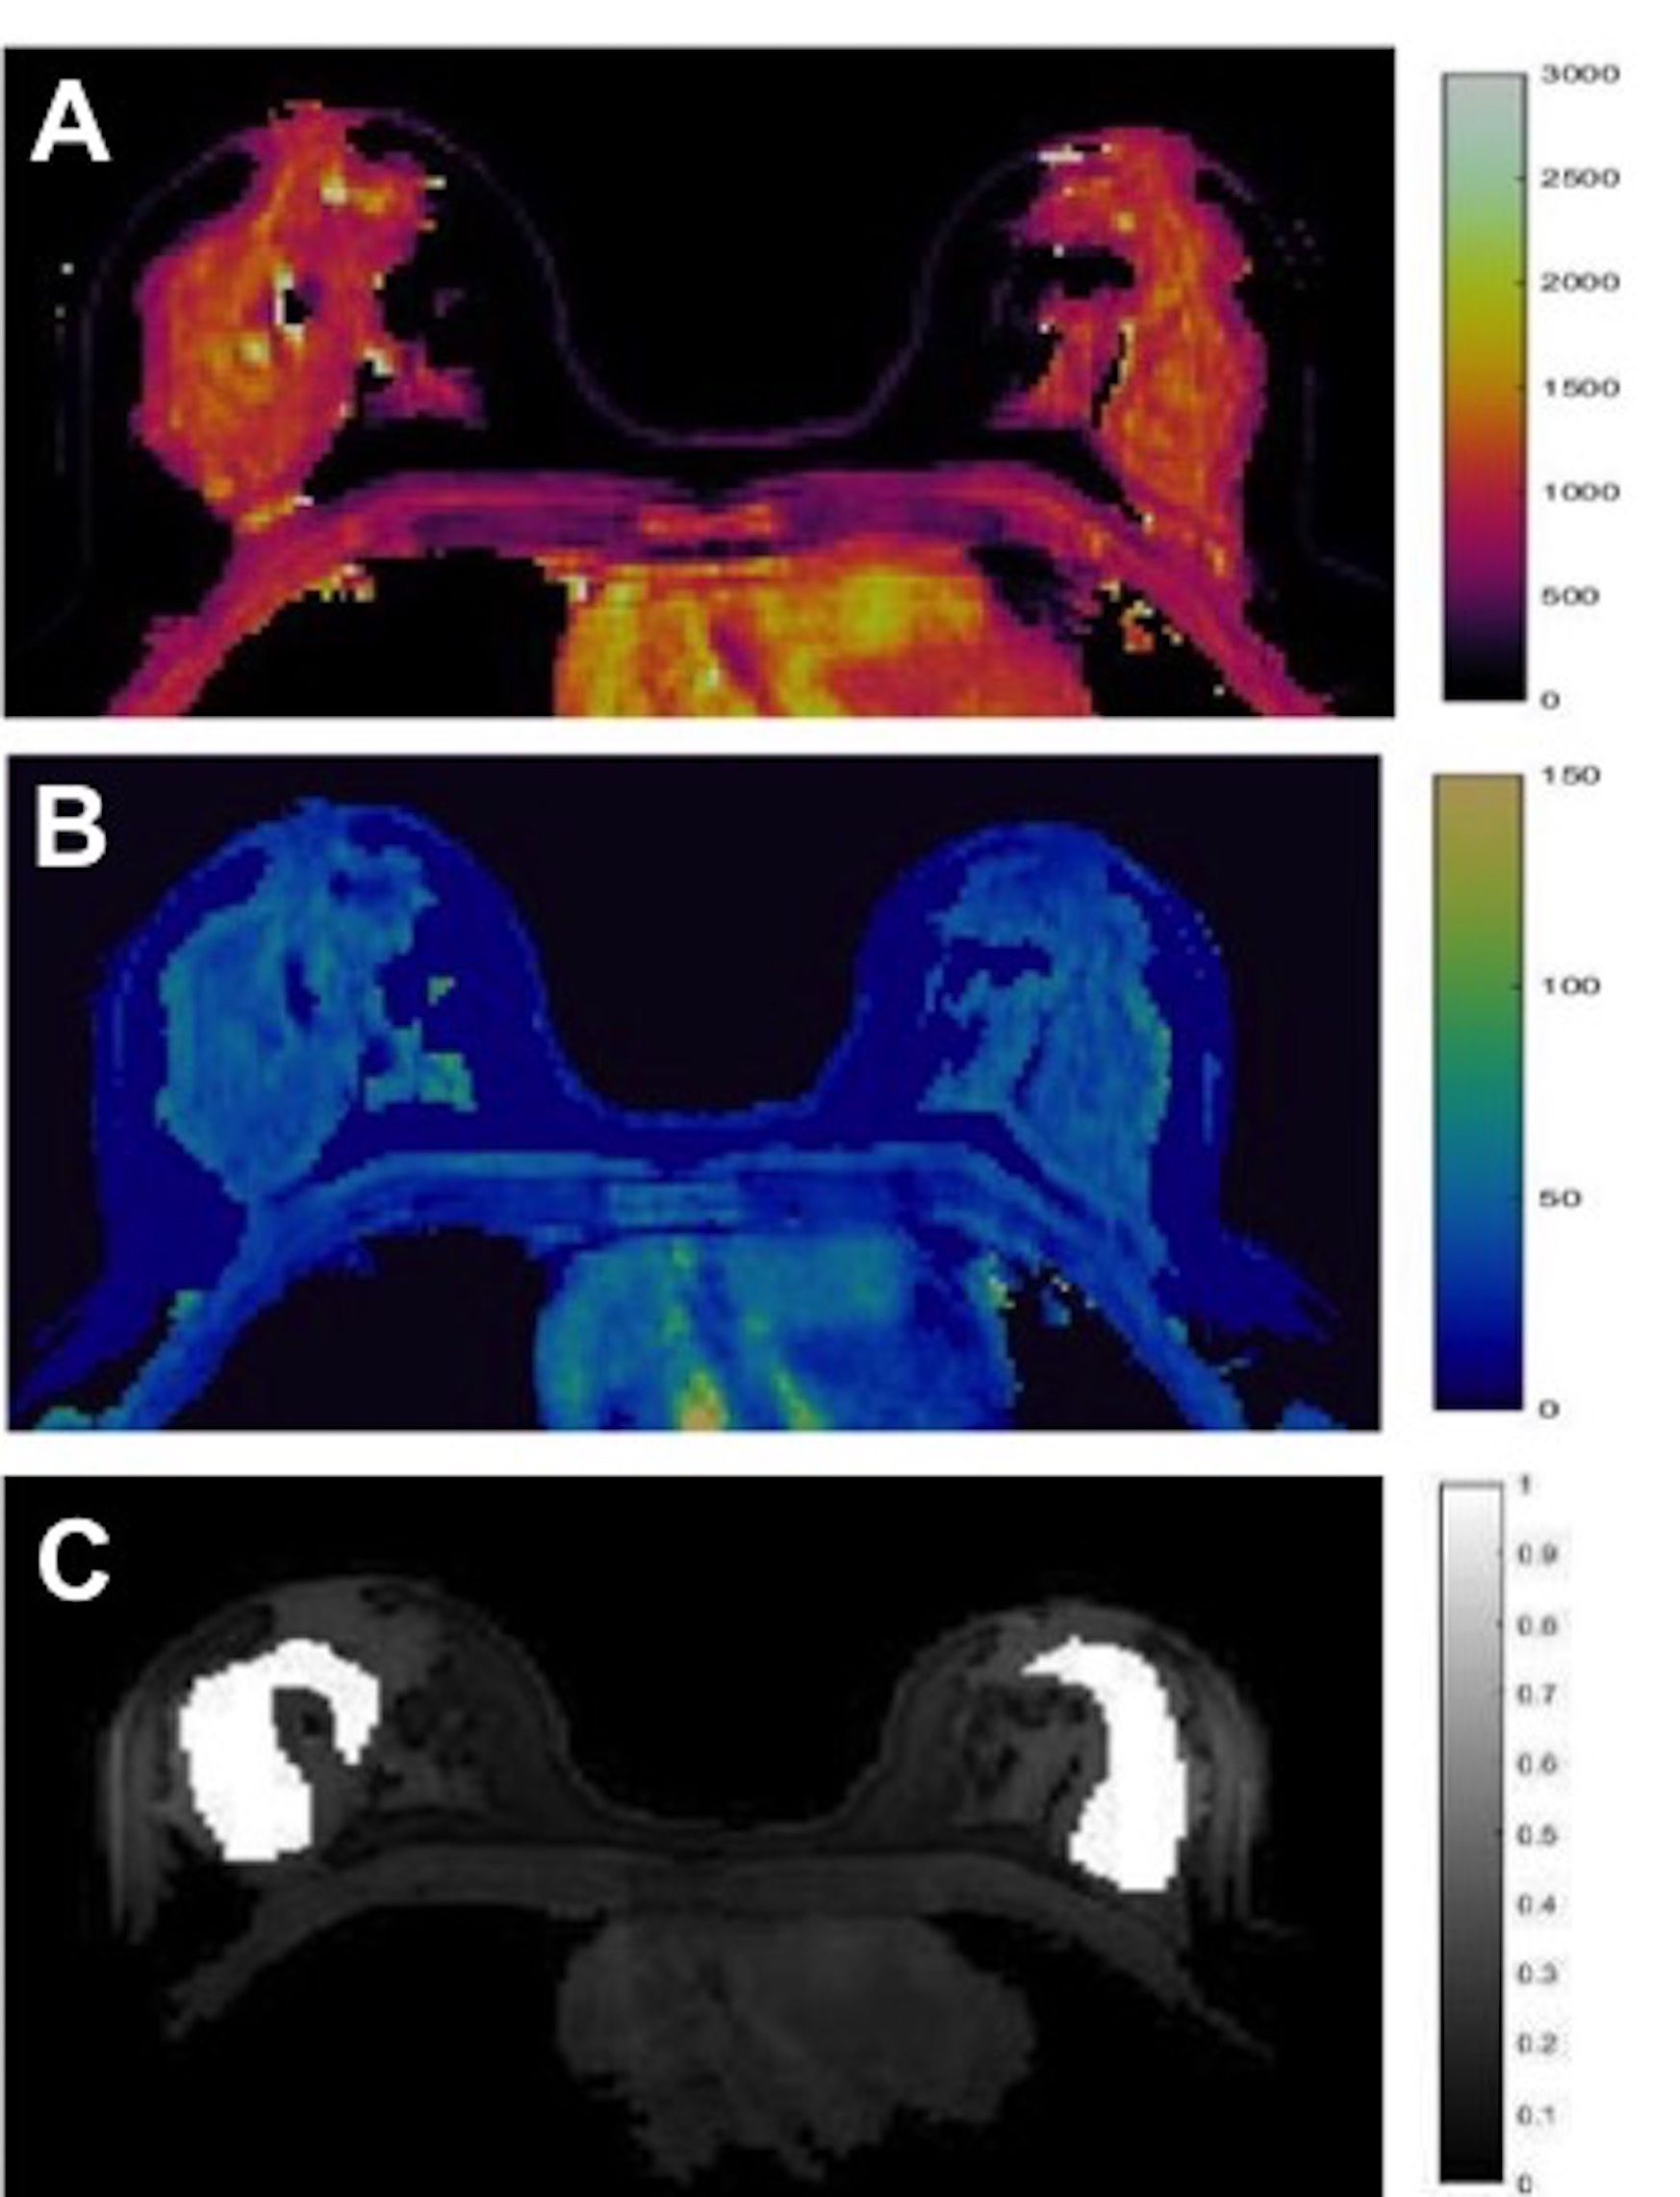
Figure 1:
Representative T1 (A) and T2 (B) MRF colormaps of normal
breast tissue in a healthy volunteer. Figure (C) shows M0 map of the
same volunteer with region of interests (ROIs) drawn over both breasts
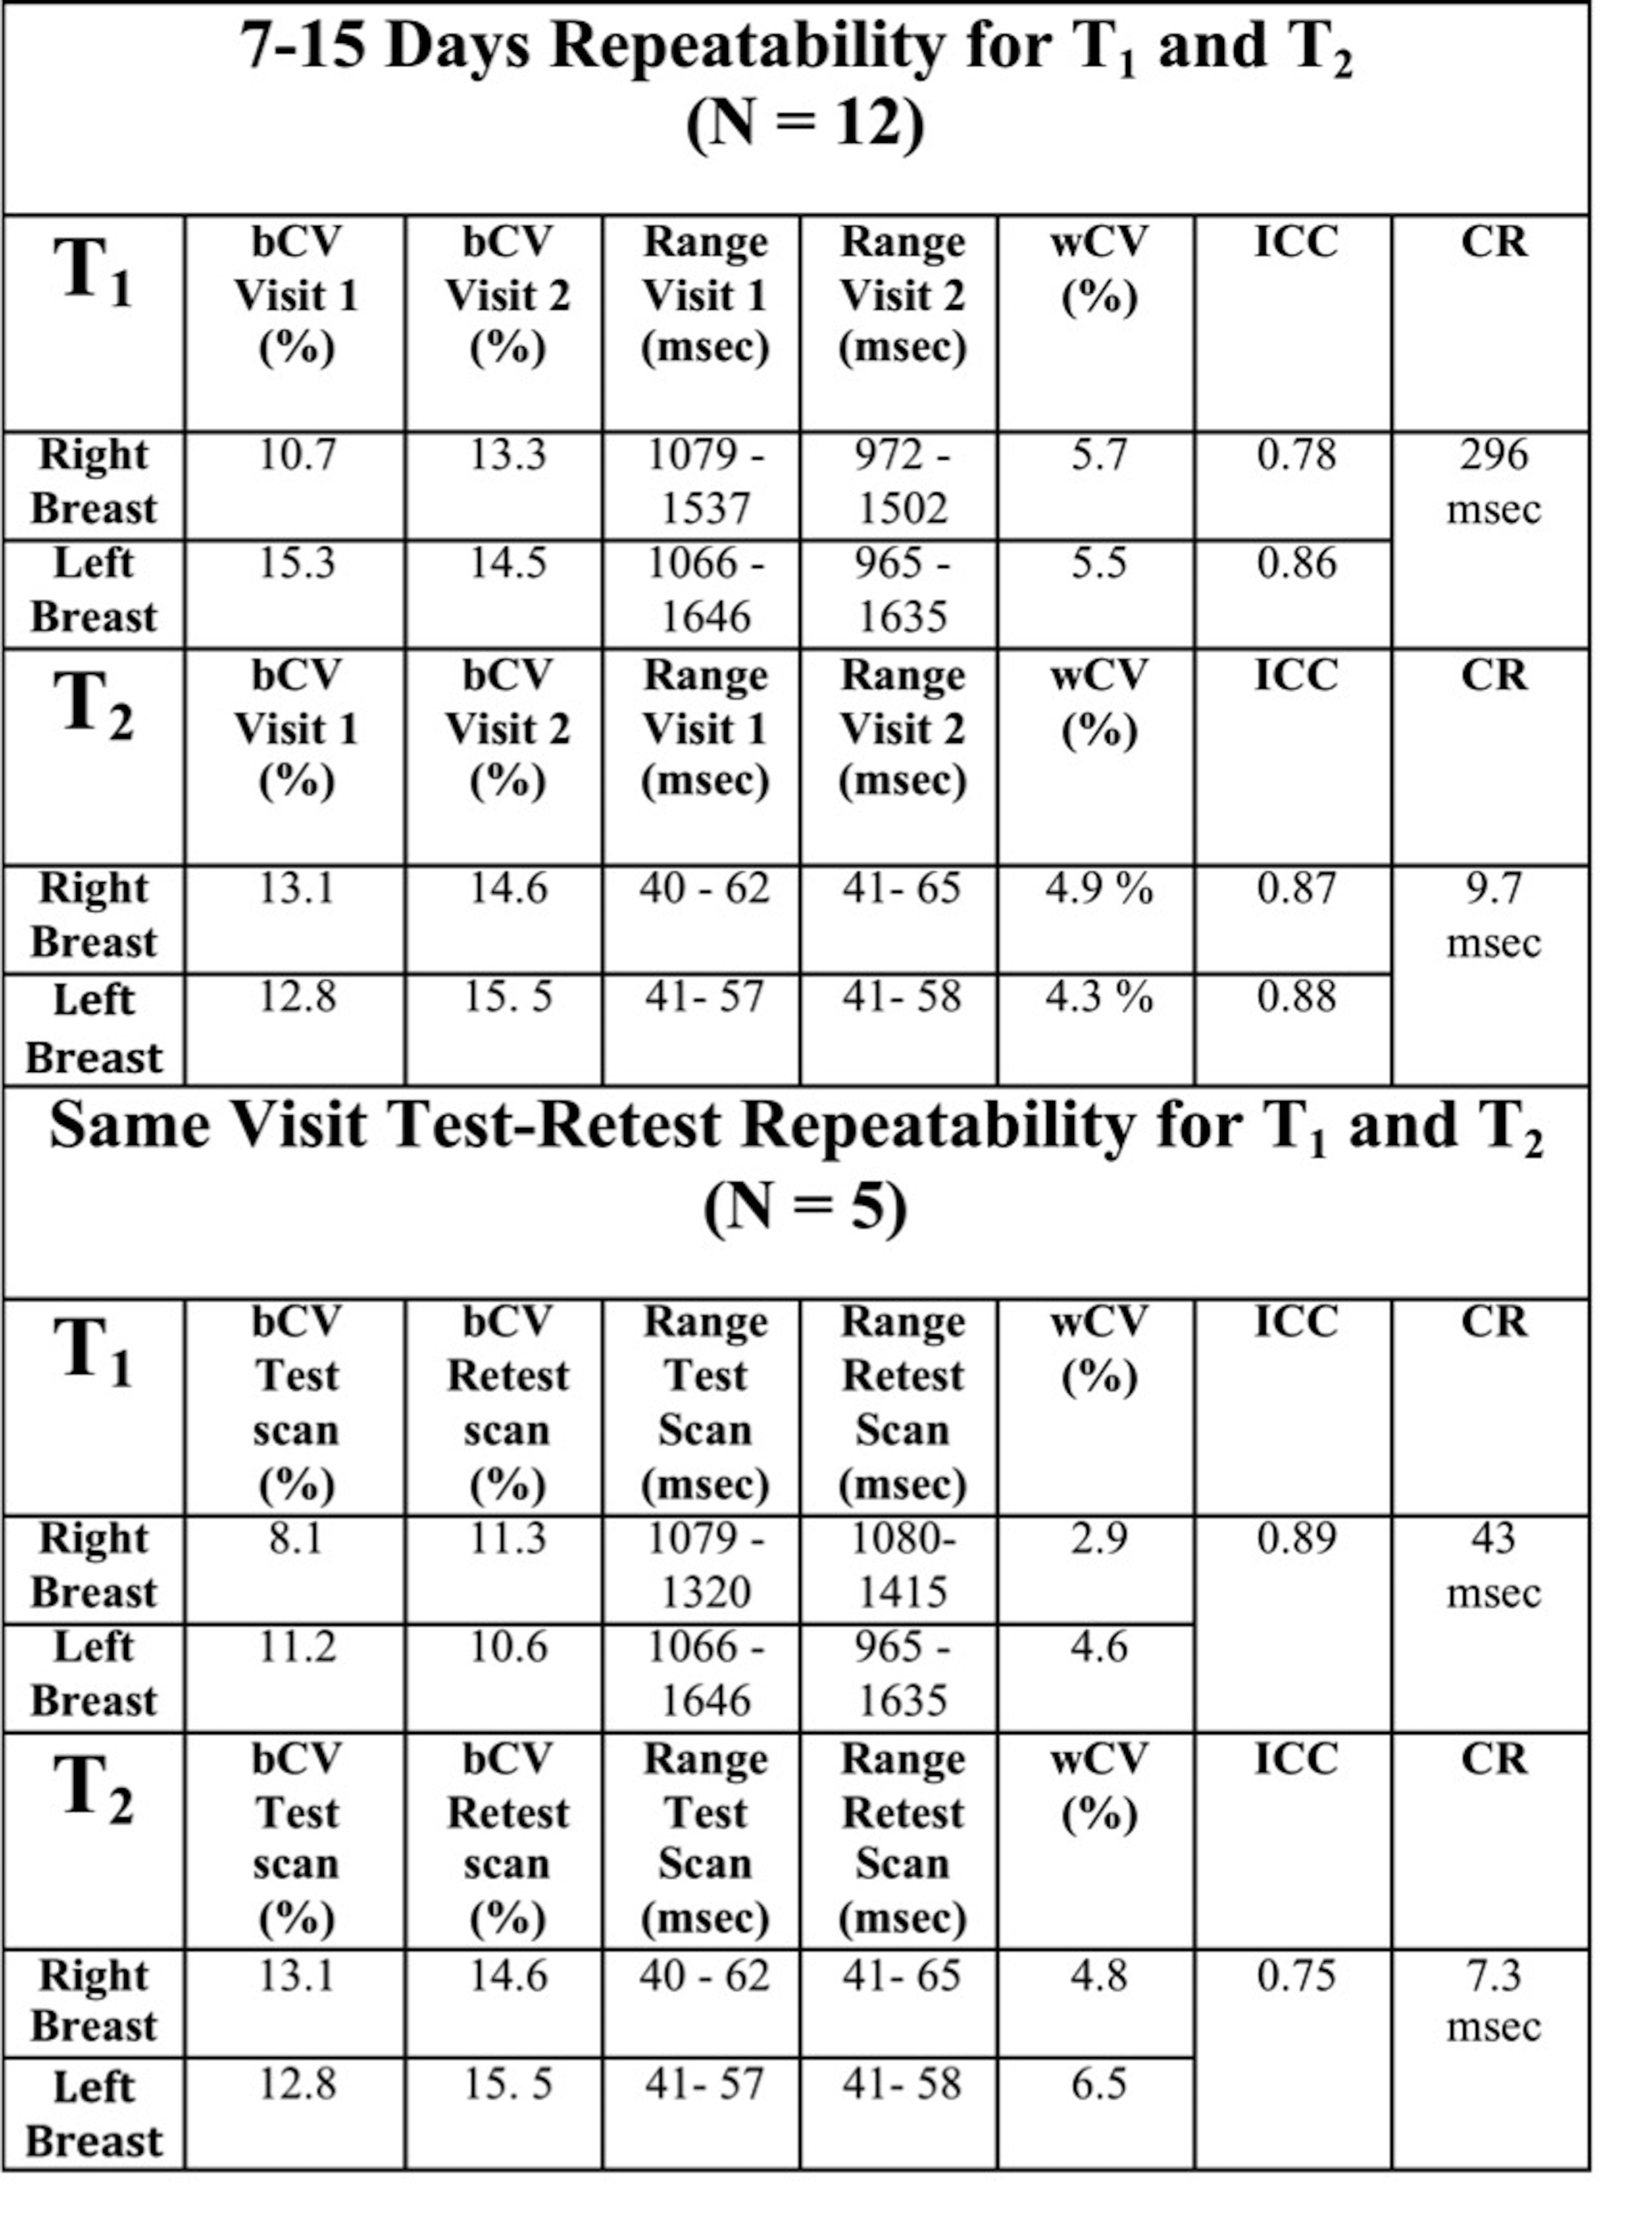
Table 1: Summary
of all results of variability and repeatability for T1 and T2 for two-visit and
10 minute test-retest scan. Measures presented include between subject
coefficient of variance (bCV), spread of values for T1 and T2, within subject
coefficient of variation (wCV) for all subjects, Intraclass Correlation Coefficient (ICC) and coefficient of
repeatability (in msec)
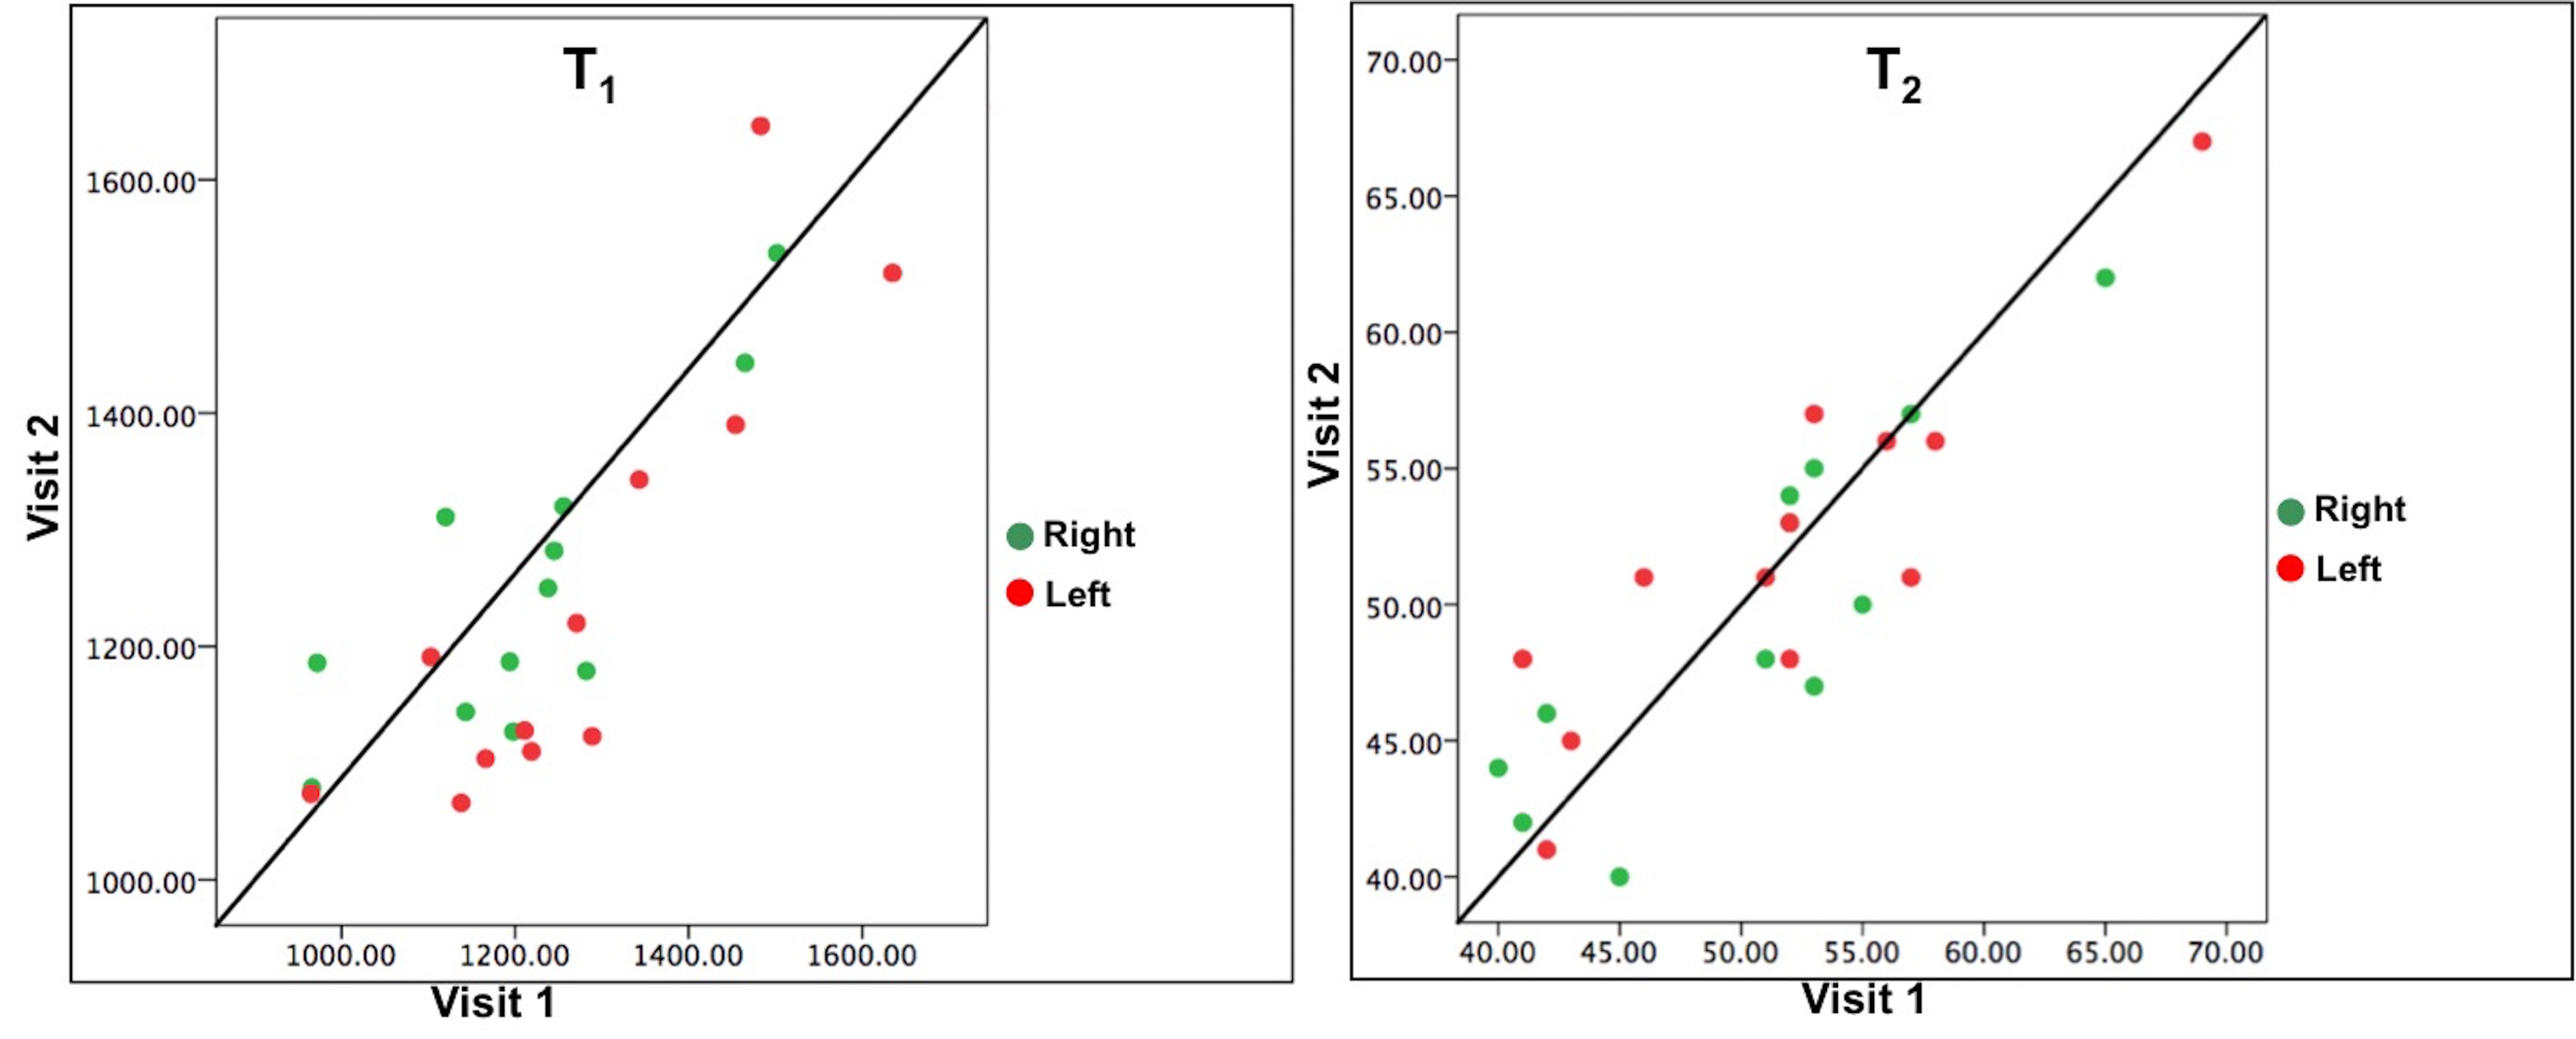
Figure 3: Scatter plots of Visit 2 (y-axis) versus Visit 1 (x-axis) mean T1 and T2 for right and left
breasts. The black line indicates the
identity line.
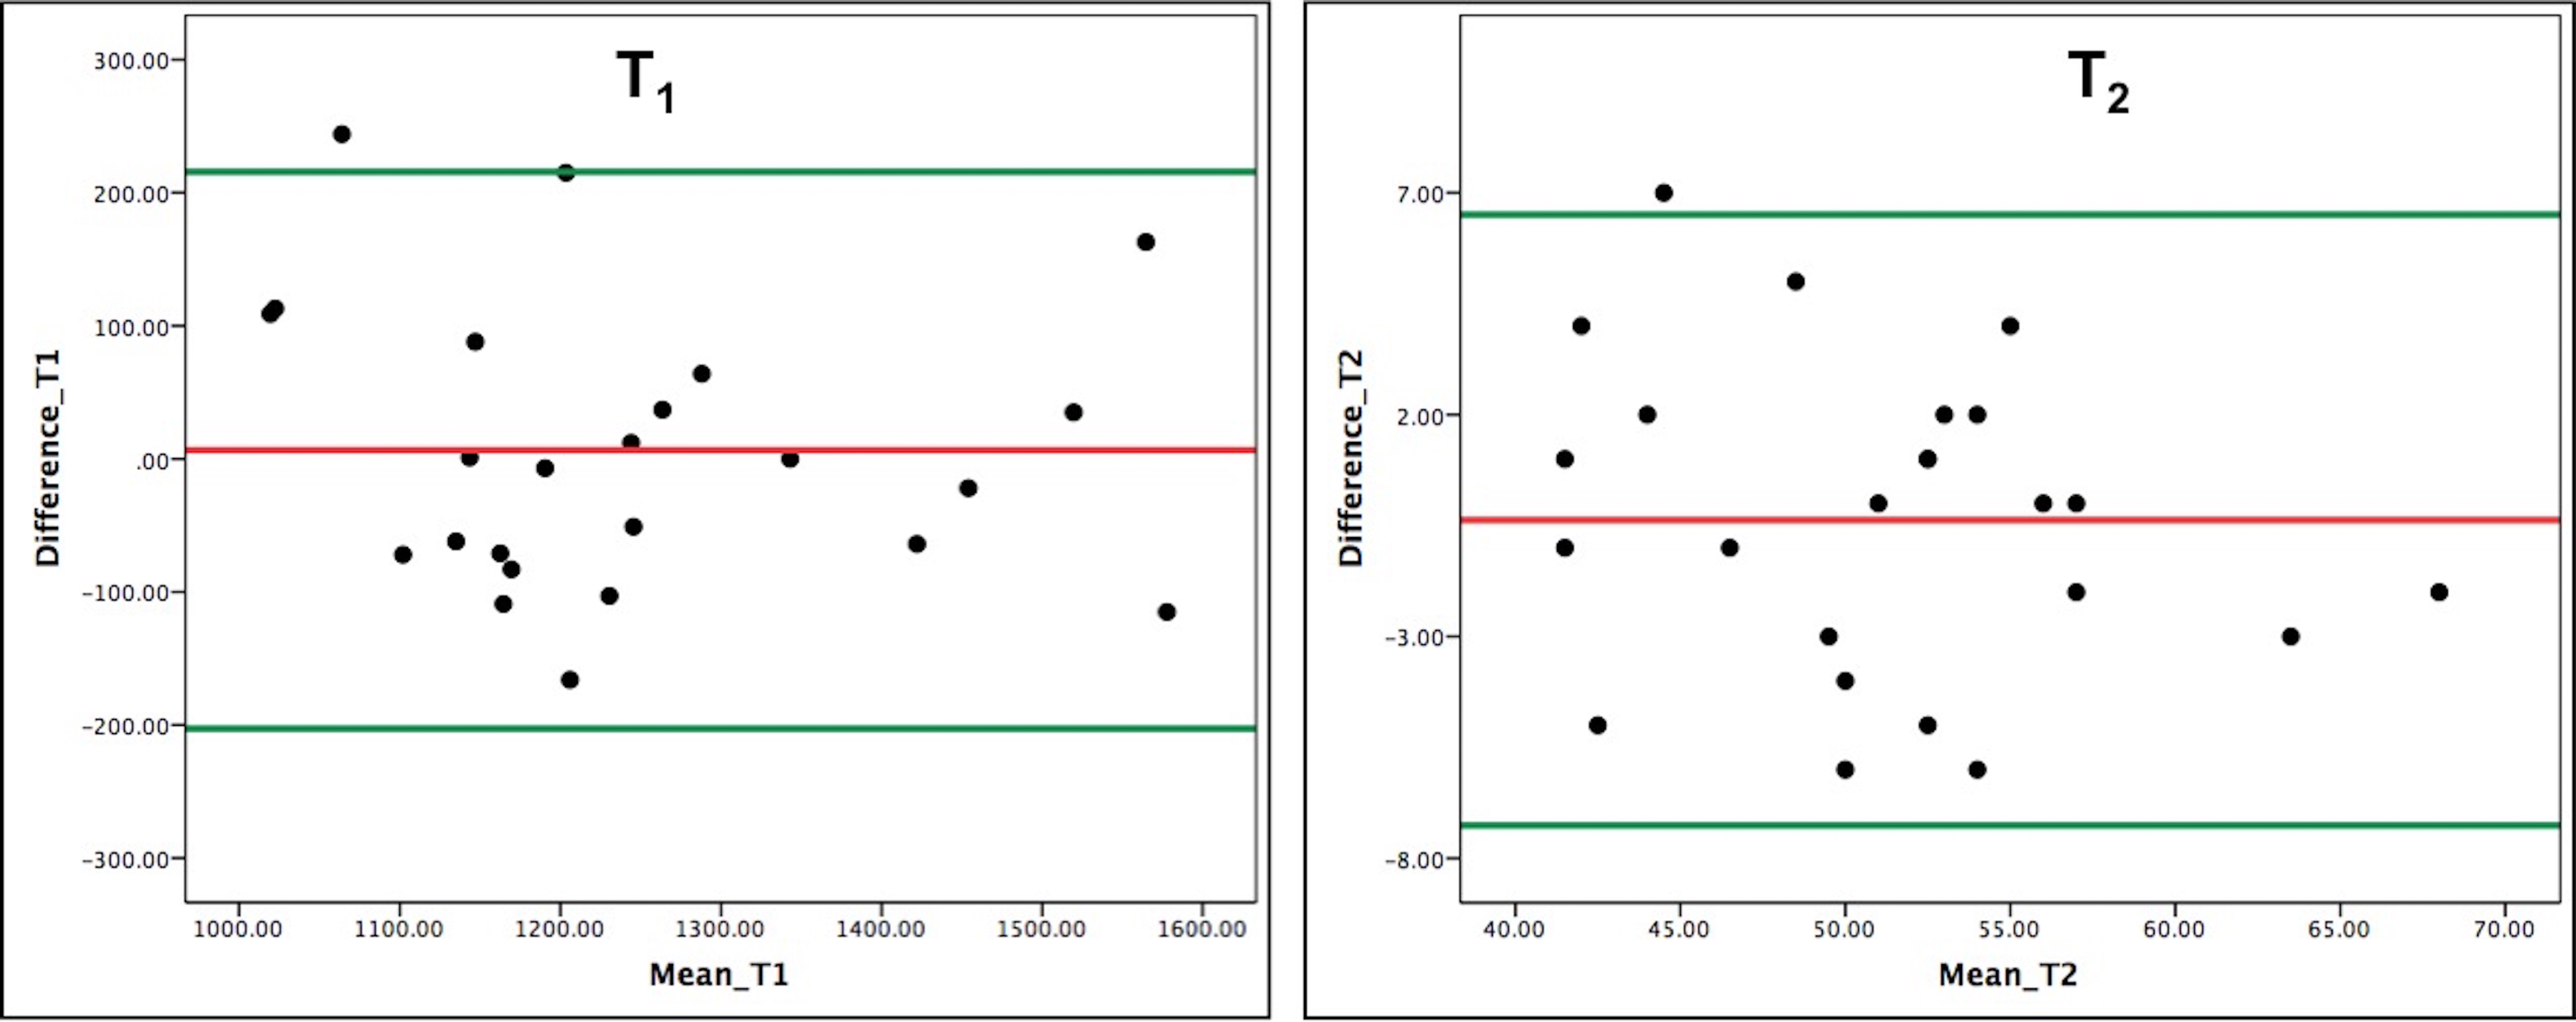
Figure 4: Bland-Altman
plots of Visit 2 - Visit 1 difference versus mean value for all ROIs for T1
and T2. The mean difference, upper and lower limits of agreements (LOA) for T1 were 6.5 msec, 216
msec and -203 msec respectively. The mean difference, upper and lower limits
of agreements (LOA) for T2
were -0.375 msec, 6.5 msec and -7.3 msec respectively.
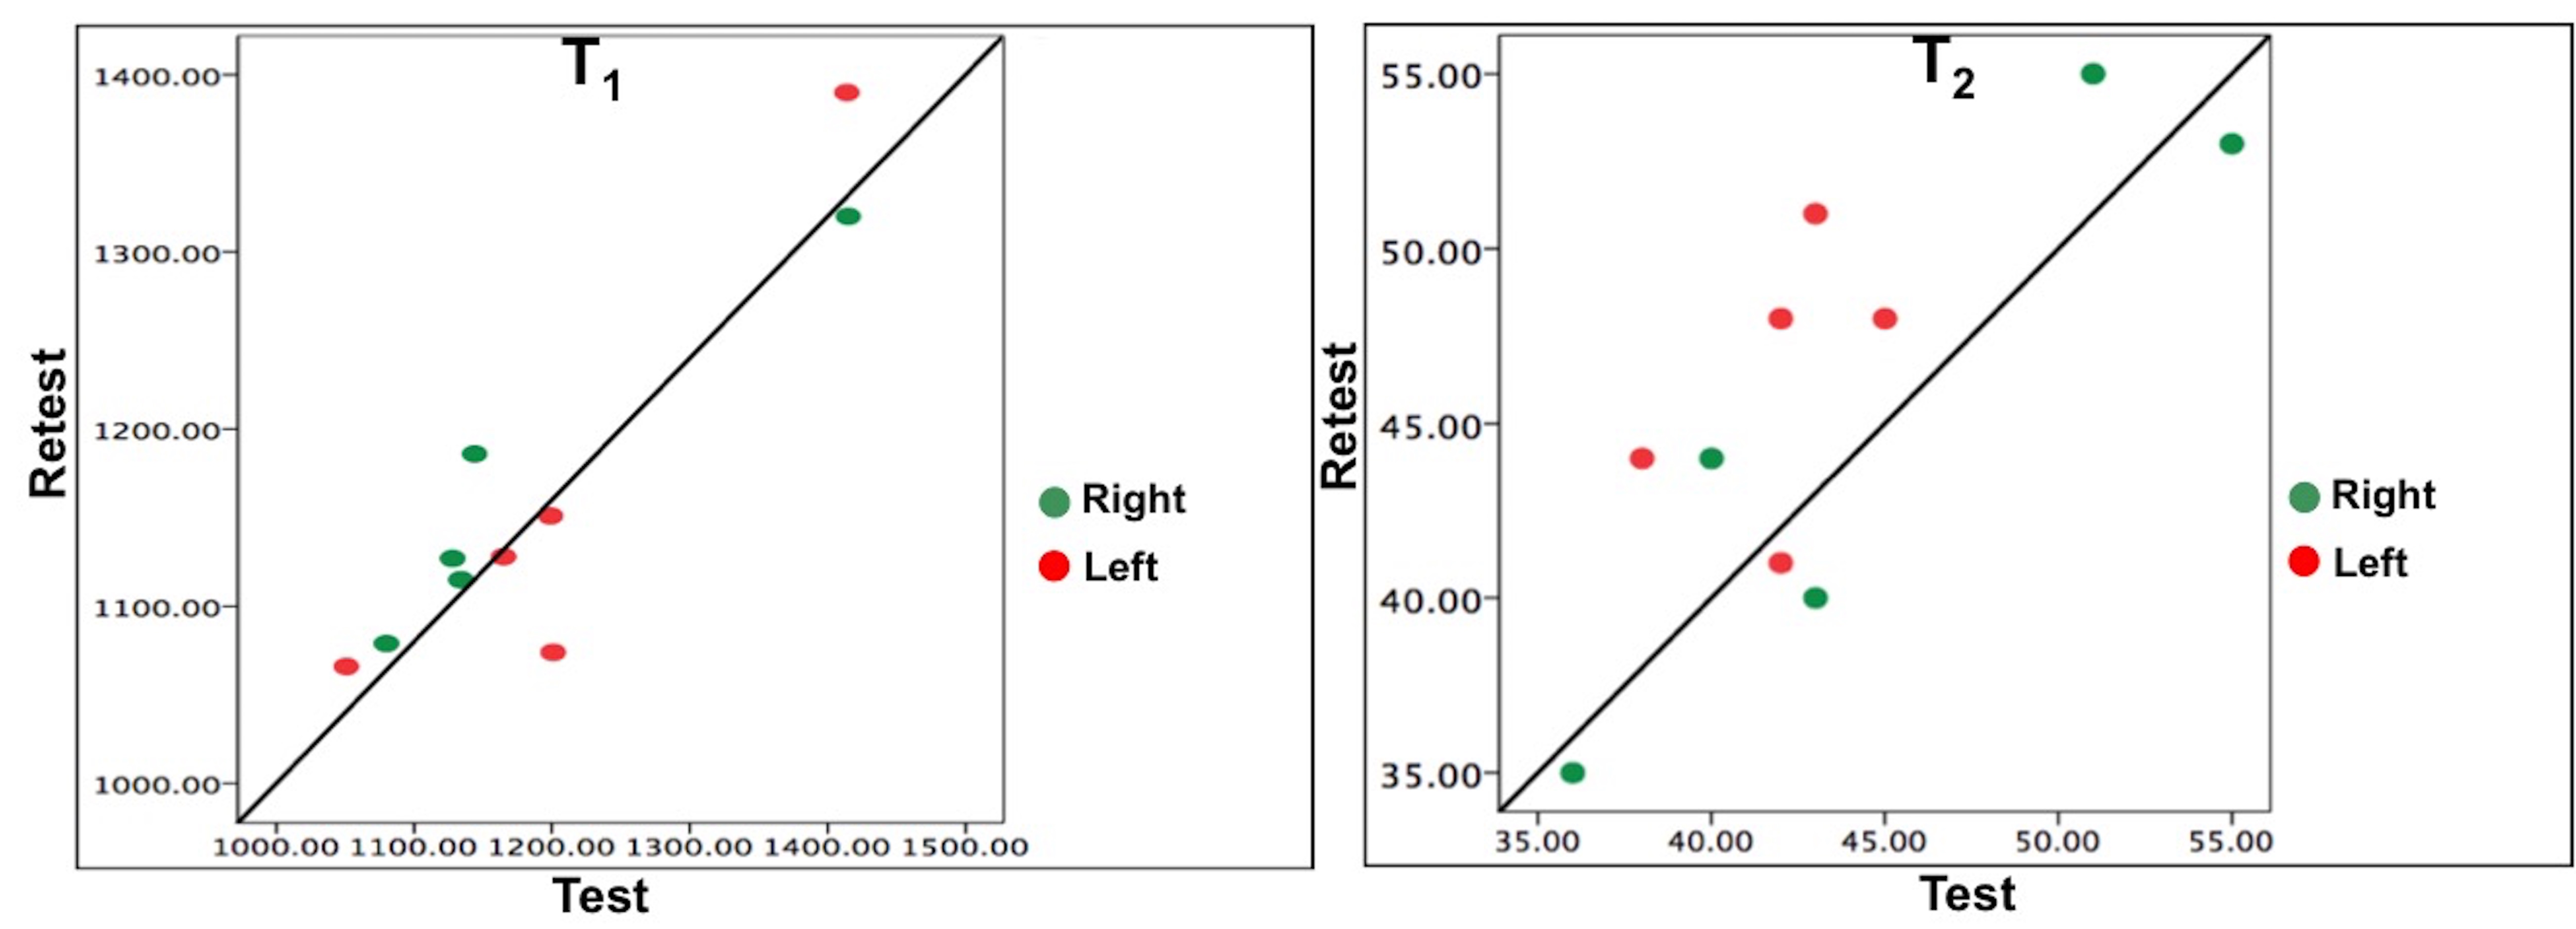
Figure 5:
Scatter plots of 10 minute-retest
(y-axis) versus test (x-axis) mean T1 and T2 for right
and left breasts. The black line
indicates the identity line. There is a greater spread for left breast T2
values