4315
Decomposition of off-resonance fields in brain MRI1Institute of Biomedical Engineering, National Taiwan University, Taipei, Taiwan, 2Department of medical imaging, Taipei Medical University-Shuang Ho Hospital, New Taipei, Taiwan
Synopsis
We measured the off-resonance distributions from 31 subjects and decomposed these maps into orthogonal modes by Singular Value Decomposition. We found that the six SVD modes can account for the off-resonance up to 80%. Decomposed modes of off-resonance can be used for tailored shim coil design.
Introduction
The B0 homogeneity is crucial for high quality MR imaging1,2 and spectroscopy3. Shimming is typically realized by using shim coils to generate magnetic field distributions, whose amplitude distributions mimic different orders of spherical-harmonics (SH), to counteract magnetic field inhomogeneity. However, implementing many shim coils is technically challenging. In brain imaging, the head positioning and major off-resonance loci around the base of temporal lobes and orbital-frontal cortex are similar across subjects. Thus, it is possible to use a few specific combinations of shim fields to improve the field homogeneity efficiently. Specially, shimming the field by the first “mode” suggested by Singular Value Decomposition (SVD) on a group of off-resonance maps can approximate the field homogeneity achieved by using up to the 4th-order SH fields4. This approach was also used to simulate dynamic shimming using shim fields consisting of the first 4 modes of SVD5. The effective degree of freedom of a multi-coil (MC) shim array was similarly studied to reveal that a 128-channel MC shim array has only about 50 degrees of freedom6.
Here we study how combinations of shim fields suggested by SVD can reliably reduce the field inhomogeneity in brain imaging. We are specifically interested in identifying the desired field homogeneity afforded by the minimal number of separate shim fields. This information can be used to trade-off between the shimming performance and the degree of hardware complexity.
Methods
Spatial distributions of off-resonance from 31 participants were measured by a dual-echo sequence (TE1 = 2 ms, TE2 = 4.46 ms) at 3T (Skyra; Siemens) with 2 mm isotropic resolution after a 2nd-order global shimming. The phase accrued between two echoes was calculated at each image voxel by first using the Hermitian inner product7 to remove the phase related to the coil sensitivity and then taking a weighted8 sum across receiver channels. The phase wrapping between neighboring image voxels was reduced by the BEST-PATH algorithm9. Off-resonance fields were co-registered by FSL10-12 (FMRIB, Oxford, UK). A field inhomogeneity map was calculated for each subject separately.
A two-dimensional matrix consisting of off-resonance maps from 30 participants was then analyzed by SVD, which separated the data into different “modes”. Each of the left singular vectors represented a spatial distribution of off-resonance across participants. Singular values quantified the relative significance of each mode. Each of the right singular vectors denoted the relative contribution across participants to one mode. We used leave-one-out cross-validation to evaluate how the off-resonance of one participant can be predicted by the combination of all modes from all 30 other participants. The prediction was measured by the cosine similarity13.
Results
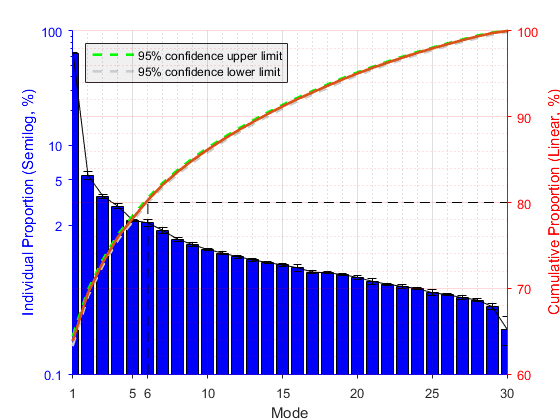
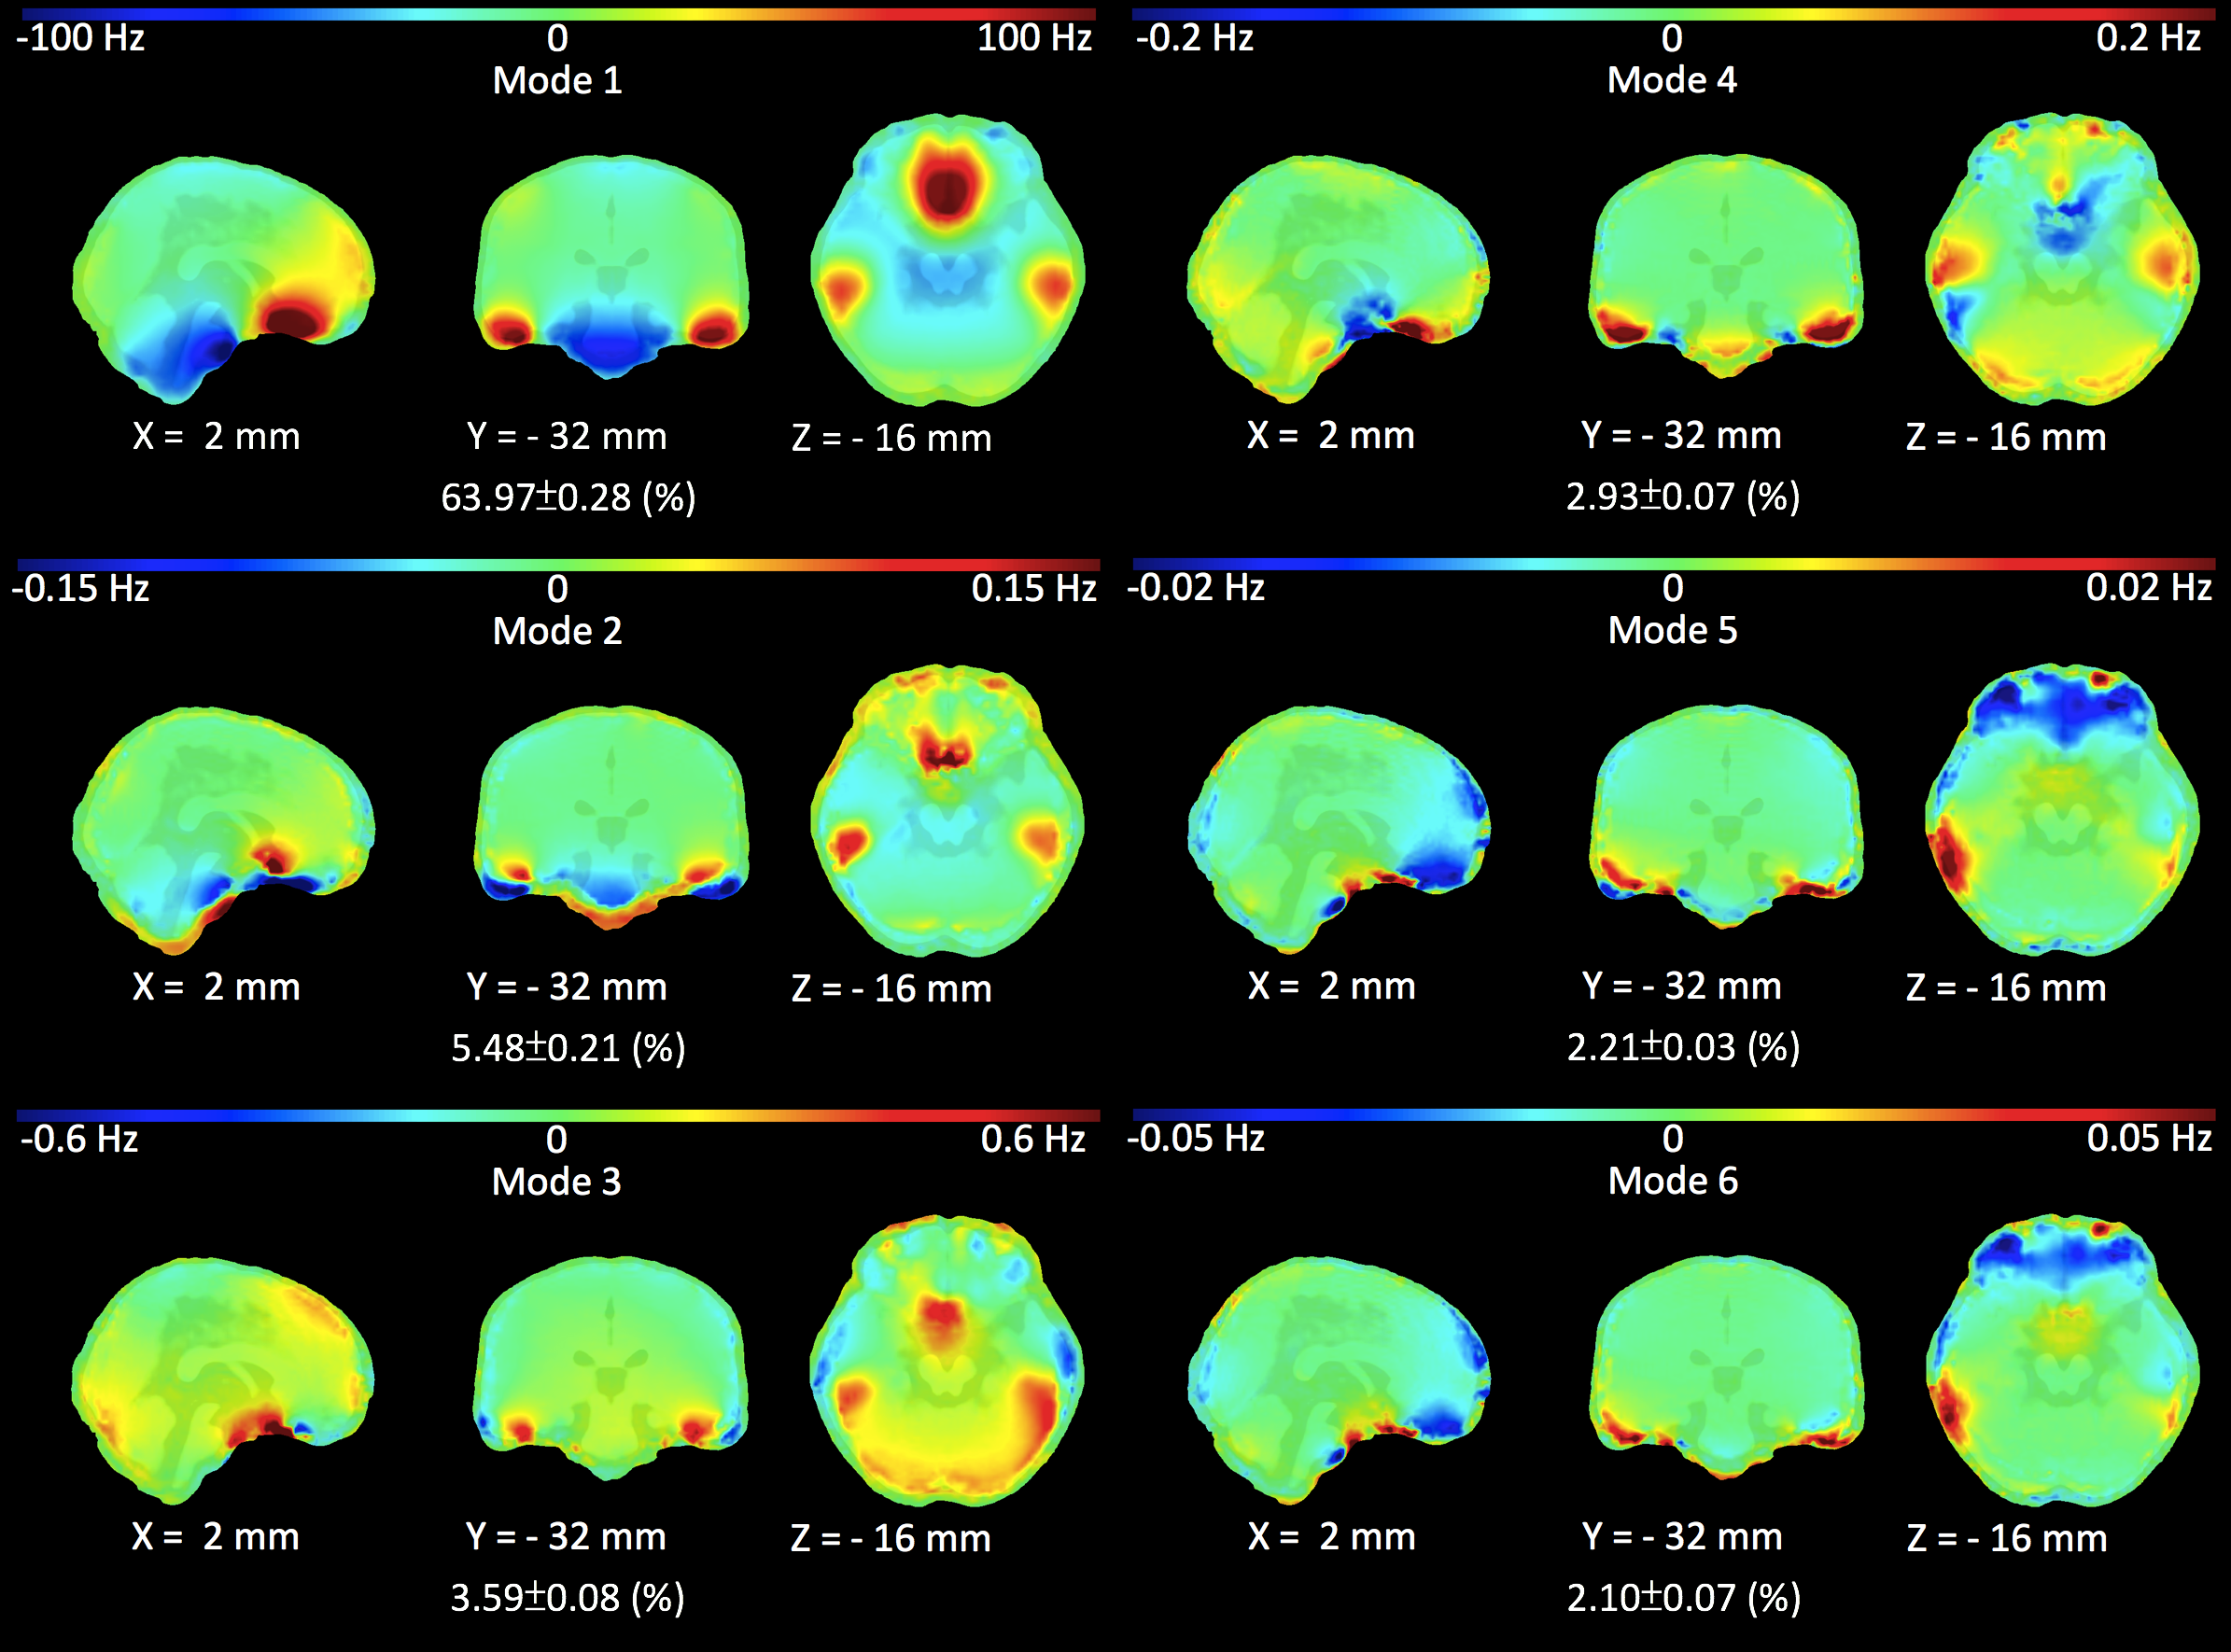
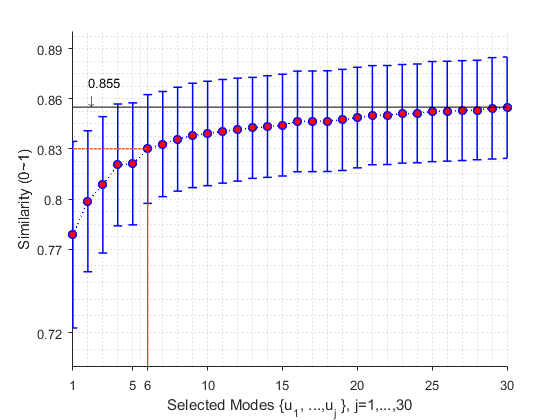
Figure 1 shows the power and cumulative power of singular values. The first six mode contributed more than 80% in the cumulative power. Each of other higher order modes took less than 2% of the singular value power. Figure 2 shows the first six modes of the group. The first mode shows positive off-resonance field around the orbital-frontal cortex and inferior-temporal lobes, but negative off-resonance field was around the brainstem. Between the 2nd and the 6th modes, the off-resonance fields suggested by SVD were mostly around the same areas in the 1st mode near the sphenoid sinus and ear canals. Figure 3 shows that after shimming by the first six modes, only marginal improvement can be achieved from higher order modes. Taking all modes accounted for 85% of the off-resonance. This suggested the limitation of using a separate population to counteract the off-resonance of an unknown subject.
Discussion
Our results demonstrated that the first 6 modes of SVD accounting for about 80% of total variance of the field inhomogeneity from a group of 30 subjects (Figure 1). Naturally, one may speculate that one field suggested by SVD can be realized by a shim coil to counteract the field inhomogeneity. However, as the revealed off-resonance distributions were not spatially smooth, designing such shim current may not be straightforward or even feasible. The first SVD mode accounted for more than 60% of field inhomogeneity. We may realize a shim coil to approximate this off-resonance distribution to reduce artifacts reasonably. In the future, we will compare the number of SH terms and SVD modes in order to trade-off between generalized and specific off-resonance correction.Acknowledgements
This work was partially supported by Ministry of Science and Technology, Taiwan (103-2628-B-002-002-MY3, 105-2221-E-002-104), and the Academy of Finland (No. 298131).References
- Bertram J. Wilm, Christoph Barmet, Klaas P. Pruessmann, "Erratum to “Fast Higher-Order MR Image Reconstruction Using Singular-Vector Separation” [Jul 12 1396-1403]", Medical Imaging IEEE Transactions on, vol. 31, pp. 1833-1833, 2012, ISSN 0278-0062.
- Jezzard, P. and Balaban, R. S. (1995), Correction for geometric distortion in echo planar images from B0 field variations. Magn. Reson. Med., 34: 65–73. doi:10.1002/mrm.1910340111.
- Christoph Juchem, Robin A. de Graad, B0 magnetic field homogeneity and shimming for in vivo magnetic resonance spectroscopy. Analytical Biochemistry, vol. 529, 15 July 2017, pages 17-29, https://doi.org/10.1016/j.ab.2016.06.003.
- Adalsteinsson, E., Conolly, S.M., Xu, H., Spielman, D.M., Design of dedicated shim fields. Proc. Int. Soc. Magn. Res. Med., 477 (1999).
- Poole, M. (2007), 'Improved Equipment and Techniques for Dynamic Shimming in High Field MRI', PhD thesis, The University of Nottingham.
- Stockmann JP, Witzel T, Keil B, et al. A 32-Channel Combined RF and B0 Shim Array for 3T Brain Imaging. Magnetic resonance in medicine. 2016;75(1):441-451. doi:10.1002/mrm.25587.
- Robinson, S. D., Bredies, K., Khabipova, D., Dymerska, B., Marques, J. P., and Schweser, F.(2017) An illustrated comparison of processing methods for MR phase imaging and QSM: combining array coil signals and phase unwrapping. NMR Biomed., 30: e3601. doi: 10.1002/nbm.3601.
- Luo J, Jagadeesan BD, Cross AH, Yablonskiy DA. Gradient Echo Plural Contrast Imaging – signal model and derived contrasts: T2*, T1, Phase, SWI, T1f, FST2*and T2*-SWI. Neuroimage. 2012;60(2):1073-1082. doi:10.1016/j.neuroimage.2012.01.108.
- Hussein S. Abdul-Rahman, Munther A. Gdeisat, David R. Burton, Michael J. Lalor, Francis Lilley, and Christopher J. Moore, "Fast and robust three-dimensional best path phase unwrapping algorithm," Appl. Opt. 46, 6623-6635 (2007).
- Jenkinson et at., FSL. NeuroImage, 62:782-90, 2012.
- S.M. Smith, Fast robust automated brain extraction. Human Brain Mapping, 17(3):143-155, November 2002.M.
- Jenkinson et al., BET2: MR-based estimation of brain, skull and scalp surfaces. In Eleventh Annual Meeting of the Organization for Human Brain Mapping, 2005.M.
- Landauer, T. K., Foltz, P. W., & Laham, D. (1998). Introduction to Latent Semantic Analysis. Discourse Processes, 25, 259-284.
Figures