4312
16 Channel Coupled Network Analyzer for Characterizing pTX Systems at 3T1Department of Radiology, Case Western Reserve University, Cleveland, OH, United States, 2Department of Biomedical Engineering, Case Western Reserve University, Cleveland, OH, United States
Synopsis
Recent work has shown parallel RF transmit (pTX) chains with increasing channel counts and complexity. At the same time, methods of controlling and monitoring pTX chains must improve, especially when faced with nonlinearities in the RFPAs. However, characterizing multichannel nonlinear RF systems is a daunting task for standard laboratory instruments. Here we present a coupled network analyzer (CNA) containing 16 independent RF transceivers which are used simultaneously by a digital acquisition unit (DAQ). Additional DAQ channels can be used for monitoring power consumption or temperature. The system may also be interfaced with an MRI scanner to function as a pTX synthesizer.
Purpose:
pTX chains face technical challenges such as static/dynamic nonlinearity in the RFPAs, array element coupling, load variation, and amplifier failure to power dissipation and excessive VSWR. Isolators are commonly used to greatly simplify these issues, however isolators are incompatible with the magnets static field, forcing them and the RFPAs to be located remotely, which hurts overall efficiency and cost. Recently we have demonstrated a transmit array using in-bore high efficiency RFPAs without isolators, but such an approach requires that the interactions between the various nonlinear elements be considered in detail. However, characterizing a 16 channel nonlinear RF system is a daunting task for standard laboratory instruments. Previously we demonstrated a coupled network analyzer (CNA)1 designed for this specific purpose in two channel systems, which we have expanded to 16 channels. Unlike previous works2-5 which handle only RF modulation, this system also provides RF demodulation and power monitoring at sampling rates up to 350kSps.Methods:
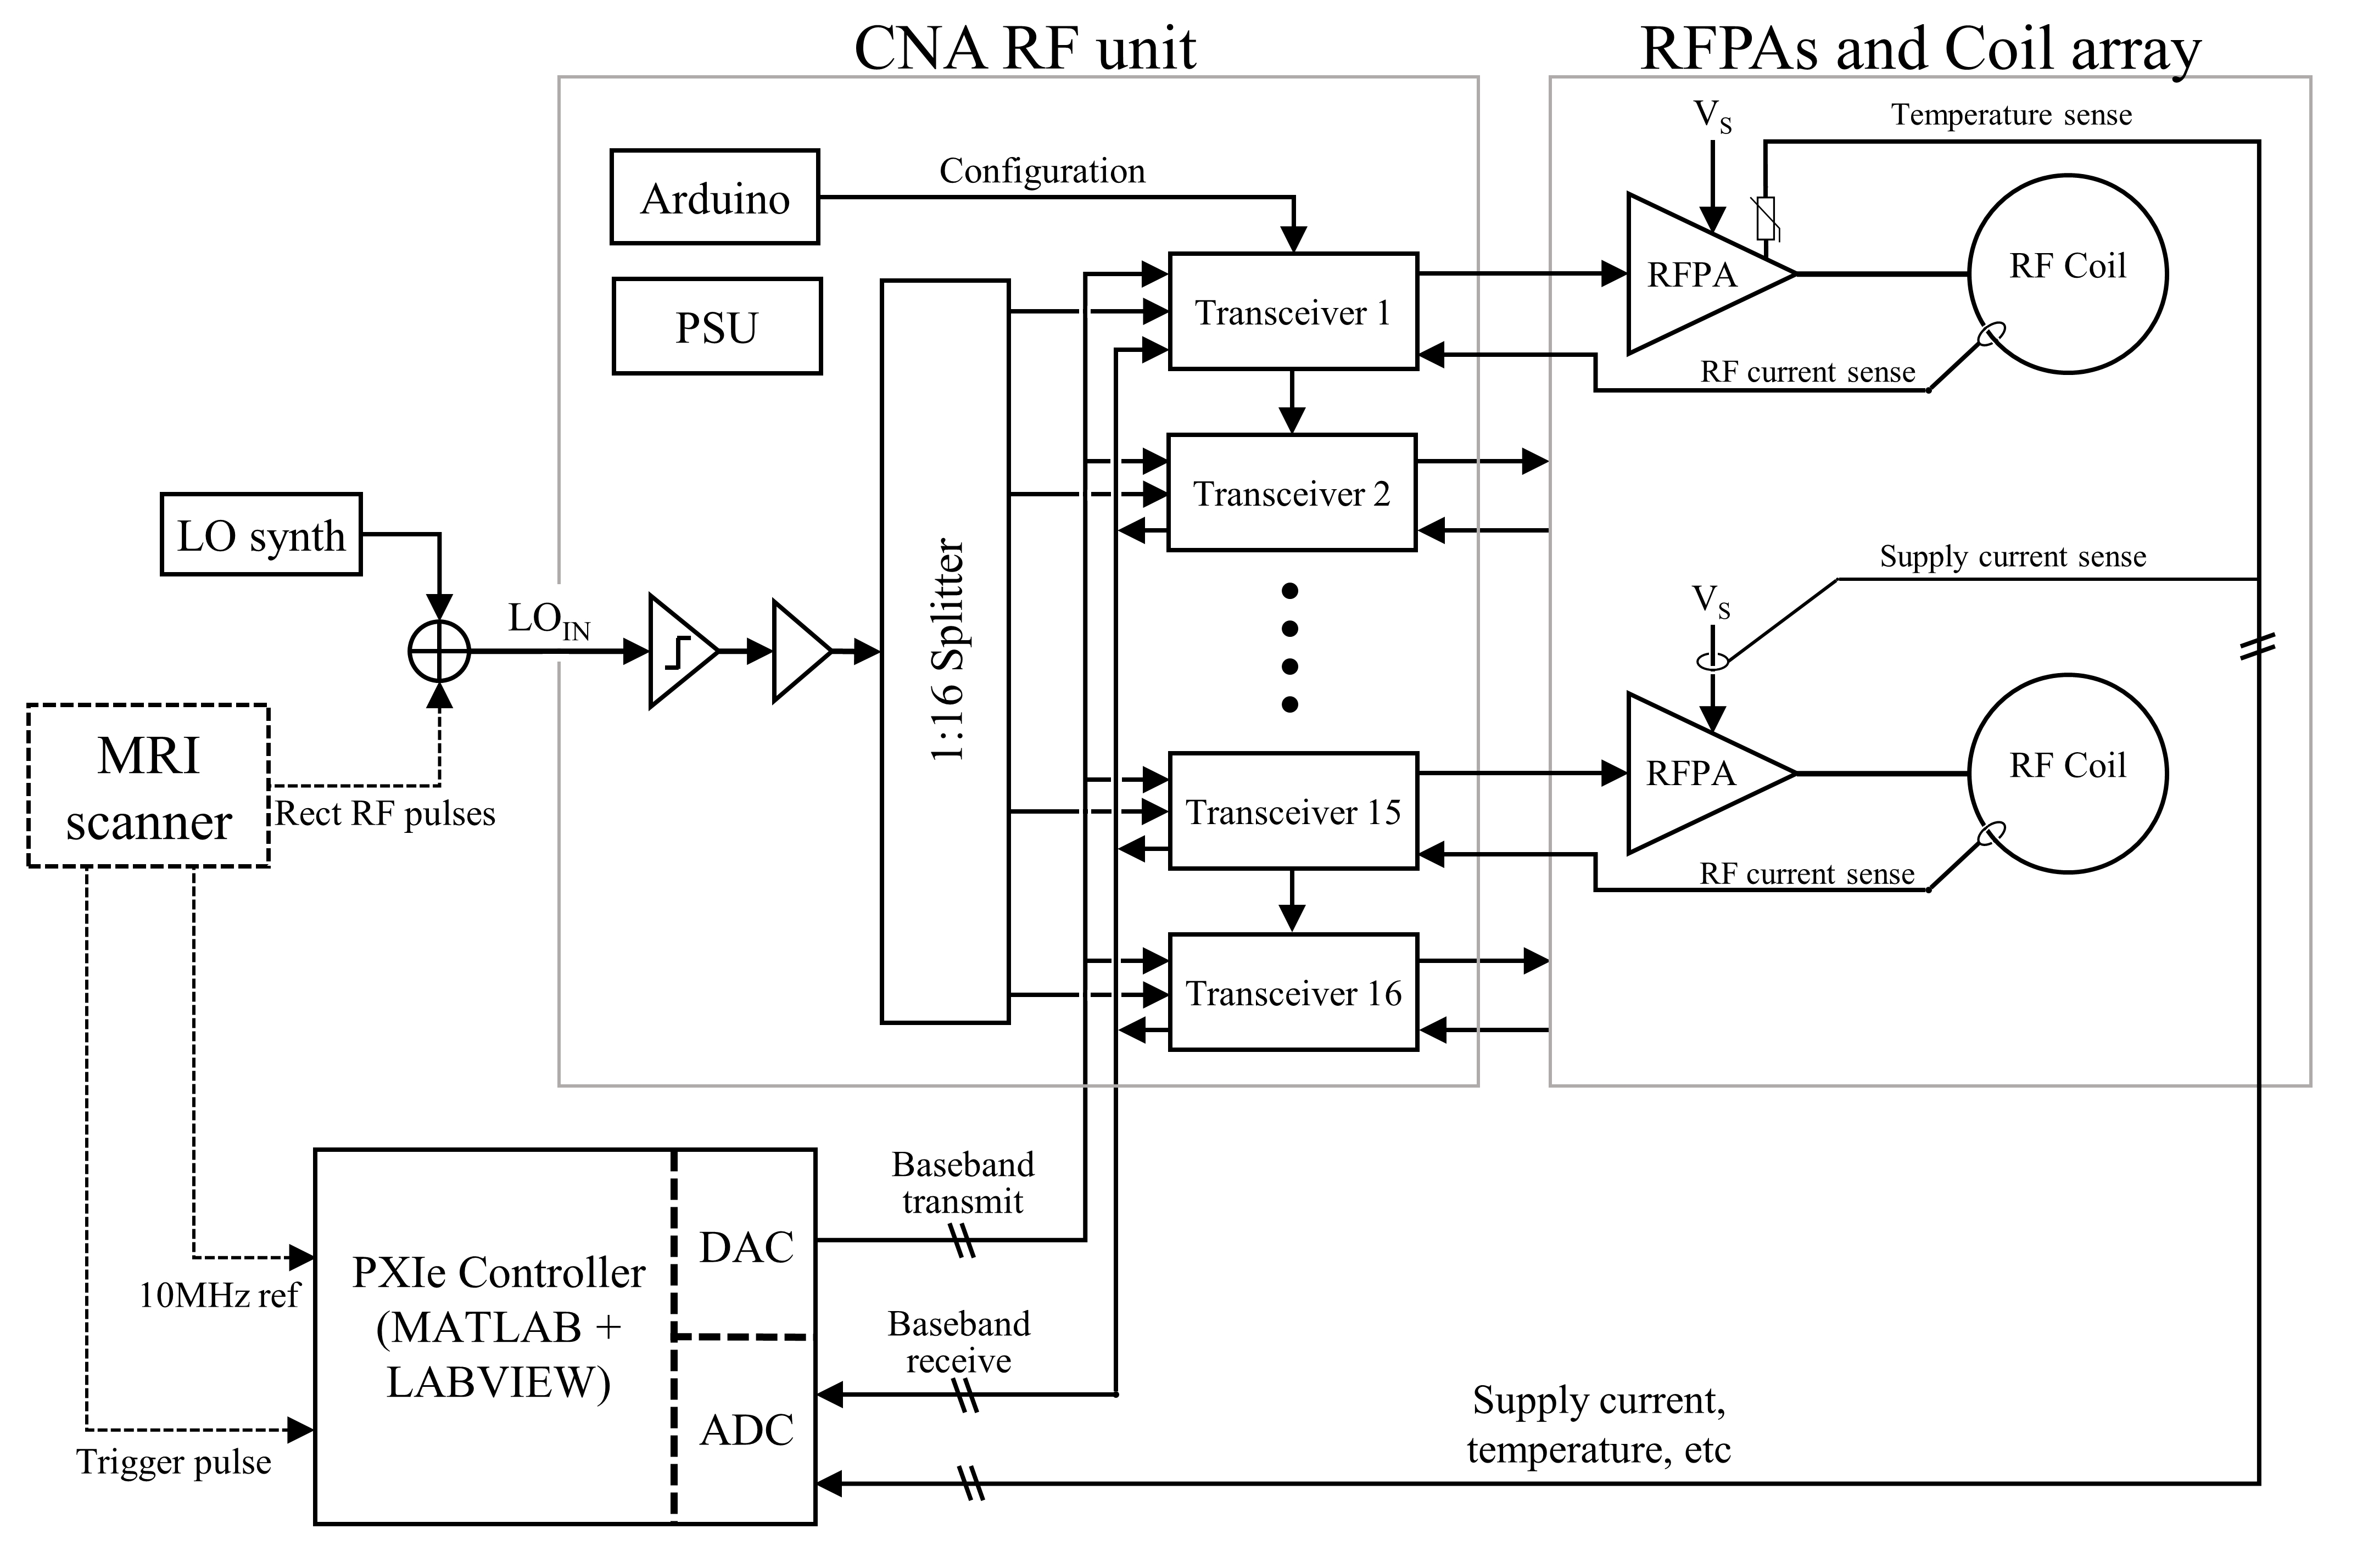
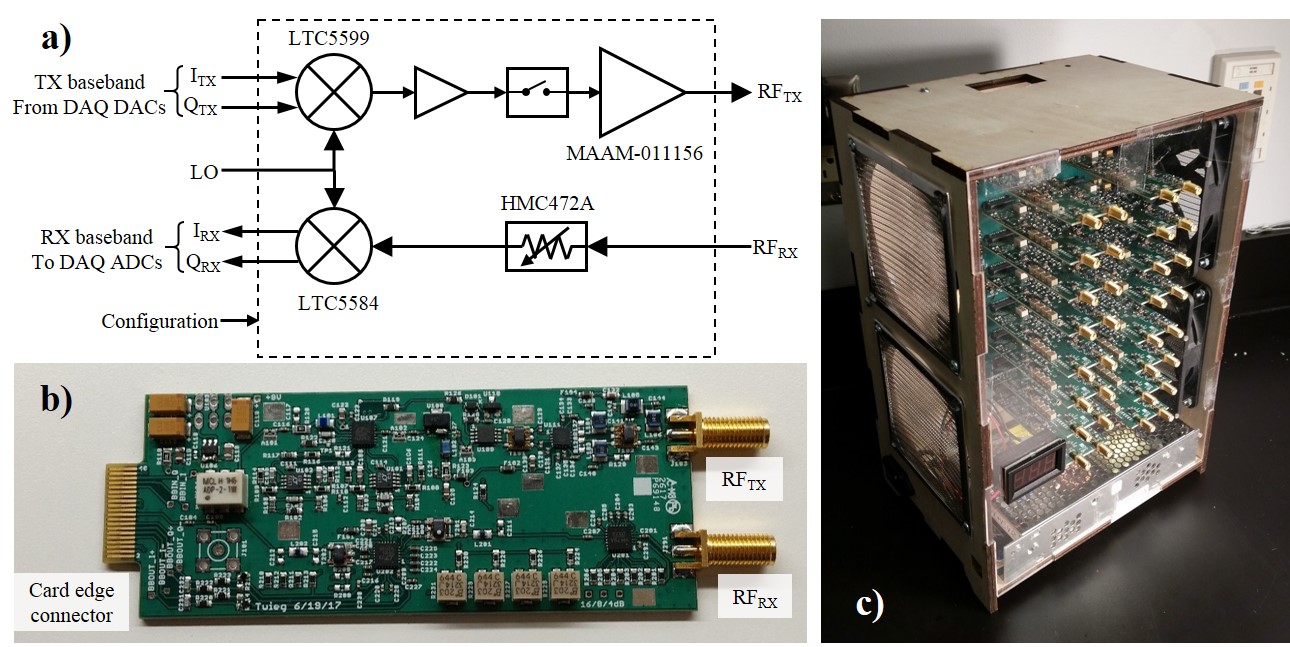
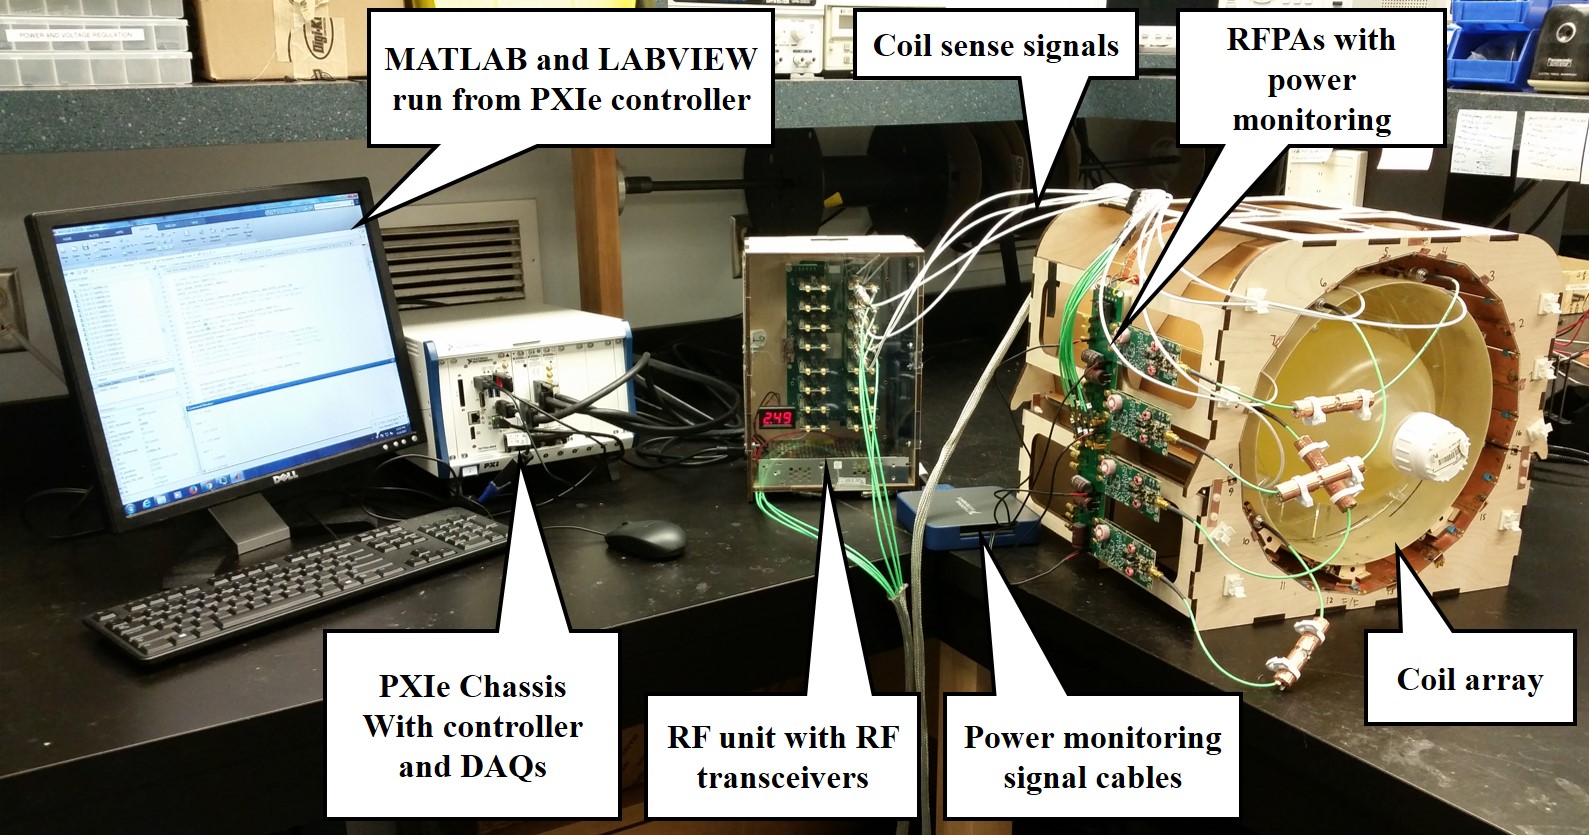
The full system (see figure 1) is composed of a PXIe DAQ (National Instruments) and modular RF transceivers (figure 2) mounted on a backplane. The architecture uses envelope elimination and restoration approach for RF modulation. A fixed-magnitude reference carrier is split (JEPS-16-1W+) from a backplane to 16 transceiver cards each with a vector modulator (LTC5599) and a vector demodulator (LTC5584). The modulators are followed by RF preamplifiers (MAAM-011156), and the demodulators are preceded with variable attenuators (HMC472A). Although the modulators and demodulators are specified for operation from 30MHz-1GHz, narrowband matching networks must be used to obtain good performance, thus we optimized our transceivers for 123MHz. In a typical setup, a transceiver’s TX port drives an RFPA’s input, while its RX port is connected to a pickup loop on that channel’s coil. If additional ADC ports are available, they can be used to measure other operating parameters, such as current consumption or temperature of the RFPAs.
One PXI-6738 and two PXI-6358 modules provide enough ADC inputs and DAC outputs for 16 transceivers with a max sampling rate of 350ksps. A MATLAB script and a LABVIEW runtime VI operate together to perform experiments. MATLAB generates output pulse waveforms which LABVIEW plays out of its DAC ports. At the same time, its ADC channels are sampled and recorded. After the playing the waveform, LABVIEW writes the ADC waveforms to a file which is analyzed by MATLAB. This cycle iterates until the experiment is complete.
The system may also be interfaced to MRI scanners in order to control pTX arrays in imaging experiments. To accomplish this, the scanner must produce one or more synchronization pulses which trigger the synthesizer’s operation. The trigger latency was measured at 1.85±0.1μs. The synthesizer’s timebase can also be locked to the MRI scanner through a 10MHz reference input. The LO input of the synthesizer is fed by rectangular RF pulses produces by the MRI scanner, ensuring the synthesized RF is frequency/phased lock with the MRI receivers.
An example experiment was performed in which the CNA was used to correct for nonlinearities and coupling in four channels of a 16 channel pTX array with in-bore amplifiers. The target waveform was a series of six RF pulses with PW=1ms, TR=2ms. The phase and amplitude of the pulses were varied through time and between channels. Vector iterative predistortion6 (VIP) was used as the correction strategy.
Results:
The modulators have internal offset/gain trimming DACs, which were used to calibrate each modulator to have sideband and carrier suppression of over 60dBc at 123.2 MHz. The demodulators did not have digital trimming functions, and therefore their offset/gain errors are compensated in post processing to have a suppression ratios of over 50dBc.
Figure 4 is an animated gif summarizing results of the example VIP experiment. After ten iterations, the nonlinearity and coupling of the RFPAs has been compensated, and peak EVM is constrained to 2% of the peak amplitude. It can also be seen that different channels require different current draws, despite the peak setpoint power being equal for all channels.
Discussion and conclusions:
Currently the system is limited to monitoring 8 channels due only having one ADC module. We intend to add additional ADC modules which will allow the RF and power monitoring of all 16 channels simultaneously. Another limitation of the system is the slow interface between LABVIEW and MATLAB, which is facilitated by file transfer. To make the monitoring truly real-time, we intend to combine the DAQ control and data analysis tasks into one embedded controller, using either LABVIEW or a custom-built baseband DAQ system.Acknowledgements
This work was supported by Siemens healthcare and NIH grants 1R01EB016728 and 1R01BB017219. We would also like to thank Matt Patterson for assistance in LABVIEW development.References
1. Twieg, M. & Griswold, M. A. Large-Signal Characterization of Coupled RF Amplifiers for Parallel Transmit. 22nd ISMRM (2014).
2. Stang, P., Kerr, A., Pauly, J. & Scott, G. An Extensible Transmit Array System using Vector Modulation and Measurement. 16th ISMRM (2008).
3. Yazdanbakhsh, P. et al. 16-Bit Vector Modulator for B1 Shimming in 7T MRI. 17th ISMRM (2009).
4. Ke Feng, Hollingsworth, N. A., McDougall, M. P. & Wright, S. M. A 64-Channel Transmitter for Investigating Parallel Transmit MRI. IEEE TBE 59, 2152–2160 (2012).
5. Hollingsworth, N. et al. An Easily Integrated Multichannel Modulator for all Field Strengths. 21st ISMRM (2013).
6. Stang, P., Kerr, A., Grissom, W., Pauly, J. & Scott, G. Vector Iterative Pre-Distortion: An Auto-calibration Method for Transmit Arrays. 17th ISMRM (2009).
Figures