4299
Evaluation of Different Coupling Schemes for a Dielectric Resonator in Magnetic Resonance Imaging at 600 MHz- a Simulation Approach1Bio Engineering, Pennsylvania State University, University Park, PA, United States, 2Material Research Institute, Pennsylvania State University, University Park, PA, United States, 3Engineering Science and Mechanics, Pennsylvania State University, University Park, PA, United States, 4Huck Institutes of the Life Sciences, Pennsylvania State University, University Park, PA, United States
Synopsis
The TE01δ mode of the ring Dielectric Resonator (DR) is of interest to the high field MRI community for it generates highly homogenous fields over large volumes inside the DR. The ring DRs behave differently depending on the method of coupling. Six different coupling methods using the conducting wire were simulated three dimensionally. Differences in the electromagnetic field inside the DR, depending on the coupling method, were observed in the simulation. These results were interpreted to determine the mechanism producing the highest magnetic field using triple loop coupling.
Introduction
Dielectric Resonators (DR) have high Q-values and have the potential to achieve higher signal-to-noise ratios (SNR) than standard coils. However, coupling strength has limited the signal strength and SNR. The optimum coupling scheme was found experimentally in [1], however, the mechanism behind why is still in question. In this work, three dimensional electromagnetic field simulations were explored to provide a better understanding of the optimal excitation schemes for a DR. A deeper understanding of these mechanisms can be obtained via visualization of the electromagnetic fields inside the DR [2].
Methods
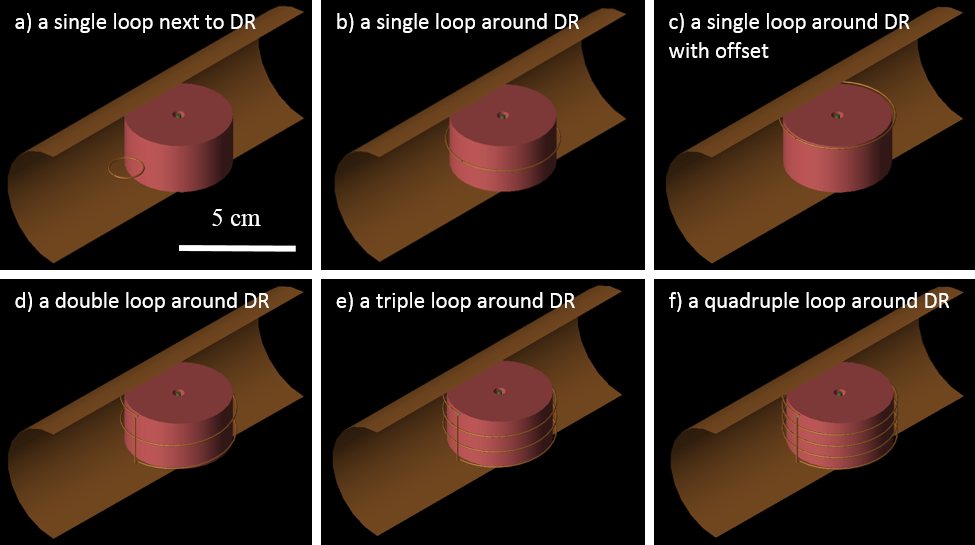
All simulations were conducted using XFdtd (Remcom Inc., State College, PA, USA), an electromagnetic field simulation software. The investigated DR had an outer diameter of 46.1mm, an inner diameter of 5.32mm, and a height of 23.9mm. The calcium titanate DR was assigned a relative permittivity of 156.7. It was then placed at the middle of a 56mm diameter and 150mm long shield. Figure 1 shows the 6 different simulated feeding schematics. The parameters were determined from the simulation: resonance frequency of the TE01δ mode, S11, transmitted power with an available power of 2.5mW, B1+ at the center of the DR, transmitted power efficiency (calculated by B1+ at the center of DR divided by square root of transmitted power), and length of the wire. The magnetic field with different phases and the B1+ map were simulated for further interpretation.Results
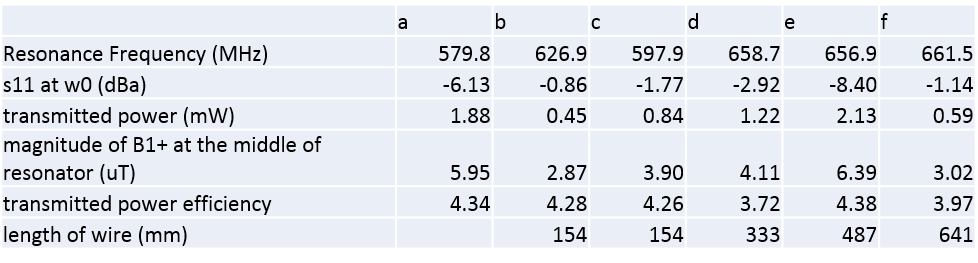
Figure 2 summarizes the measured and calculated data. Compared to the coupling schematic with the loop next to the DR, the other coupling methods showed increased TE01δ mode frequencies. The degree of frequency shift depended on the shape and location of the coupling conductor. Only the loop next to the DR and the triple loop around the DR produced significant transmitted power as ascertained from the low reflected (S11) power. The transmission power efficiencies of the double loop and quadruple loop around the DR were noticeably lower than other coupling schematics. The total length of the wire used for the triple loop around DR was closest to the full wavelength of the corresponding TE01δ mode, thus providing the best coupling of the RF signal.Discussion
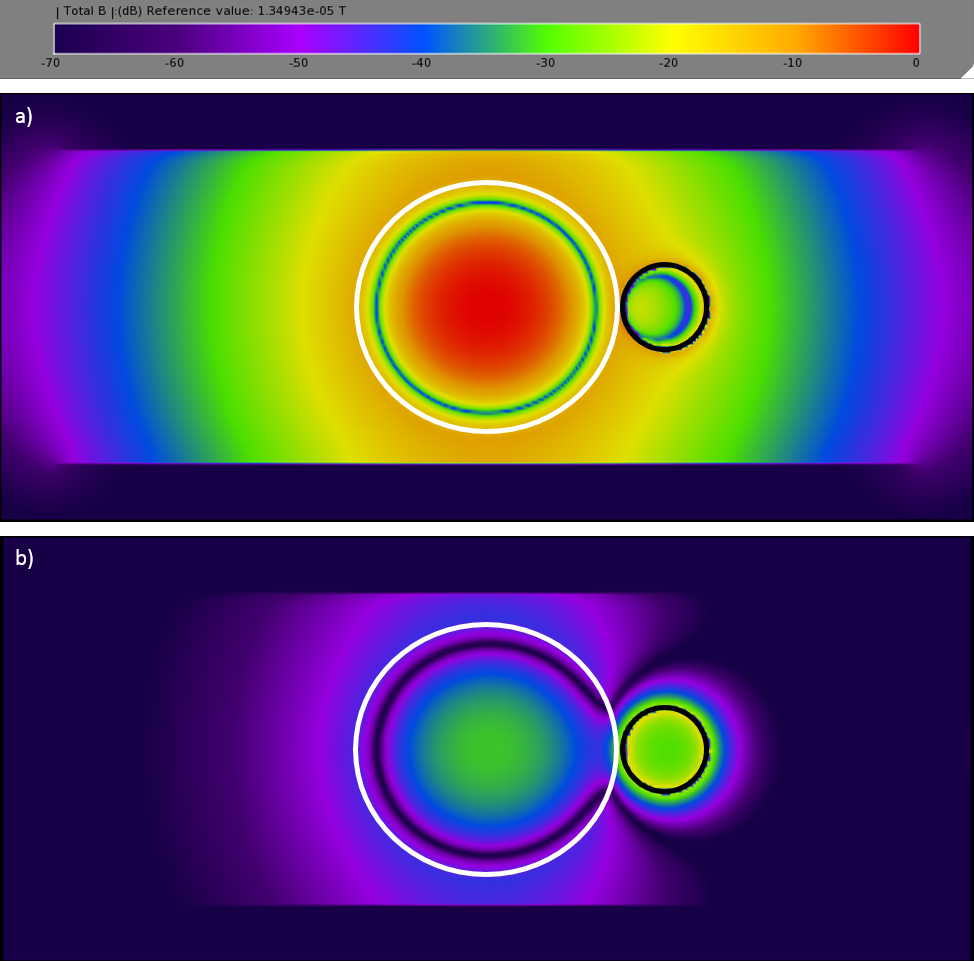
Figure 3 shows the magnitude of the magnetic field created by the DR with a single loop beside it at different phases. Figure 3 a is when the displacement current, Jd, of the DR is dominating, and figure 3 b is when conduction current, jc, of the system is dominating. The phase difference was exactly 90 ° indicating that the DR, in combination with any coupling loop, follows the equation introduced in [3] as:
$$ curl of H=jc+Jd=𝜎E+i𝜀r𝜀0ωE $$
where H is magnetic field, E is electric field, 𝜎 is conductivity, 𝜀r is relative permittivity, 𝜀0 is permittivity of free space, ω is angular frequency, and i represents for the complex unit with 90° phase shift in between the conductive and the displacement currents.
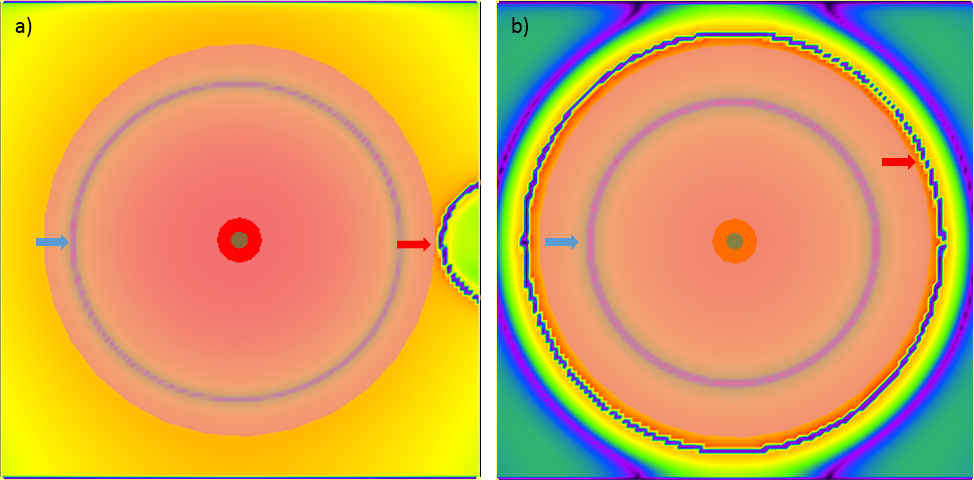
The frequency shift due to the change in the coupling methods can be explained using the B1+ magnitude map created in figure 4 of a) a single loop next to the center of DR and b) a single loop around the center of the DR. The node of the B1+ field is closer to the center when the single loop is around the DR, indicating a more compressed wave is stored. This results in an increased TE01δ frequency.
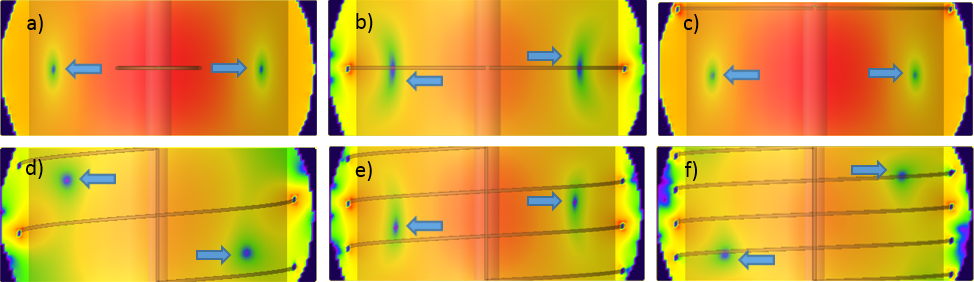
The transmitted power efficiency of the B1+ is related to the shape of the stored magnetic field in the DR. Figure 5 depicts the magnitude of the B1+ field of corresponding schematics in figure 1 on the plane that is perpendicular to the length of the shield in the middle of the DR. The double loop and the quadruple loop that created lower B1+ efficiency in figure 2 store the magnetic wave in an asymmetric way with axis running through the center of the DR.
Conclusion
Electromagnetic simulation was used to investigate the mechanism causing the maximum SNR in a DR using a combination of different coupling schemes. Overall, the result in figure 2 confirms there exists an advantage to using triple loop coupling over all other coupling methods. Only single loop next to the DR and triple loop around DR produce both high transmitted power and transmitted power efficiency. However, the triple loop around DR produces causes higher TE01δ frequency. The increased TE01δ frequency can be modulated by creating a longer DR. Longer DRs produce higher B1+ due to the larger quantity of dielectric material. This difference results in higher SNR in MRI as shown in [1].Acknowledgements
This work is supported by the National Science Foundation under Award DBI-1353664. We would also like to thank Remcom for their support regarding the EM field simulations and making XFdtd available for us.
References
[1] W. Luo, R. Liu, T. Neuberger, and M. T. Lanagan, “Numerical evaluation of the optimal coupling scheme of a cylindrical dielectric resonator operating at 600 MHz (14T),” in proceedings international society magnetic resonance medicine 24, 2016.
[2] S. J. Fiedziuszko and S. Holme, “Dielectric resonators raise your high-Q,” IEEE Microw. Mag., vol. 2, no. 3, pp. 51–60, 2001.
[3] Q. X. Yang, W. Mao, J. Wang, M. B. Smith, H. Lei, X. Zhang, K. Ugurbil, and W. Chen, “Manipulation of image intensity distribution at 7.0 T: Passive RF shimming and focusing with dielectric materials,” J. Magn. Reson. Imaging, vol. 24, no. 1, pp. 197–202, 2006.
Figures