4278
A 16-channel Dense Array for Macaque Cortices Imaging at 7TXiaotong Zhang1,2,3, Yang Gao1,2, Meizhen Qian1,4, Yi Sun5, and Anna Wang Roe1,2
1Interdisciplinary Institute of Neuroscience and Technology, Qiushi Academy for Advanced Studies, Zhejiang University, Hangzhou, China, 2College of Biomedical Engineering & Instrument Science, Zhejiang University, Hangzhou, China, 3Key Laboratory for Biomedical Engineering of Ministry of Education, Zhejiang University, Hangzhou, China, 4School of Medicine, Zhejiang University, Hangzhou, China, 5MR Collaboration NE Asia, Siemens Healthcare, Shanghai, China
Synopsis
To improve the SNR and time efficiency of monkey brain imaging, we designed a multi-channel dense receive array for use at 7T. It can be flexibly mounted over the monkey’s head and can be used for studies in both awake and anesthetized conditions. The aim of the current design focuses on visualizing sub-millimeter tissue structure and probing neuronal activities in cortices of macaques, and as demonstrated in the experiment results, good SNR and tSNR are attained in cortical layers and up to ~1cm depth beneath the skull. The area of B1 sensitivity is large enough to encompass any area of the visual cortex.
Introduction
Non-human primates are a valuable animal model in neuroscience research. To image cortical functional columns and laminar neural activity, sub-millimeter resolution is required. Existing MR acquisition sequences with high functional specificity, i.e., spin-echo-based echo planar imaging (SE-EPI) are capable of discriminating submillimeter-scale neural activity, but have much lower SNR than traditional gradient-echo-based EPI (GRE-EPI). Therefore, MR imaging with good SNR becomes critical for mapping functionally specific cortical columns in monkeys.1-5 To improve the SNR and time efficiency of such cortical imaging in monkeys, we designed a multi-channel dense receive array for use at 7T. We devised a coil that can be flexibly mounted over the monkey’s head, and can be used for studies in both awake and anesthetized conditions.Method
As Figure 1 shows, the coil design consists of a transmit-only loop and 16 peripherally located receive-only loops: the central transmit-receive coil has a diameter of 9cm and was placed ~1.5cm above the 16 receive-only loops that were built with a 1.5cm -diameter. All receive loops have on-board low- input- impedance preamplifiers, and weare placed on a <1mm thin and moderately curved 11cm-diameter spherical surface (in order to fit to the curvature of macaque heads), covering a circular area with a diameter of 5cm. The coil was constructed on a 3D- printed former made from polycarbonate using the Fused Deposition Modelling (FDM) (Virtumed LLC, Minneapolis, MN, USA). The housing was built as a cylinder-like shape with a height of 12cm and a diameter of 15cm, and with three clamps integrated on top, through which flexible water oil coolant pipe hoses can be attached for coil mounting, positioning and fixation. All measurements were performed on a 7T research scanner (Siemens Healthcare, Erlangen, Germany) equipped with a whole-body gradient set (70mT/m and 200T/m/s). Images were acquired in an anesthetized macaque (female, 2 years old, 3.5kg) placed in the prone position inside the MRI bore. Anesthesia was maintained with sufentanyl (3ug/kg) and 0.3-0.5% isoflurane. All procedures were in accordance with NIH standards and approved by our Institutional Animal Care Committee. The coil was mounted over the macaque head overlying visual cortical areas. The spatial SNR and the noise correlation matrix6 were measured and calculated on an imaging plane that was aligned in parallel with the loop array surface to enclose the cortex area; on a slice with such orientation, the g-factor maps were obtained, and anatomical images of T2-weighted 2D TSE and T2*-weighted 2D GRE images were acquired with an acceleration rate of 3 along F/H phase encoding direction (TSE: TE 51ms, TR 7500ms, matrix size 640×640×12, FOV 64mm, slice thickness 1mm, FA 160°, turbo factor 5, 2 averages, scan time 11’38”; GRE: TE 25ms, TR 2000ms, matrix size 960×960×12, FOV 72mm, slice thickness 1mm, FA 60°, 2 averages, scan time 22’44”). To quantify the temporal stability of the echo-planar images, the time-course SNR (tSNR) was determined through a prototype single-shot GRE-EPI sequence and a SE-EPI sequence7 with an acceleration rate of 3 along the F-H direction (GRE-EPI) (GRE-EPI: TE 23ms, TR 2000ms, matrix size 96×96×12, resolution 1mm isotropic, BW 1184 Hz/Px, 100 measurements; SE-EPI: TE 38ms, TR 2000ms, matrix size 96×96×12, resolution 1mm isotropic, BW 1184 Hz/Px, 100 measurements).Results
As shown in Fig.2, all 16 receive loops were well decoupled, and loaded S21 ranged from -53 dB to -13 dB; spatial SNR in the visual cortex area was overall above ~400 for a voxel size of 0.5×0.5×3 mm3. 1/G factors are calculated and shown in Fig.3 for R-L and F-H accelerations; good performance can be attained with an acceleration rate of 3. Detailed structural information can be visualized in anatomical scans as discerned in the GRE image in Fig.4, including the diving cortical pial vessels and cortical laminar patterns. Fig.5 shows an assessment of tSNR for BOLD imaging, and for either GRE-EPI or SE-EPI, the profile shows the configuration is sufficient for functional experiments at 1mm isotropic resolution and with an acceleration rate of 3.Discussion and Conclusion
The presented 16-channel dense array can be mounted closely to the proximity of the macaque head, providing a substantially improved SNR profile and data acquisition acceleration performance. When combined with a stereotactxic apparatus (shown in Fig.1), the present coil can be flexibly mounted to the macaque head (both awake and anesthetized) for brain imaging at 7T. The aim of current design focuses on visualizing sub-millimeter tissue structure and probing neuronal activities in cortices of macaques, and as demonstrated in Fig.2, Fig.4 and Fig.5, good SNR and tSNR is attained in cortical layers and up to ~1cm depth beneath the skull. The area of B1 sensitivity should be large enough to encompass any area of the visual cortex.Acknowledgements
We would like to thank Guohua Xu, Bin Xu, and Dengfeng Zhou for animal handling, and Lawrence Wald, Gregor Adriany, and Jonathan Polimeni for helpful discussions. This work was supported in part by National Natural Science Foundation of China (81701774, 61771423) and Fundamental Research Funds for the Central Universities (2016QN81018).References
1. Gilbert K M, Gati J S, Barker K, et al. Optimized parallel transmit and receive radiofrequency coil for ultrahigh-field MRI of monkeys[J]. Neuroimage, 2016, 125:153. 2. Goense J, Logothetis N K, Merkle H. Flexible, phase-matched, linear receive arrays for high-field MRI in monkeys.[J]. Magnetic Resonance Imaging, 2010, 28(8):1183. 3. Janssens T, Keil B, Farivar R, et al. An implanted 8-channel array coil for high-resolution macaque MRI at 3 T[J]. Neuroimage, 2012, 62(3):1529-1536. 4. Keil B, Wiggins G C, Triantafyllou C, et al. A 20-channel receive-only mouse array coil for a 3T clinical MRI system. Magnetic Resonance in Medicine, 2011, 66(2):584-95. 5. Adriany G, Harel N, Yacoub E, et al. A 21 channel Transceiver Array for Non-human Primate Applications at 7 tesla. Proceedings of ISMRM, 2010, 1490. 6. Kellman P. Erratum: Image reconstruction in SNR units: A general method for SNR measurement (Magnetic Resonance in Medicine (2005) 54, (1439-1447))[J]. Magnetic Resonance in Medicine, 2007, 58(1):211-212. 7. Auerbach E J, Xu J, Yacoub E, et al. Multiband accelerated spin-echo echo planar imaging with reduced peak RF power using time-shifted RF pulses[J]. Magnetic Resonance in Medicine, 2013, 69(5):1261.Figures
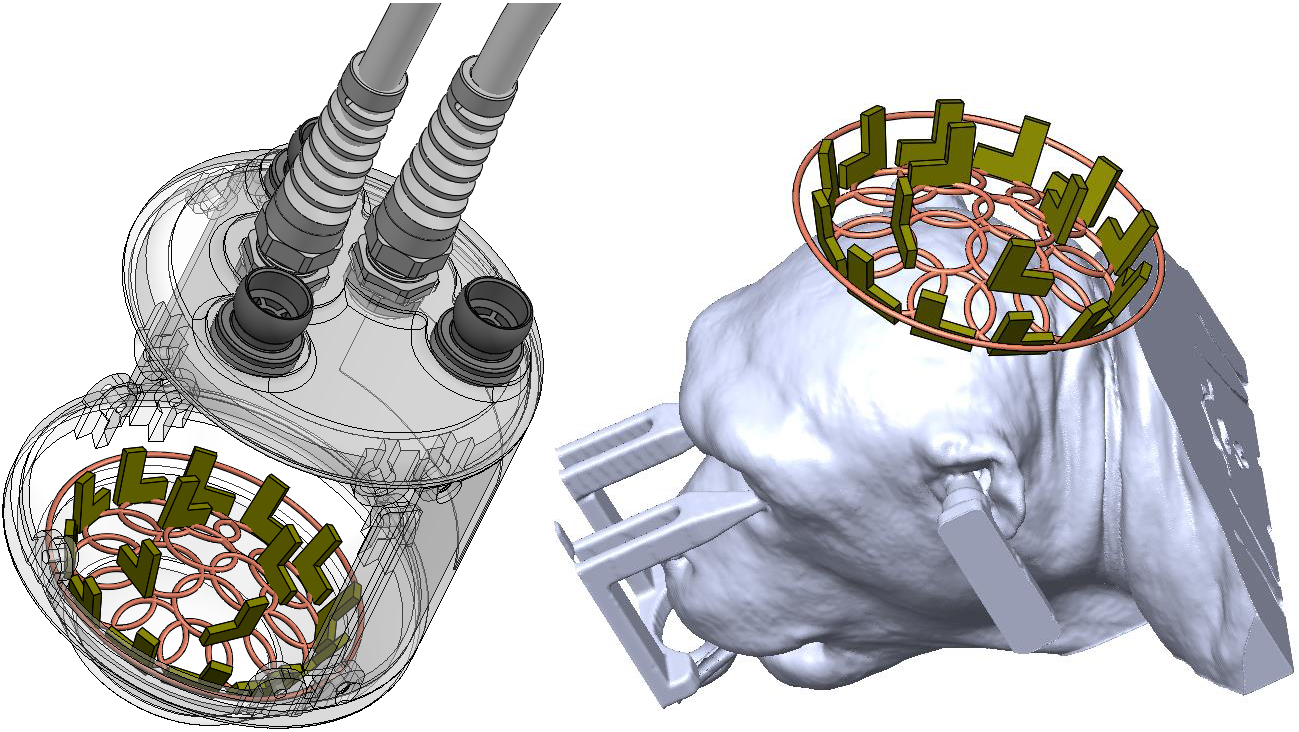
Fig.1.
An illustration of the coil housing, coil element arrangement, and coil
mounting to the macaque.
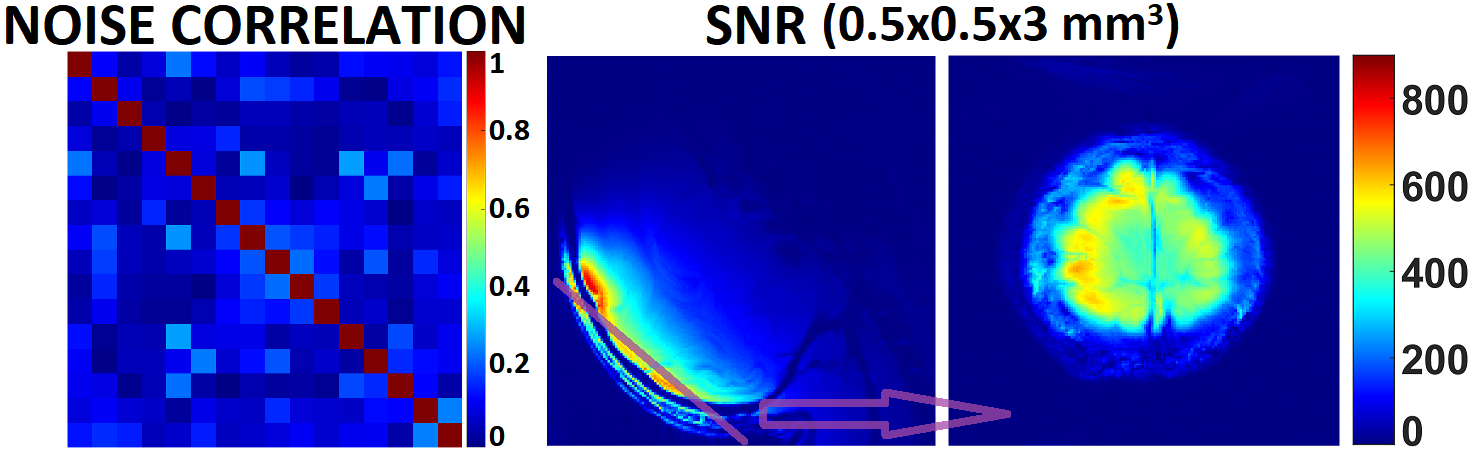
Fig.2. Noise correlation coefficient matrix and SNR maps.
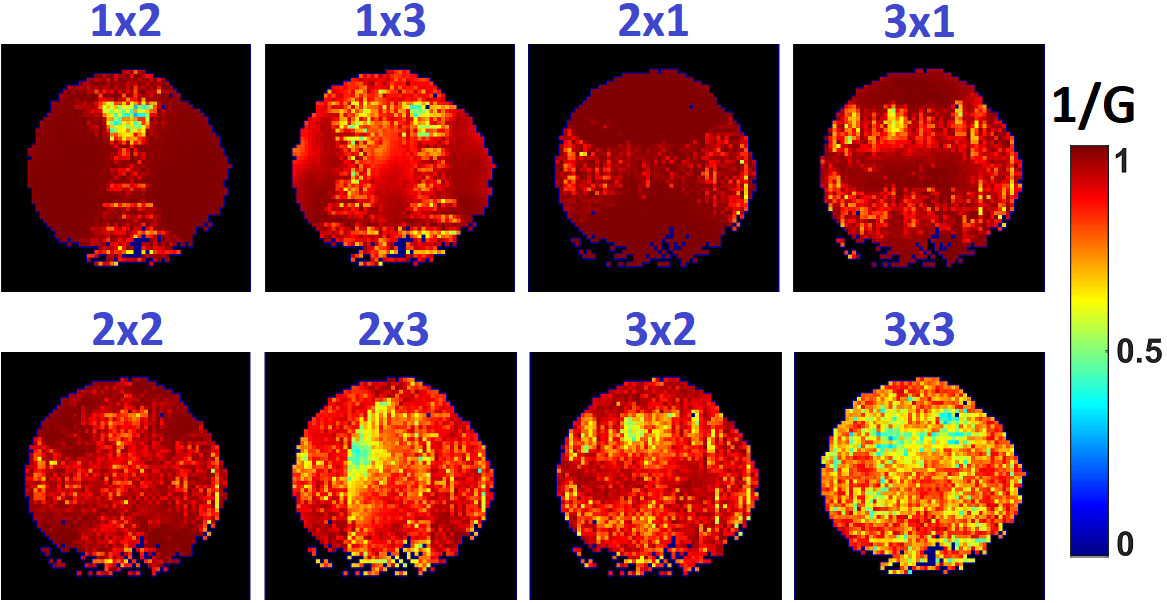
Fig.3.
1/g factor maps for R-L and F-H accelerations on a slice in parallel to the
array surface.
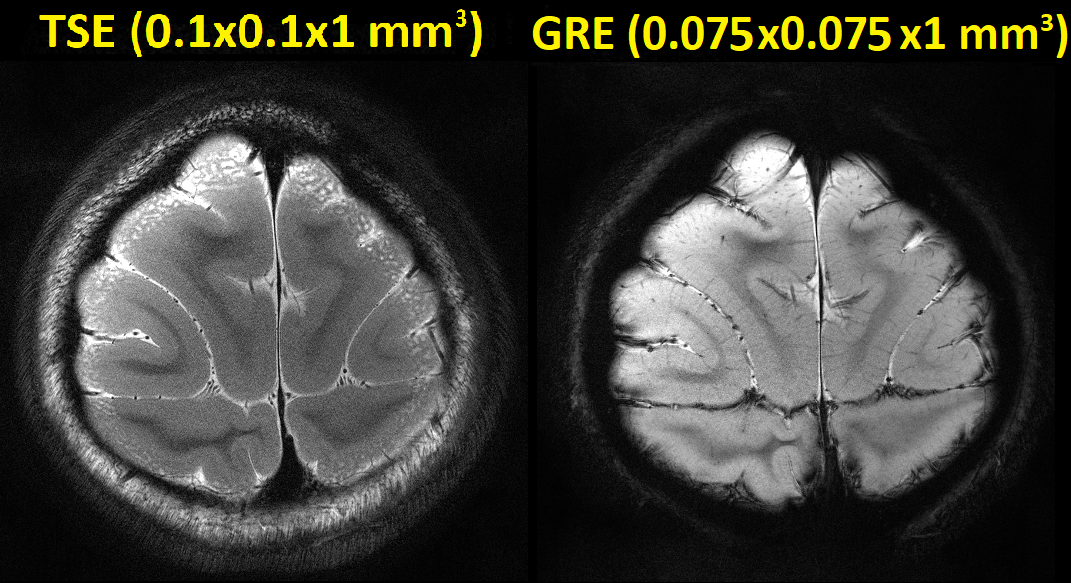
Fig.4.
High-resolution TSE (2 averages, 11’38”) and GRE (2 averages, 22’44”) images on
a slice in parallel to the array surface.

Fig.5.
The time-course SNR determined through a prototype single-shot GRE-EPI sequence
and a SE-EPI sequence5 with an acceleration rate of 3 along the F-H
direction. The tSNR was calculated for each
voxel as the mean value across the 100 time points divided by that voxel’s
temporal standard deviation.