4270
Simultaneous Diffusion, PD, T1, and T2 Mapping with Optimized MR Fingerprinting EPI1Radiology, MGH Athinoula A. Martinos Center/Harvard Medical School, Charlestown, MA, United States, 2Physics, Harvard University, Cambridge, MA, United States
Synopsis
MR Fingerprinting (MRF) is a recent technique for simultaneous acquisition of multi-parametric tissue maps. Beyond the proton density (PD), T1 and T2 maps routinely obtained with conventional MRF sequences, quantitative diffusion maps are of great clinical interest but are challenging to acquire due to long scan times and poor resolution. In previous work we’ve demonstrated an optimized MRF EPI sequence that allows short scan times. Here we characterize its diffusion sensitivity and demonstrate its potential for simultaneous mapping of PD, T1, T2 and diffusion.
Introduction
Quantitative tissue mapping has the potential to improve disease characterization. Measurement of water diffusion, in particular, has shown clinical relevance in addition to T1 and T2 mapping alone (1). However, current protocols for multi-parametric mapping suffer from poor sensitivity, require long acquisition times, and produce diffusion maps with low spatial resolution. In previous work (2–4) we described an optimized MRF EPI sequence which can yield accurate relaxation maps in 3-5 seconds. In this work we characterize the sensitivity of our sequence to diffusion, and exploit this by demonstrating the feasibility of simultaneously obtaining diffusion maps in addition to PD, T1, and T2 maps.
Methods
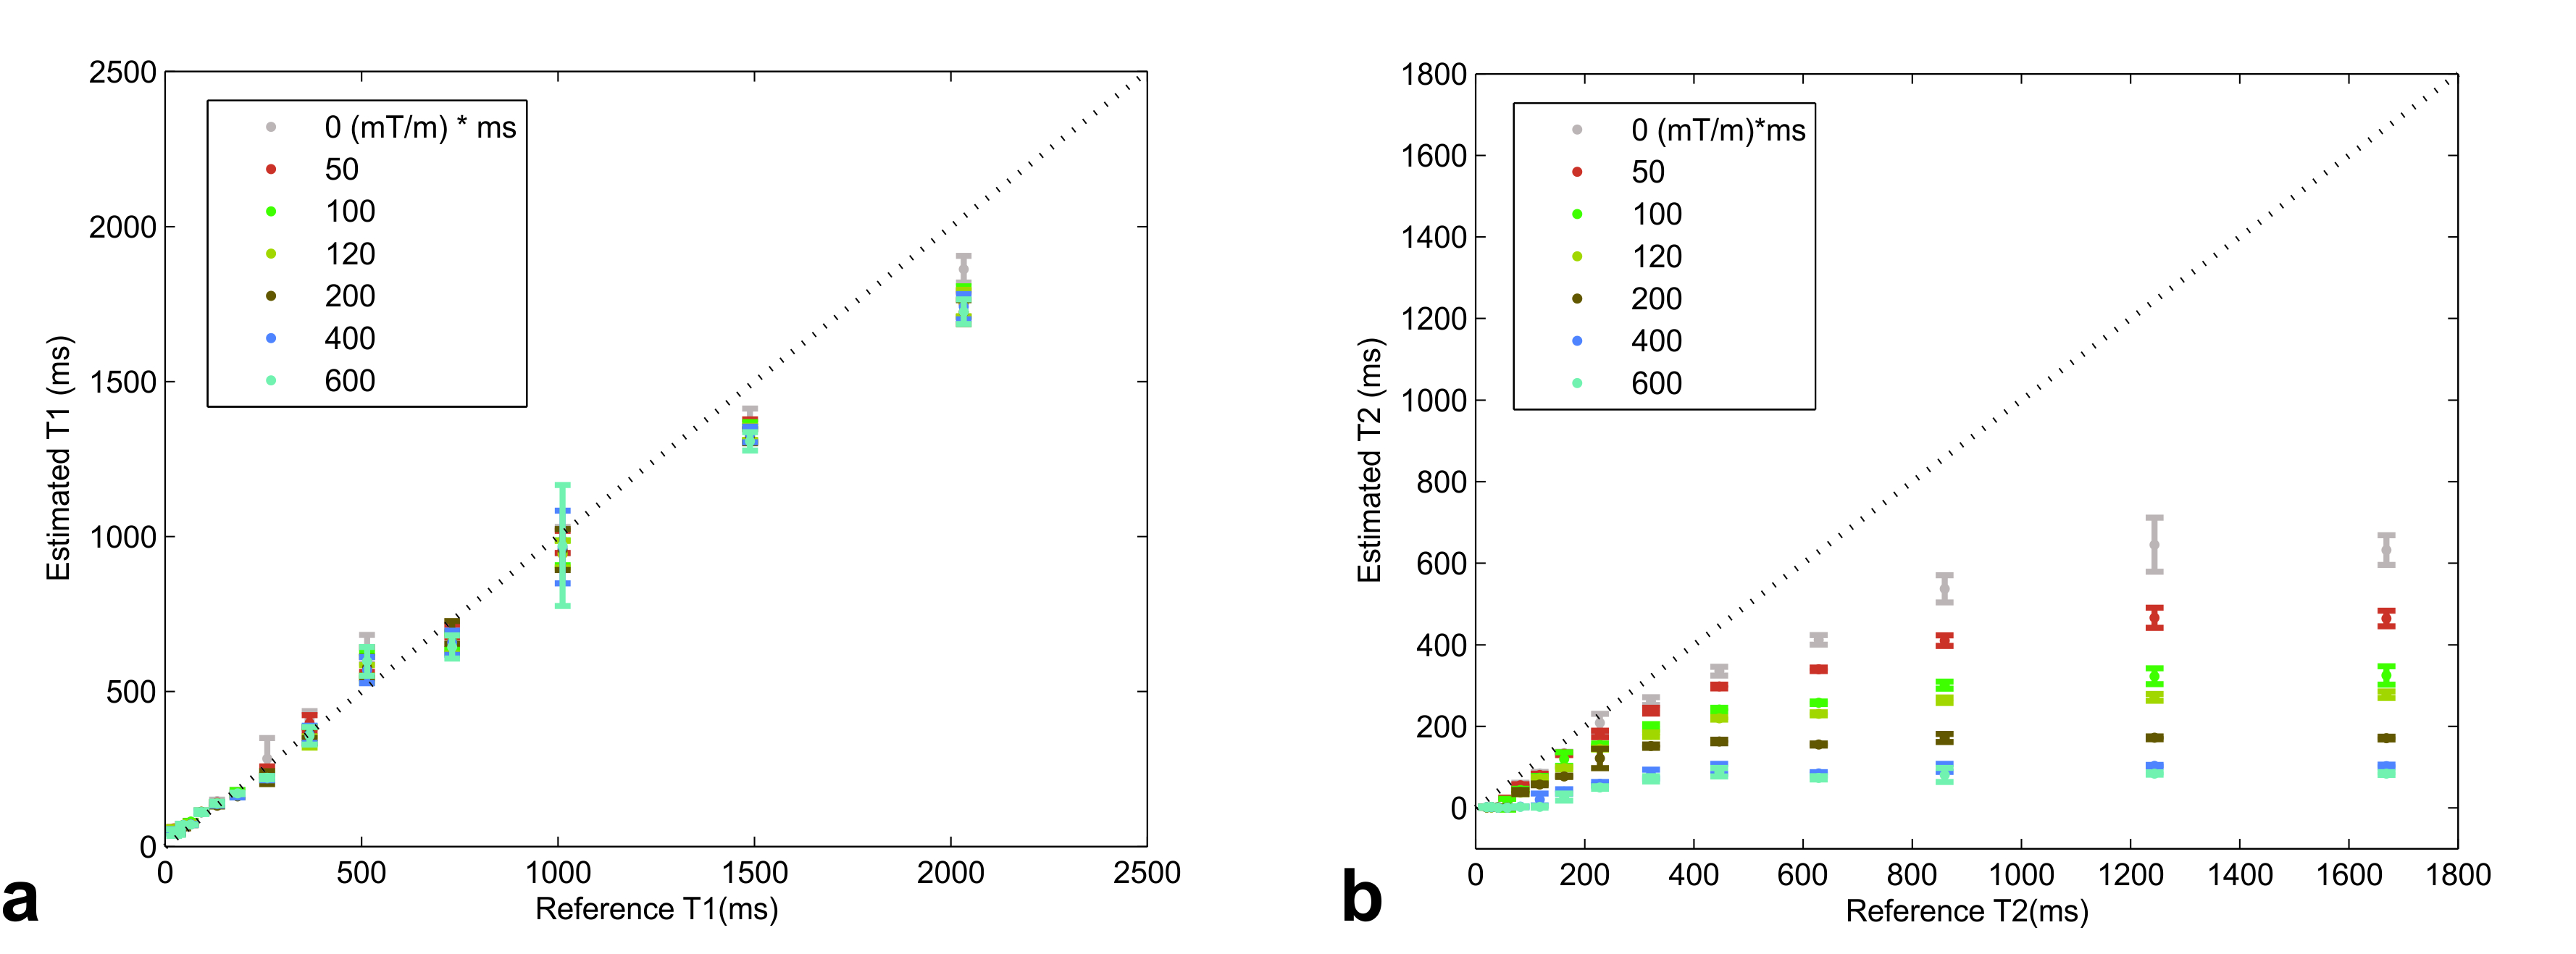
The optimized MRF EPI pulse sequence is illustrated in Fig. 1. The sensitivity of the sequence to diffusion was tested in the ISMRM/NIST phantom (5). The phantom was scanned on a 1.5 T Siemens Avanto scanner (Siemens Healthineers, Erlangen, Germany) using the manufacturer’s body coil for transmit and 32 channel coil for receive with the following acquisition parameters: TI/TE/BW/Slice Thickness/Resolution/matrix size=19/16 ms/2298 Hz/pixel/5 mm/2×2 mm2/128×128. An acceleration factor of R=2 was used with an online GRAPPA (6) reconstruction and N=25 frames. The acquired data was matched to two separate dictionaries, generated with the extended phase graph formalism (7), consisting of T1 values in the range 1-2100 ms and T2 in the range 1-1800 ms and a constant apparent diffusion coefficient (ADC) of 0 (no diffusion) or 3×10⁻³ mm2/s (free water diffusion). The resulting T1 and T2 values in each phantom compartment were compared to the NIST reference values (5). In a second experiment, this process was repeated multiple times but with different values of the spoiler gradient moment. The in vivo applicability of this method was tested in a healthy 35 year old subject who provided IRB-approved consent. The subject was scanned with the variable gradient moment sequence using the following gradient moment values: 0, 120, 400 and 600 mT/m × ms for a total scan time of ~11 seconds. Each dataset was reconstructed with the ADC = 0 dictionary defined above and the variation in the resulting T2 values fit voxel-wise to an exponential function.
Results
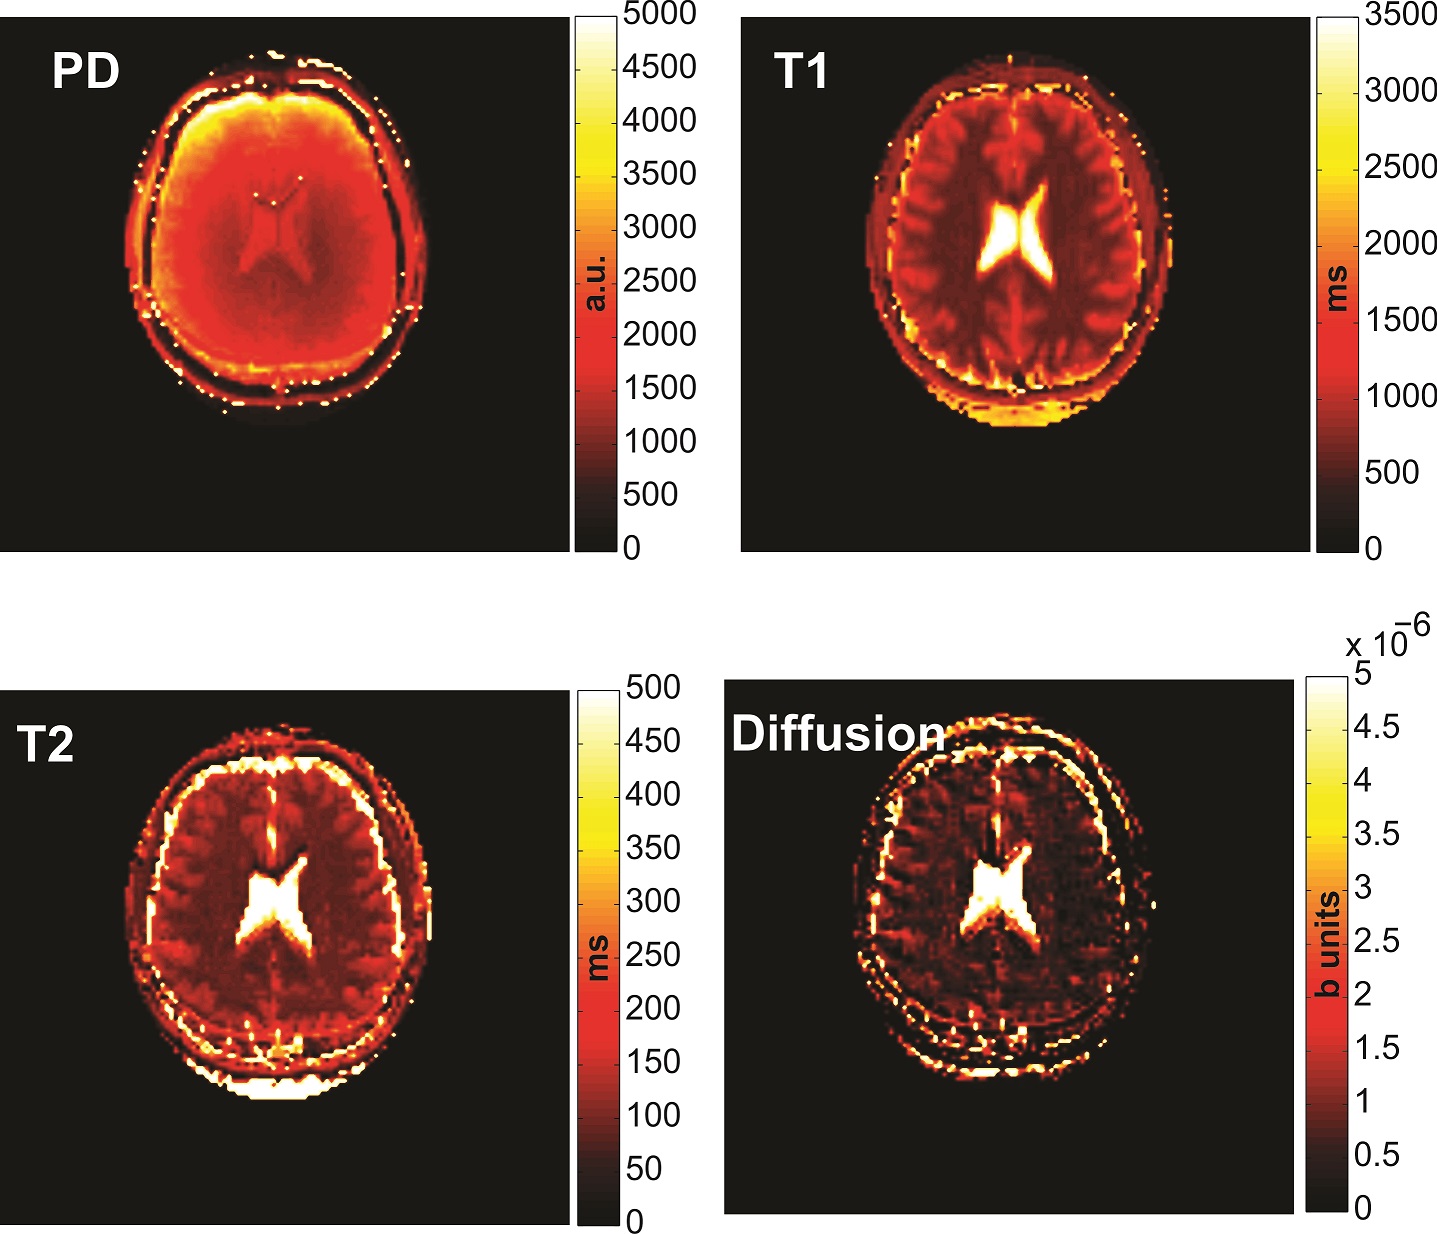
The estimated MRF T1 and T2 values for the no-diffusion and free diffusion cases are shown in Fig. 2 in comparison to the reference values. T1 accuracy was similar in both cases (RMSE=90 ms vs 96 ms) but T2 accuracy was significantly improved (RMSE=42 ms vs 444 ms) when diffusion was accounted for. Vials with long T2 showed increased sensitivity to the effects of diffusion. Varying the gradient moment had minimal effect on the reconstructed T1 values (Fig. 3a) but significant effect on the reconstructed T2 values (Fig 3b). In vivo PD, T1, T2 and diffusion maps obtained with the proposed protocol are shown in Fig. 4.
Discussion
The large spoiler gradient in the MRF EPI sequence sensitizes the sequence to diffusion. Magnetization in compartments with longer T2 values (e.g. CSF) experiences a greater number of spoiler gradients before the magnetization is fully decayed and, combined with their larger diffusion coefficient, are therefore more strongly affected as shown in Fig 2. As shown in Fig. 3, sensitizing the sequence to diffusion of tissues with shorter T2 (e.g. grey, white matter) can be achieved by increasing the spoiler gradient amplitude or duration. Unlike conventional diffusion sequences, this does not require increasing the minimum TE since the gradient is placed after the readout so no signal loss is incurred. Because diffusion, in common with T2 relaxation, causes an exponential decay exp(-bD) in the signal (Fig. 3), the matched T2 values can be used to extract the underlying diffusion coefficient. To obtain the diffusion values in physical units requires calculation of the sequence b values which can be calculated numerically (8) or analytically.
Unlike conventional MRF sequences (9), the EPI sequence used here uses relatively long TRs. This allows the use of larger gradient moment values, increasing the diffusion sensitivity of the sequence without significantly increasing the total scan time.
Although T1 and T2 relaxation rates theoretically depend on the temperature, the NiCl2 solution used in the phantom construction has been shown to have only a minimal T2 temperature dependence for the temperature range tested (5).
Conclusion
We have demonstrated an initial proof-of-concept of simultaneous PD, T1, T2 and diffusion measurements using the optimized MRF EPI sequence. The use of a single pulse sequence eliminates the need for co-registration of the different maps. Future work will focus on optimizing the diffusion sensitivity of the sequence and further reducing scan time.
Acknowledgements
This work was supported in part by the MGH/HST Athinoula A. Martinos Center for Biomedical Imaging. The authors gratefully acknowledge Dr. Brian Hargreaves for use of the EPG code (http://med.stanford.edu/bmrgroup/software.html) and Dr. Assaf Tal for helpful discussions.References
1. Sorensen AG, Copen WA, Østergaard L, Buonanno FS, Gonzalez RG, Rordorf G, Rosen BR, Schwamm LH, Weisskoff RM, Koroshetz WJ. Hyperacute stroke: simultaneous measurement of relative cerebral blood volume, relative cerebral blood flow, and mean tissue transit time. Radiology 1999;210:519–527.
2. Cohen O, Sarracanie M, Armstrong BD, Ackerman JL, Rosen MS. Magnetic resonance fingerprinting trajectory optimization. In: Proceedings of the International Society of Magnetic Resonance in Medicine. Milan, Italy; 2014. p. 0027. 3. Cohen O, Rosen MS. Algorithm comparison for schedule optimization in MR fingerprinting. Magn. Reson. Imaging 2017.
4. Cohen O, Sarracanie M, Rosen MS, Ackerman JL. In Vivo Optimized MR Fingerprinting in the Human Brain. In: Proceedings of the International Society of Magnetic Resonance in Medicine. Singapore; 2016. p. 0430.
5. Keenan KE, Stupic KF, Boss MA, et al. Multi-site multi-vendor comparison of T1 measurement using ISMRM/NIST system phantom. In: Proceedings of the International Society of Magnetic Resonance in Medicine. Singapore; 2016. p. #3290.
6. Griswold MA, Jakob PM, Heidemann RM, Nittka M, Jellus V, Wang J, Kiefer B, Haase A. Generalized autocalibrating partially parallel acquisitions (GRAPPA). Magn. Reson. Med. 2002;47:1202–1210.
7. Weigel M. Extended phase graphs: Dephasing, RF pulses, and echoes-pure and simple. J. Magn. Reson. Imaging 2015;41:266–295.
8. Weigel M, Schwenk S, Kiselev V, Scheffler K, Hennig J. Extended phase graphs with anisotropic diffusion. J. Magn. Reson. 2010;205:276–285.
9. Jiang Y, Ma D, Wright K, Seiberlich N, Gulani V, Griswold MA. Simultaneous T1, T2, diffusion and proton density quantification with MR fingerprinting. Proc. Int. Soc. Magn. Reson. Med. 2014:0028.
10. Vesanen PT, Zevenhoven KC, Nieminen JO, Dabek J, Parkkonen LT, Ilmoniemi RJ. Temperature dependence of relaxation times and temperature mapping in ultra-low-field MRI. J. Magn. Reson. 2013;235:50–57.
11. Holz M, Heil SR, Sacco A. Temperature-dependent self-diffusion coefficients of water and six selected molecular liquids for calibration in accurate 1H NMR PFG measurements. Phys. Chem. Chem. Phys. 2000;2:4740–4742.
Figures
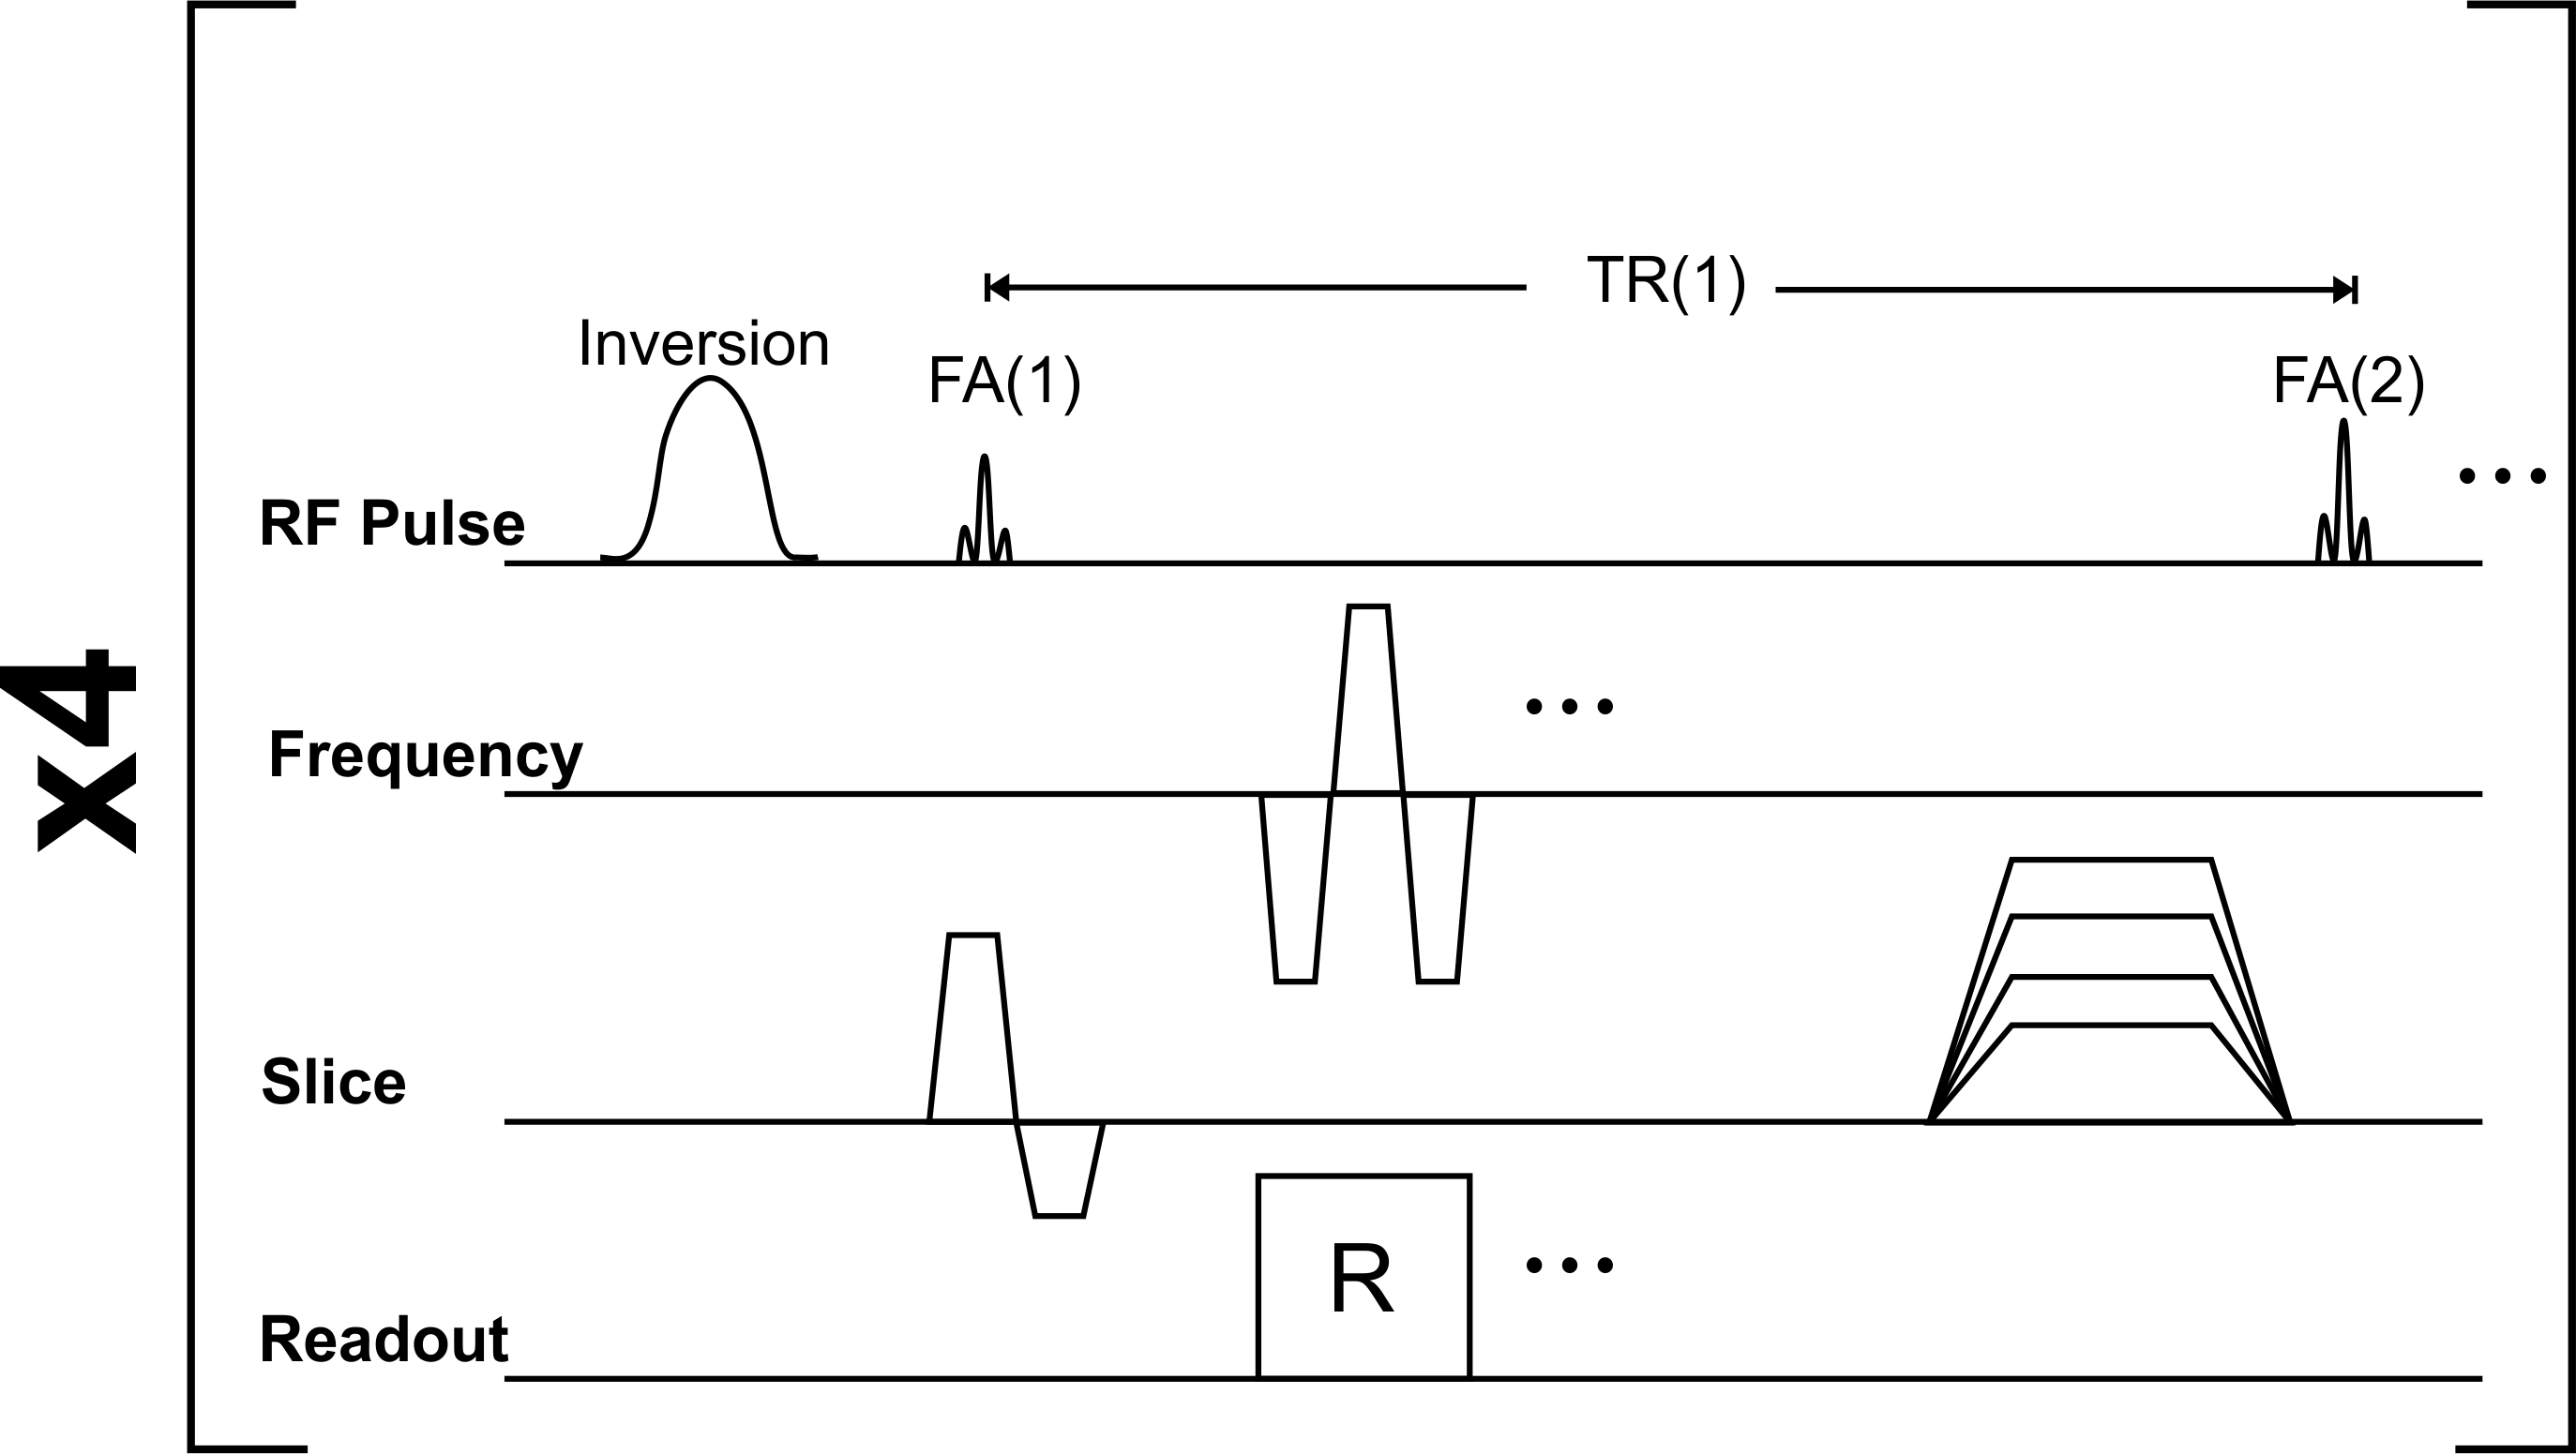
Fig. 1: Diagram of the MRF EPI sequence. The flip angles and repetition times were determined by the optimized schedule. In some experiments the spoiler gradient moment in the slice direction was varied to sensitize the sequence to diffusion effects.
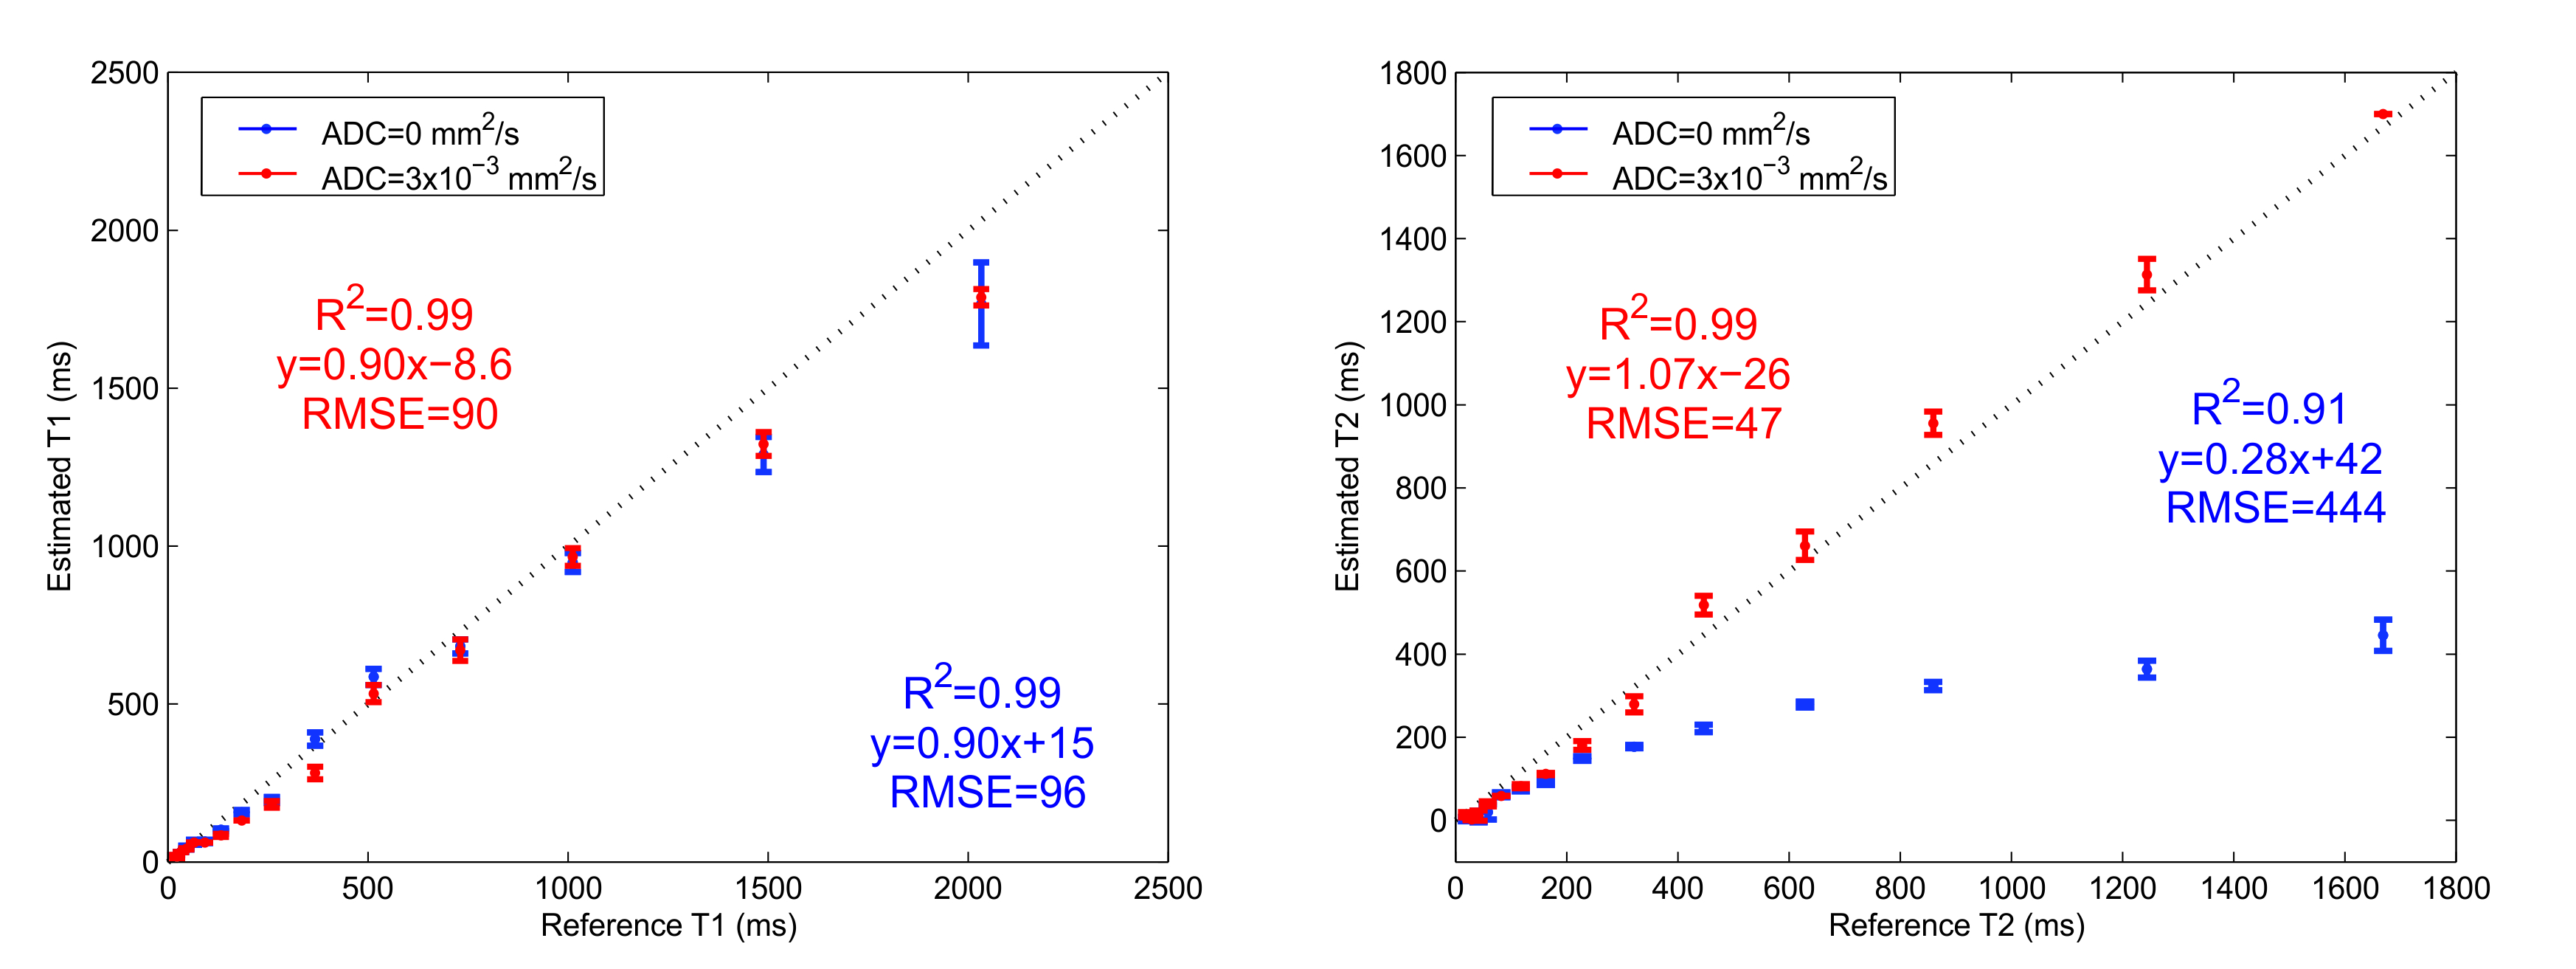
Fig. 2: Comparison between the T1/T2 estimated with the MRF EPI sequence and the reference NIST values for reconstruction dictionaries with different ADCs. The dashed line is the identity line. The error in T2 was large when diffusion was unaccounted for.