4264
Influence of Off-resonance on FISP Magnetic Resonance Fingerprinting (FISP-MRF)1Siemens Healthcare GmbH, Application Development, Erlangen, Germany, 2Georg-August-Universität Göttingen, Göttingen, Germany, 3Friedrich-Alexander Universität Erlangen-Nürnberg, Erlangen, Germany
Synopsis
FISP-MRF is a robust method to acquire T1 and T2 maps. The unbalanced gradient in slice-selection direction should reduce the sensitivity of FISP-MRF on off-resonances. This work investigated the dependency of T1 and T2 values on field inhomogeneities in simulations and measurements on phantoms and in vivo by applying different spatial magnetic field offsets. Depending on the sequence implementation, the measured T1 and T2 values were altered in different ways by the off-resonances. Outcomes showed that the actual implementation of the dephasing moment strongly affects the results. Using a constant instead of variable TR further reduced the sensitivity to off-resonances.
Introduction
Magnetic Resonance Fingerprinting (MRF)1 acquires non-steady-state signal evolutions in order to derive quantitative T1 and T2 relaxation maps. As compared to a TrueFISP-based approach, FISP-based MRF2 does not show the typical banding artifacts caused by off-resonance effects. This assumes that the unbalanced gradients cause a dephasing of at least 2π within the voxel, typically applied along the slice-selection axis. However, the signal formation by slice-selective excitation results in a complex interdependency of applied dephasing and off-resonance. In this work, this dependency is investigated experimentally.Methods
MR scans were performed on two 3T systems (MAGNETOM Skyra and MAGNETOM Prisma, Siemens Healthcare, Erlangen, Germany) with a 20-channel head coil. A 2D FISP-MRF prototype sequence2 with a prescan-based B1-field correction and the following parameters was used: FOV 300 mm, resolution 1.17x1.17x5 mm3, variable TR (12-15) ms and FA (5°-75°), 3000 repetitions, 48-fold undersampling with a previously published rotation scheme3 and unbalanced slice-select gradient resulting in 8π dephasing.
In
a first series of experiments, MR scans of a healthy volunteer and on two
phantoms were performed. Additional offsets to the static magnetic field (B0)
were applied by manipulating the scanner's shim currents and system frequency.
As phantoms, a homogenous home-made, head-shaped gel phantom and the
quantitative MRI (qMRI) ISMRM System
Phantom (High Precision Devices, Inc., Colorado, USA) were used.
In a second series of experiments, the spatial encoding was changed from a 2D
Spiral to a Cartesian readout along the x-axis without phase encoding,
resulting in a 1D-projection4 of the scanned phantom along the
y-axis. The phantom consisted of five tubes from the Eurospin Test Object 5
phantom (Eurospin II Test System, Diagnostic Sonar Ltd., Edinburgh, UK). The
measurements were carried out for four different sequence variants: without
additional dephasing gradient (V1), with additional dephasing gradient applied
at the end of each TR in slice-selection direction resulting in 8π dephasing
(V2), V1 with constant TR (V3), V2 with constant TR (V4). Additionally, a Bloch
simulation5 was performed to simulate the theoretical signal for
different off-resonances and dephasing moments. V4 was measured in vivo as
well.
Results
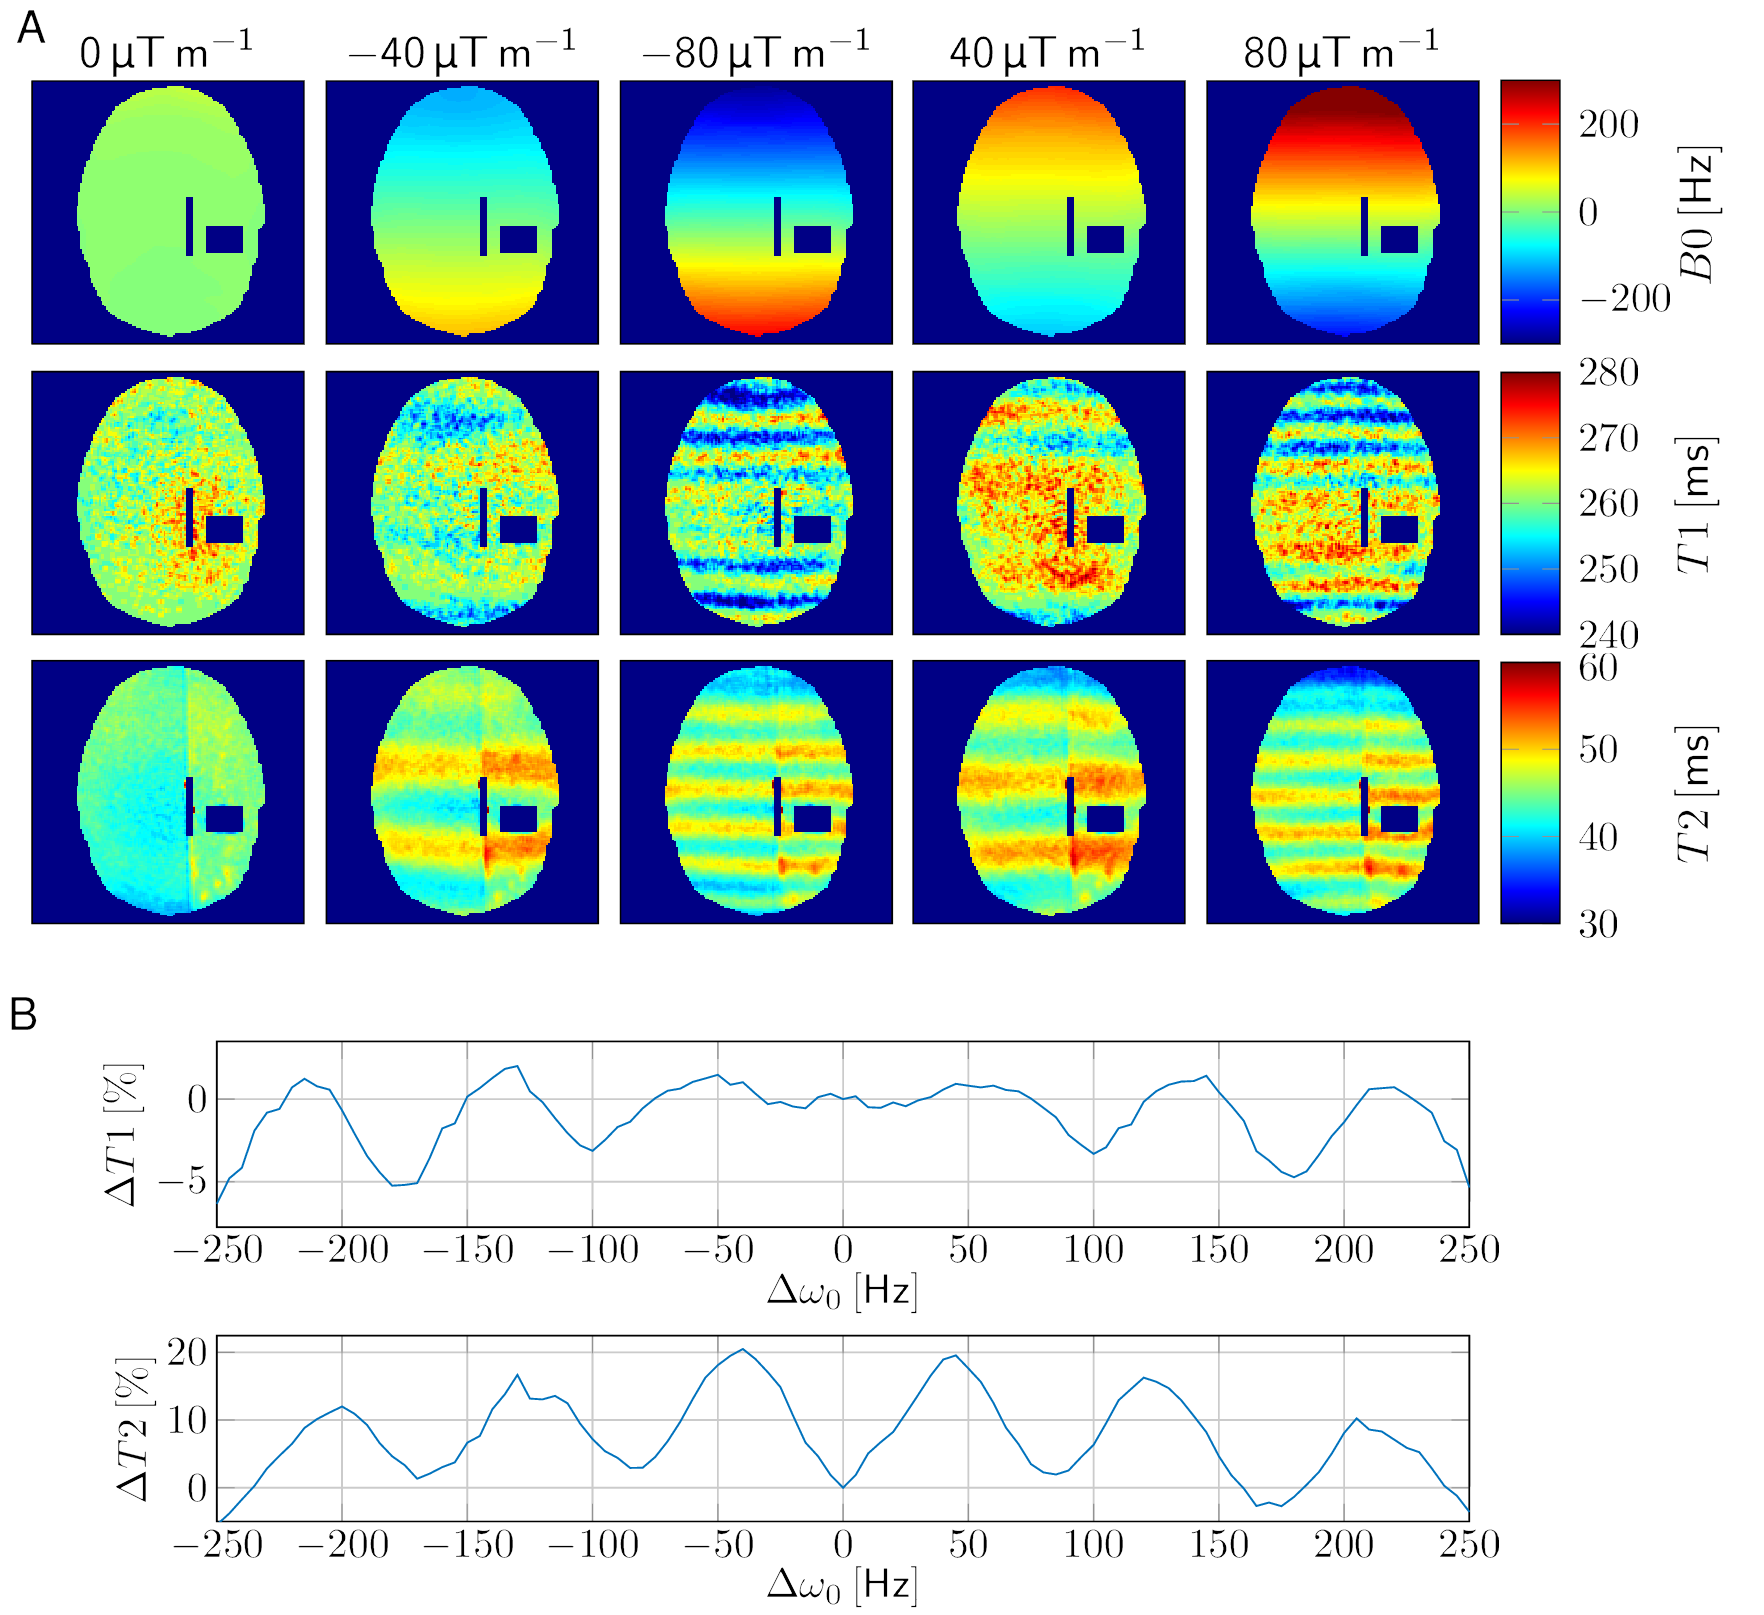
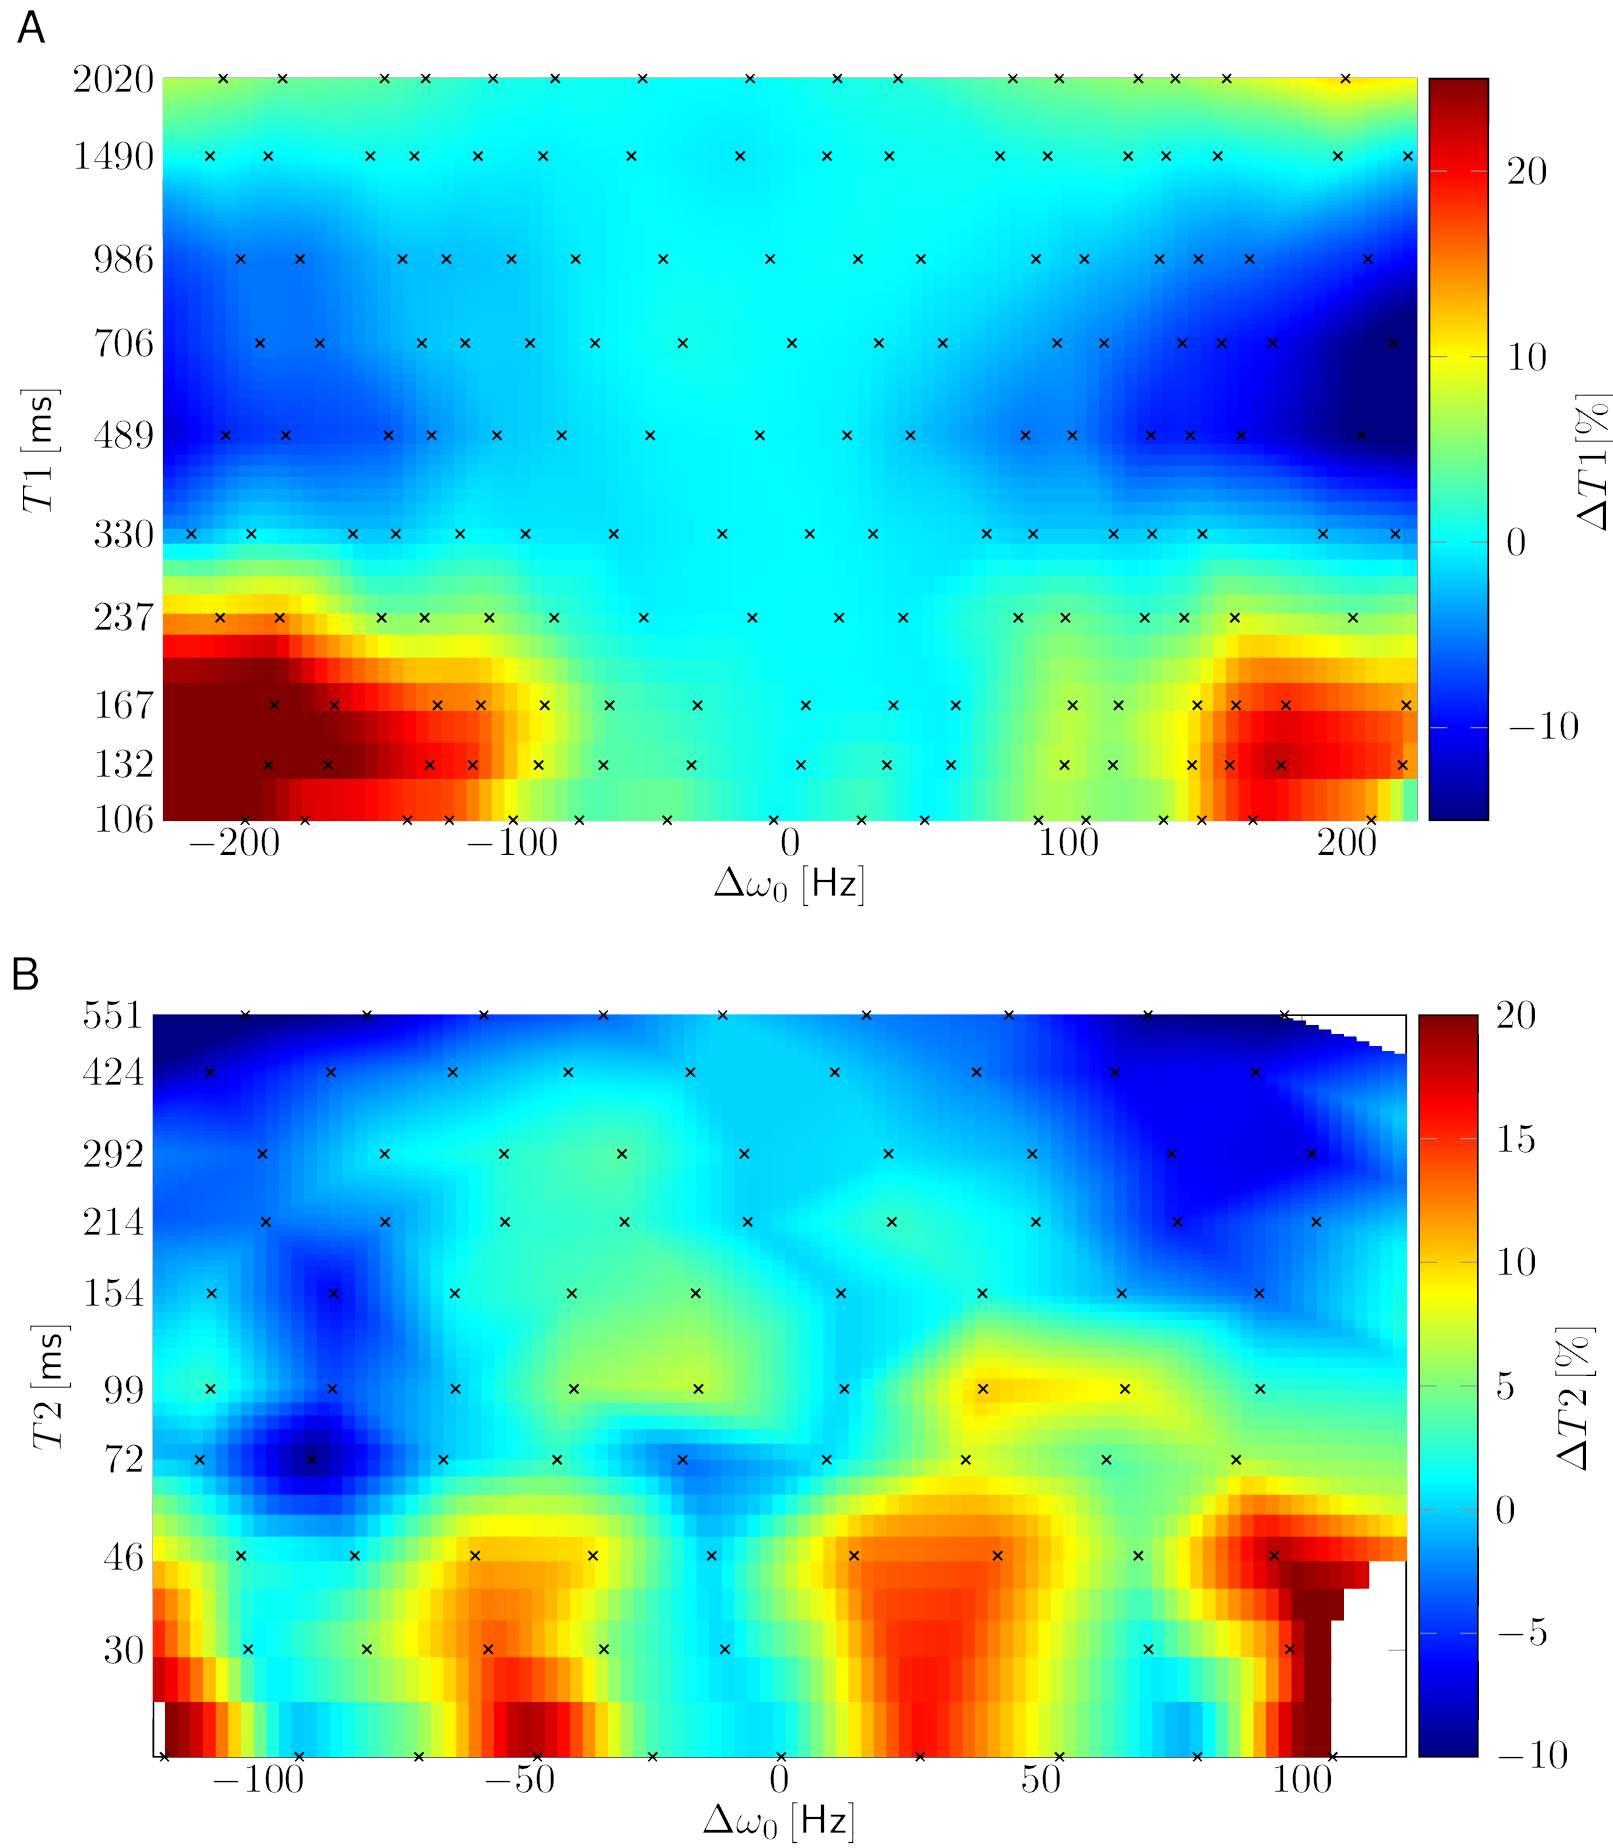
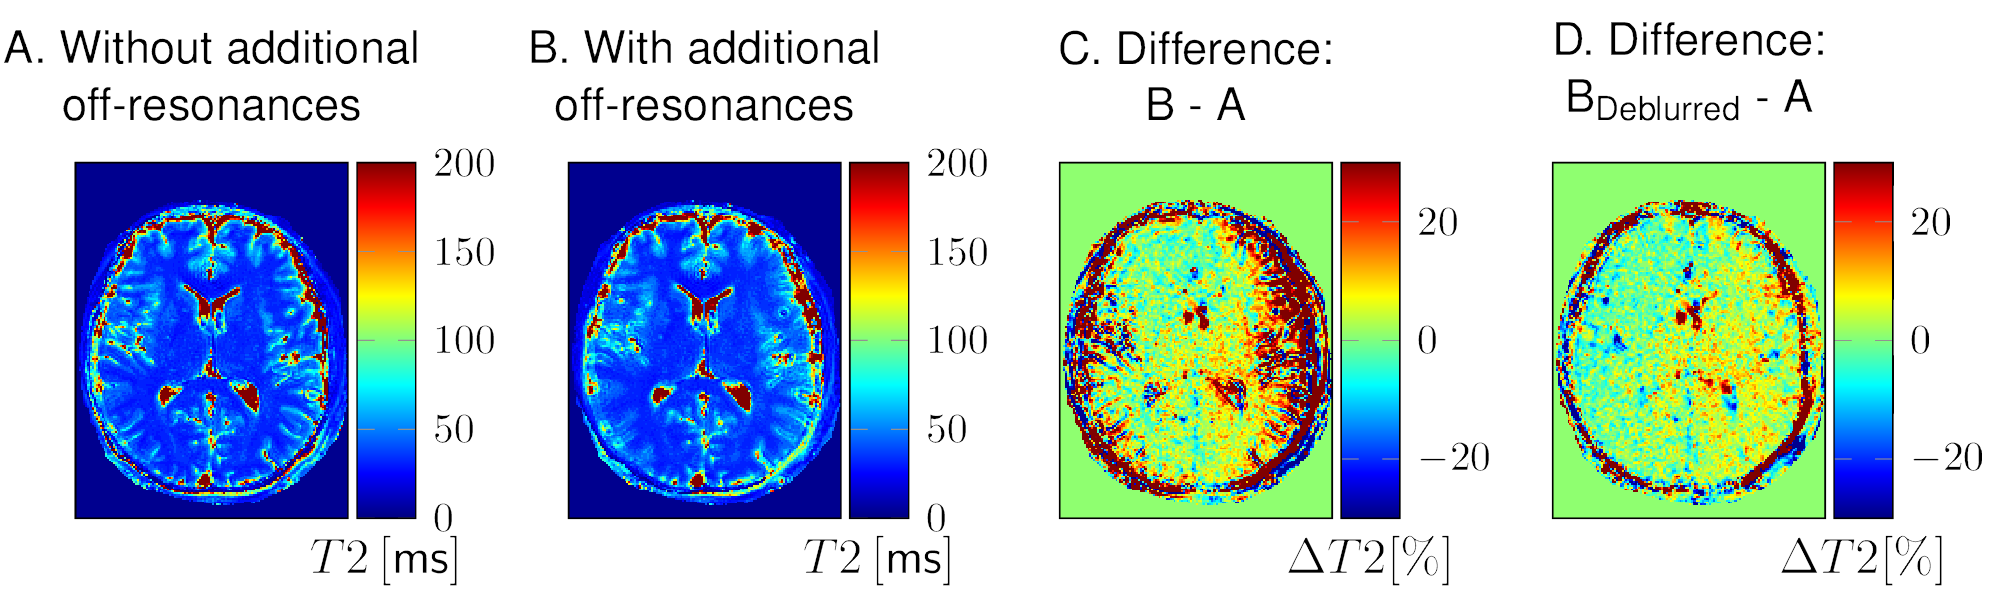
Additional linear field inhomogeneities (Figure 1B) in a human brain (Figure 1A) led to blurring of the parameter maps in regions with high off-resonances and to a stripe pattern perpendicular to the gradient in regions with low off-resonances (Figure 1C). For better visualisation of the quantitative deviations, a deblurred6 T2 map was used (Figure 1D). The stripe pattern is more visible on a homogenous gel phantom (Figure 2A). By spectral binning of the voxels, the relative deviation of T1 and T2 is plotted (Figure 2B). By scanning the qMRI phantom at different frequency offsets by detuning the scanner, a dependency of the course of the deviations on the T1 and T2 values can be observed (Figure 3).
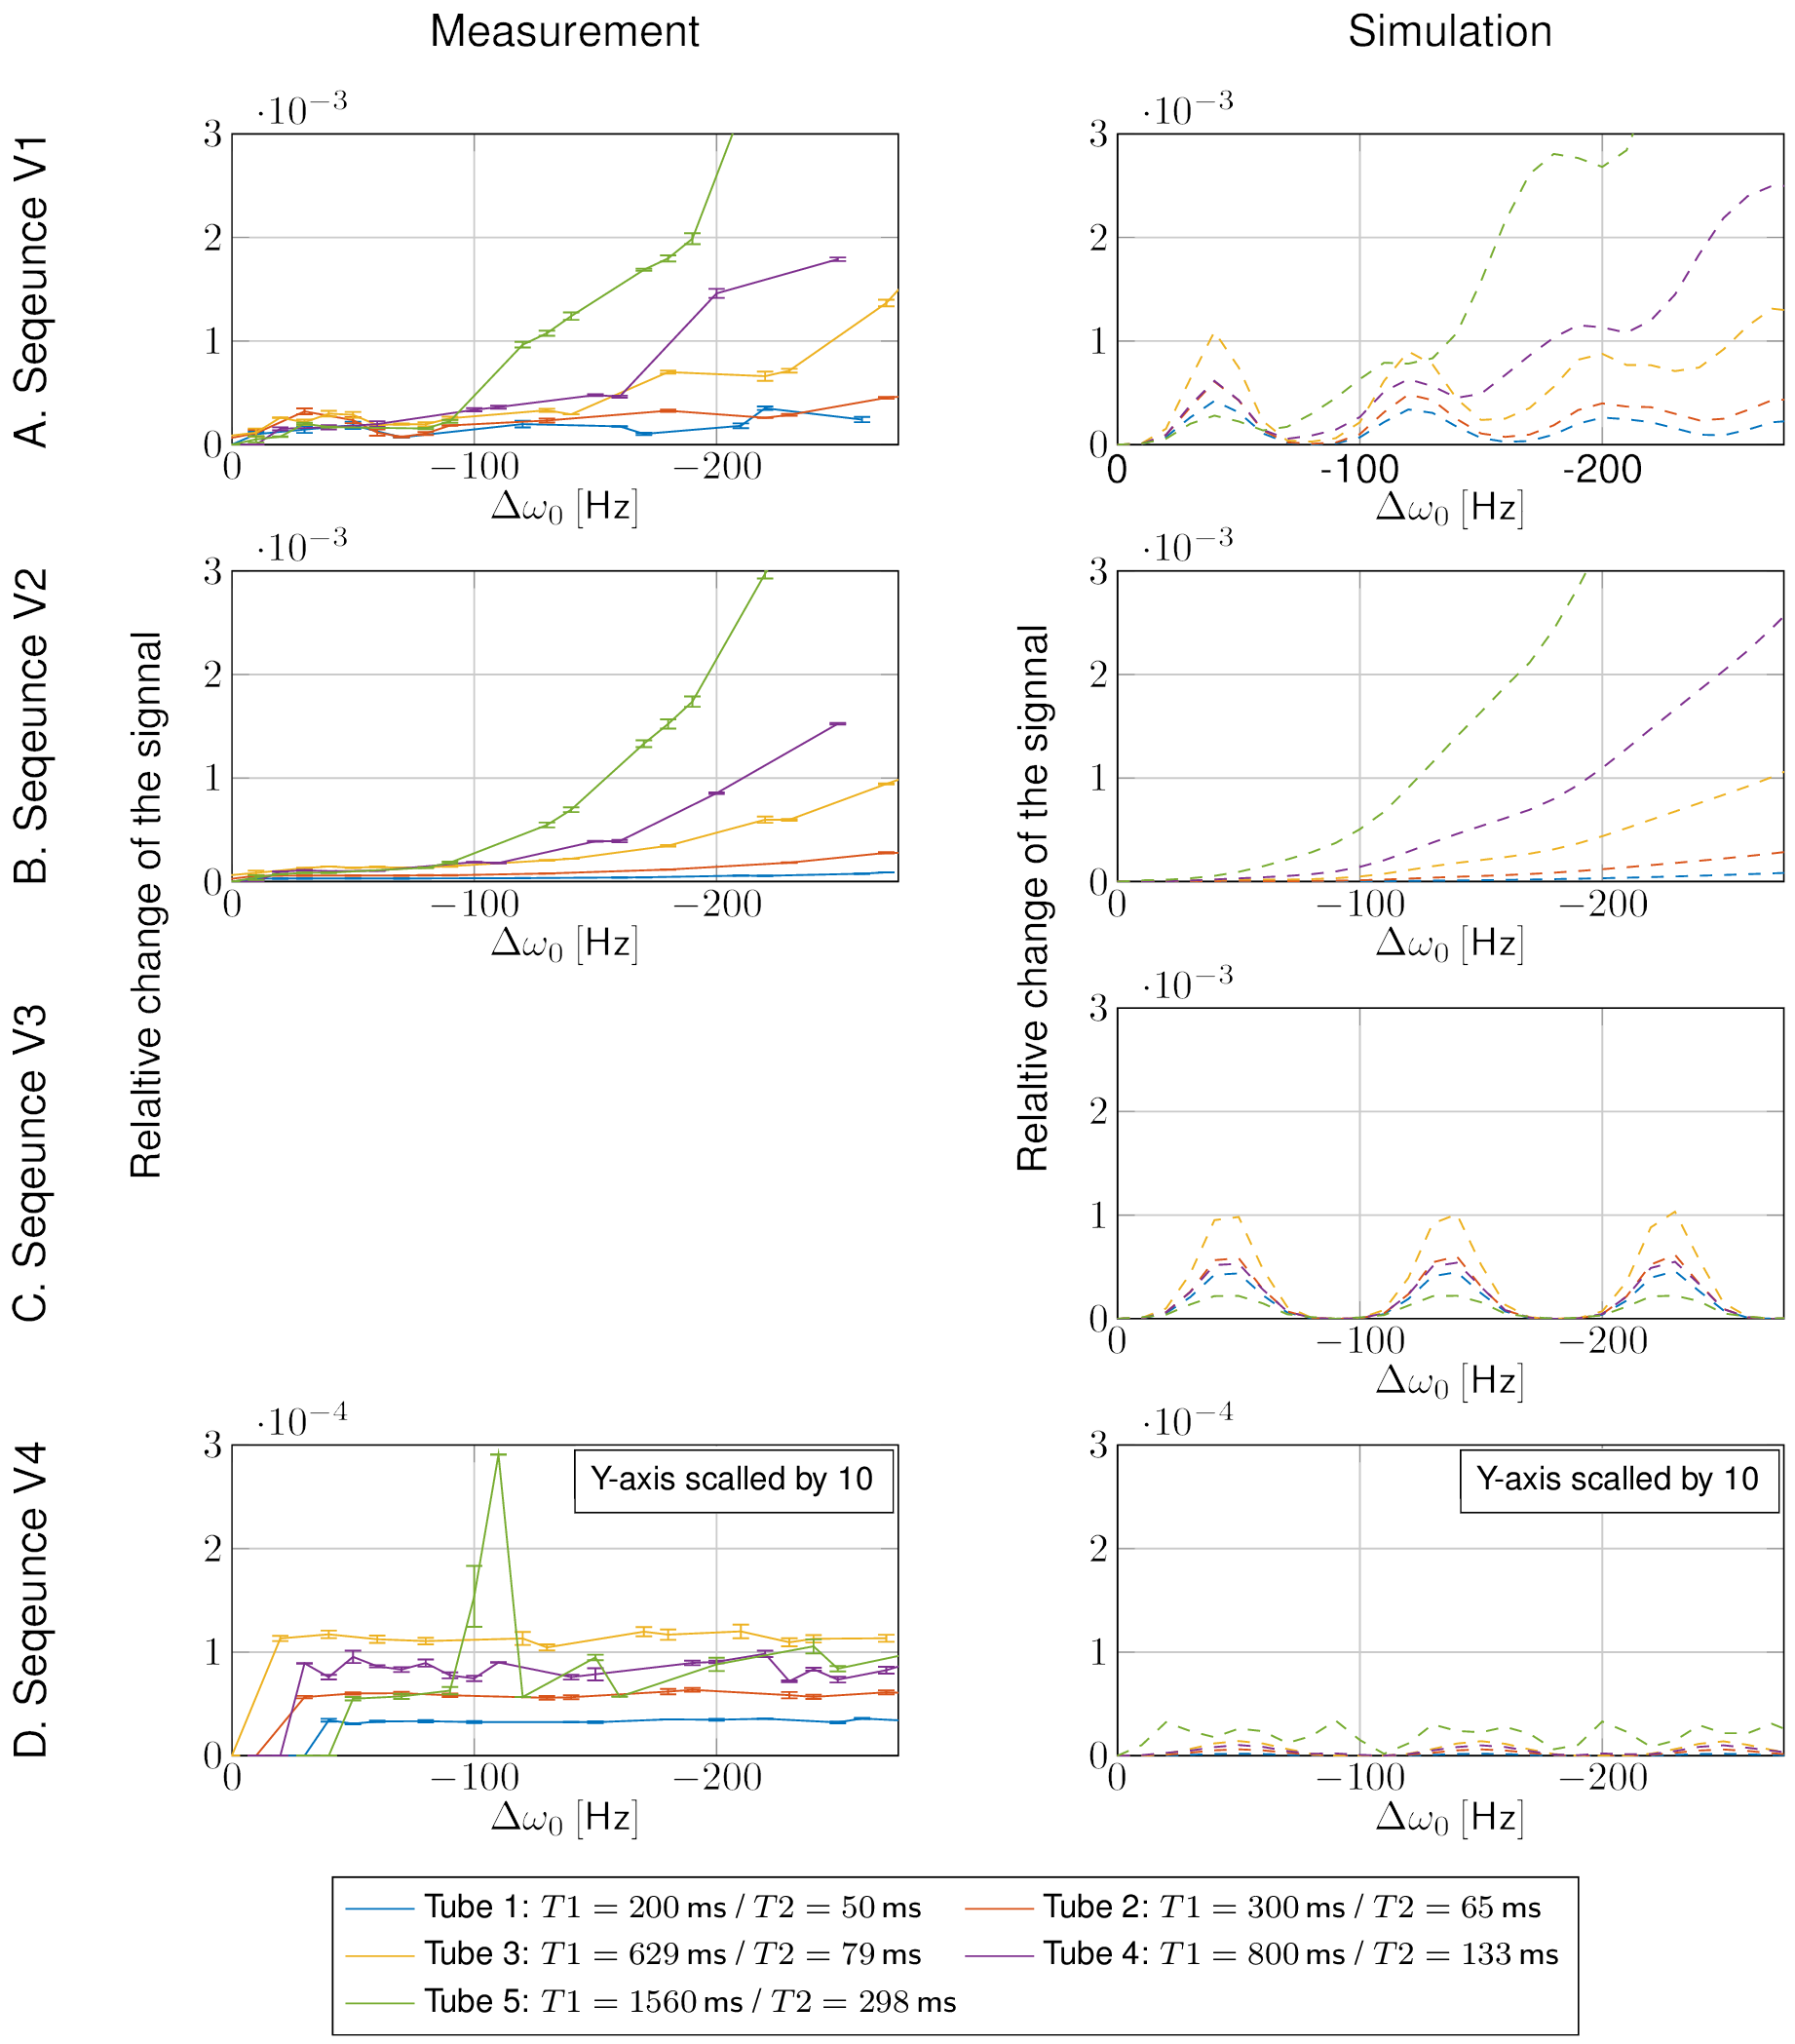
In Figure 4, the relative change of the signal evolution due to off-resonances between experiment (left) and simulation (right) for the four sequence variants are shown. For small T1 and T2 values, off-resonances cause an oscillatory deviation, and for higher T1 and T2 values, off-resonances lead to deviations proportional to off-resonances Δω2 (Figure 4A, V1). For V2, the oscillatory deviation is nearly excluded (Figure 4B), while by changing the variable TR to constant TR (V3), the deviation proportional to Δω2 is eliminated (Figure 4C). With both modifications (V4), the off-resonance sensitivity is remarkably reduced (Figure 4D).
By using V4 and additional deblurring, the influence of off-resonances in vivo can be notably reduced (Figure 5).
Disscusion
It was confirmed by both measurements and simulation that off-resonance can affect T1 and T2 results of FISP-MRF. By using constant frequency offsets instead of spatially varying fields, intra-voxel dephasing, which can also lead to temporal signal modulation7, was excluded as origin of the deviations. The 1D projection acquisition and simulation served to exclude the effects of undersampling and spiral encoding.
An oscillatory deviation with a period of approximately 80 Hz and an absolute deviation proportional to Δω2 was observed for V1. An additional dephaser before the slice-selection reduces this effect significantly, suggesting that uncomplete dephasing is a main cause of the problem. The underlying spin physics is investigated in another work8. Replacing a variable TR by a constant TR removes the Δω2 dependency.
Conclusion
Depending on the implementation of the MRF FISP sequence, off-resonance may alter resulting T1 and T2 values. Relying only on the dephasing moment of the unbalanced slice-selection gradient results in significantly increased off-resonance dependency. Likewise, by using a constant instead of variable TR, the dependency for off-resonances is reduced.Acknowledgements
B. G. gratefully thanks his master thesis supervisor Prof. T. Salditt, U of Goettingen for his support.References
1.
Ma D, Gulani V, Seiberlich N, Liu K, Sunshine
JL, Duerk JL, and Griswold MA. Magnetic
resonance fingerprinting. Nature, 495(7440):187–192,
2013.
2. Jiang Y, Ma D, Seiberlich N, Gulani V, and Griswold MA. MR fingerprinting using fast imaging
with steady state precession (FISP) with spiral readout. Magnetic Resonance in
Medicine, 74(6):1621–1631, 2014.
3. Pfeuffer J, Kechagias A, Meyer CH, Körzdörfer G, and Nittka M. Mitigation of Spiral Undersampling Artifacts in
Magnetic Resonance Fingerprinting (MRF) by Adapted Interleave Reordering.
Abstract 0133. In Proceedings of the 25th Annual Meeting of the ISMRM,
Honolulu, USA, 2017.
4.
Körzdörfer G, Feiweier T, Jiang Y, and Nittka M. B1-sensitive Encoding
for Magnetic Resonance Fingerprinting. Abstract 3191. In Proceedings of the 24th
Annual Meeting of the ISMRM, Singapore, 2016.
5.
Brian Hargreaves. Bloch simulator. http://mrsrl.stanford.edu/~brian/blochsim/. Stanford University,
Stanford, USA. 2011.
6.
Douglas C. Noll. Reconstruction techniques for magnetic resonance
imaging. PhD thesis, Stanford University, California, 2012.
7.
Flassbeck S, Schmidt S, Breithaupt M, Bachert P, Ladd ME, and Schmitter
S. On the influence of intra-voxel dephasing in FISP-MRF with variable
repetition time. Abstract
1492. In Proceedings of the 25th Annual Meeting of the ISMRM,
Honolulu, USA, 2017.
8.
Körzdörfer G et al. Description of the off-resonance dependency in slice selective FISP MRF. Abstract submitted to the 26th Annual Meeting of the
ISMRM, Paris, France, 2018.
Figures
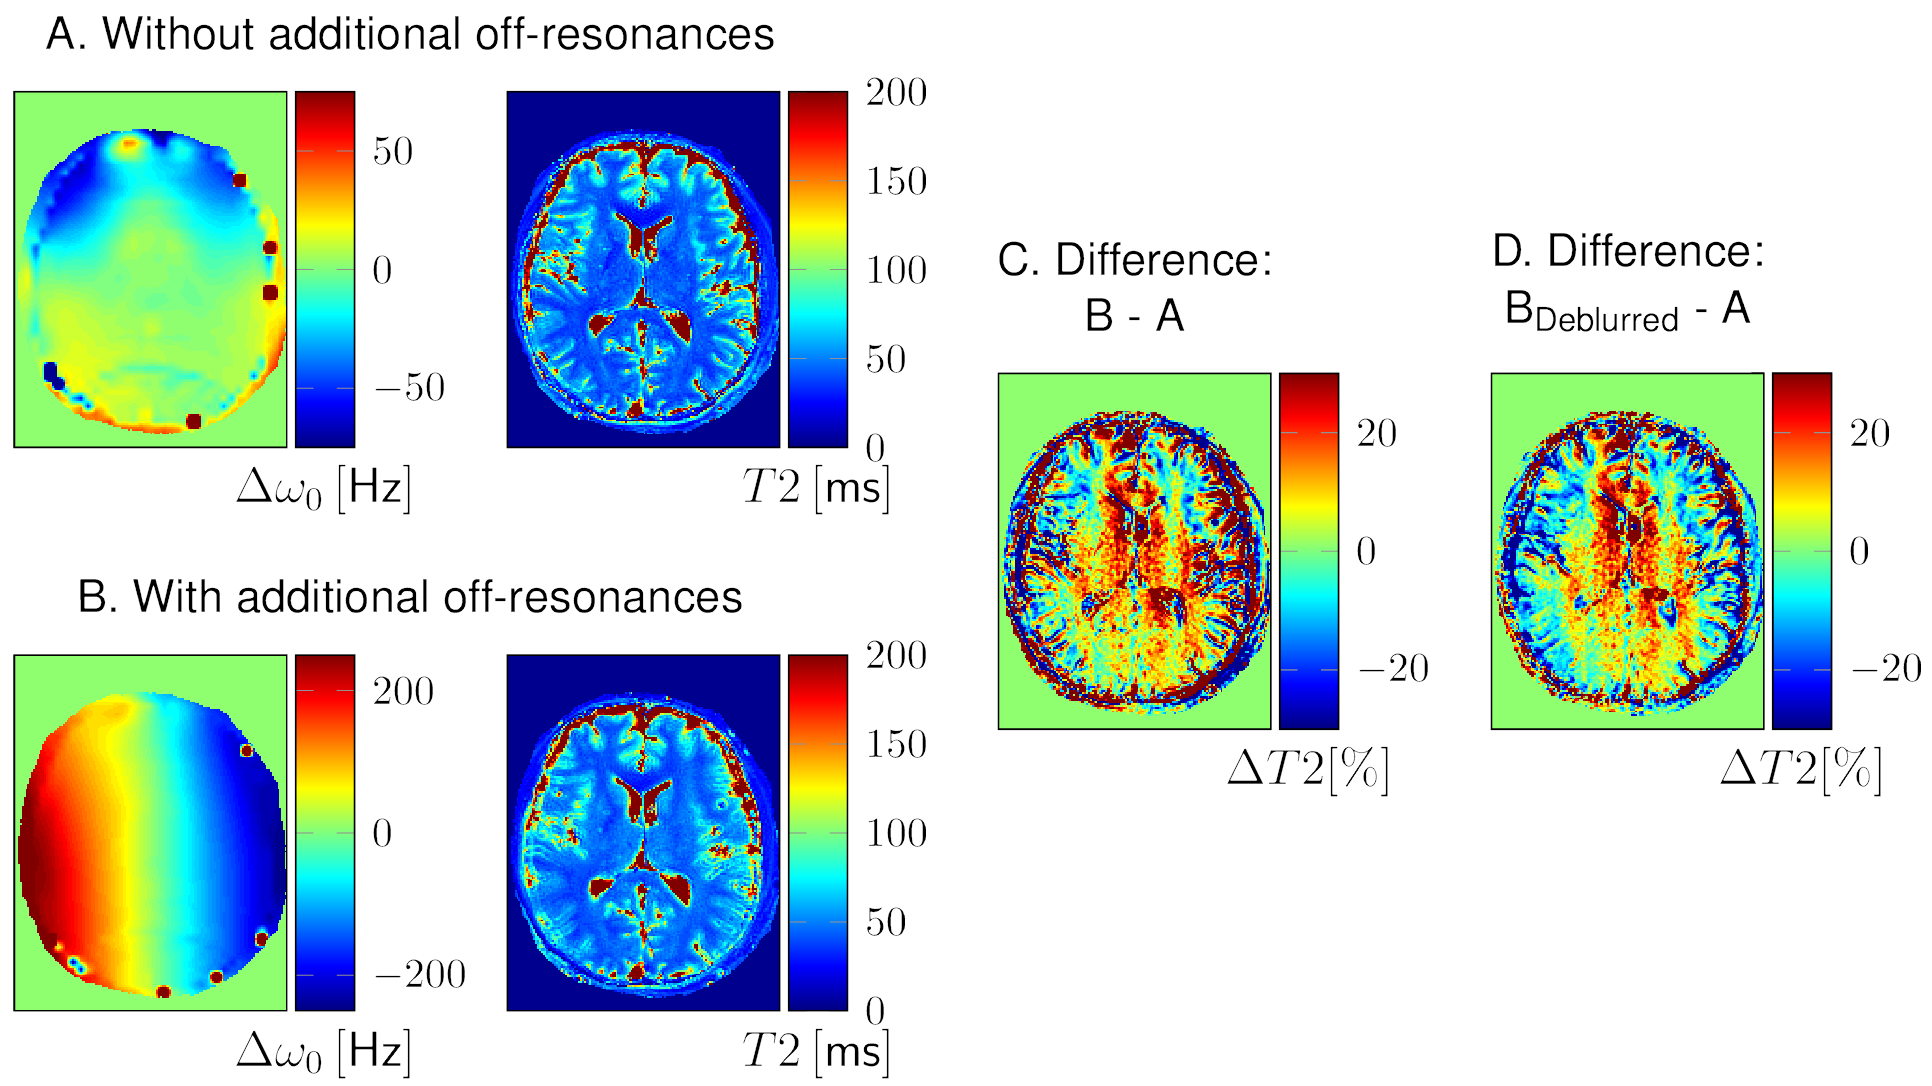
The deblurring by the frequency-segmented method was performed for a better visualisation of the quantitative deviations. The difference images C and D were smoothed by a Wiener filter in Matlab.