4262
Unbalanced Steady-State Free Precession MR Fingerprinting with Simultaneous Fat Signal Fraction, T1, T2 and B0 Estimation1Vanderbilt University Institute of Imaging Science, Vanderbilt University, Nashville, TN, United States, 2Program in Chemical and Physical Biology, Vanderbilt University, Nashville, TN, United States, 3Radiology and Radiological Sciences, Vanderbilt University, Nashville, TN, United States, 4Molecular Physiology and Biophysics, Vanderbilt University, Nashville, TN, United States, 5Biomedical Engineering, Vanderbilt University, Nashville, TN, United States
Synopsis
Unbalanced steady-state free precession MR fingerprinting (uSSFP-MRF) may be used to quantify fat signal as well as water T1 and T2, but is subject to off-resonance (B0) and blurring. We propose a variable echo time uSSFP and post-processing method that estimates fat signal fraction, water T1 and T2, and B0 within a single sequence. The method is tested in phantoms and in vivo. Preliminary results indicate the proposed method provides sharp fat fraction maps that account for chemical-shift and B0 effects that normally lead to blurring, as well as generate water-only T1 and T2 maps.
Introduction
Unbalanced steady-state free precession (uSSFP) MR fingerprinting1 (MRF) with variable echo time (TE) is sensitive to the presence of fat2–4. However, fat signal quantification is complicated by off-resonance (B0) effects and, for spiral acquisitions, blurring. In this work, we present a means to estimate fat signal and B0 simultaneously using spiral uSSFP-MRF. This fat separation technique allows the calculation of deblurred fat signal fraction maps as well as water T1 and T2 maps in the presence of heterogeneous B0.Methods
Using a modification of the method of Brodsky et al.5 combined with singular value decomposition6, the on-resonance fat-water MRF signal vector in k-space $$$\mathbf{s}_{\mathbf{o}}\left( \mathbf{k} \right)$$$ can be modeled as $$\mathbf{s}_{\mathbf{o}}\left( \mathbf{k} \right)\mathbf{= \ }\left\lbrack \mathbf{U}_{\mathbf{o}}\ \mathbf{F} \right\rbrack\mathbf{\beta}\left( \mathbf{k} \right) \qquad (1),$$ where $$$\mathbf{U}_{\mathbf{o}}$$$ is the matrix of left-singular dictionary vectors of on-resonance water signal, $$$\mathbf{F}$$$ is the fat signal model, and $$$\mathbf{\beta}$$$ is a vector of weights. The off-resonance fat-water signal, $$$\mathbf{s}\left( \mathbf{k} \right)$$$, is $$\mathbf{s}\left( \mathbf{k} \right)\mathbf{= \ }\mathbf{Uc(k)} \qquad (2),$$ where $$$\mathbf{U}$$$ is the matrix of left-singular dictionary vectors that includes T1, T2, and off-resonant/chemical shift effects and $$$\mathbf{c(k)}$$$ is the coefficient vector. If a fixed repetition time and linear ramp of TEs are used over the MRF acquisition, then when using multi-frequency interpolation (MFI),7-8 the signal corrected for off-resonance effects can be given as $$\mathbf{s}_{\mathbf{o}}\left( \mathbf{k} \right)\mathbf{\approx \ }\sum_{l\mathbf{=}1}^{L}a_{l}\mathbf{J}_{l}\mathbf{s(k)} \qquad (3);$$ $$$\left\{ \mathbf{J}_{l} \right\}$$$ are diagonal matrices that modify the phase of $$$\mathbf{s(k)}$$$ according to specific frequencies, and $$$\left\{ a_{l} \right\}$$$ are the MFI weights. A set of fat-water coefficients is obtained by fitting the phase modulated measurements $$$\left\{ \mathbf{J}_{l}\mathbf{s(k)} \right\}$$$ in Eq. (3) to Eq. (1), projecting along the columns of $$$\mathbf{U}$$$ using Eq. (2), and added to projected residuals to give total measurement coefficients $$$\left\{ \mathbf{c}_{l\mathbf{,}\text{tot}}\mathbf{(k)} \right\}$$$. By inverse Fourier transform of the coefficients, the on-resonance solution at position $$$\mathbf{r}$$$ can be expressed as $$\mathbf{s}_{\mathbf{o}}\left( \mathbf{r} \right)\mathbf{\approx \ }\sum_{l\mathbf{=}1}^{L}a_{l}\mathbf{(}\Delta B_{o})\mathbf{U}\mathbf{c}_{l\mathbf{,}\text{tot}}\mathbf{(r)} \qquad (4).$$ $$$\left\{ a_{l}\mathbf{}(\Delta B_{o}) \right\}$$$ depend on a single variable, $$$\mathbf{}\Delta B_{o}(\mathbf{r})$$$. Eq. (1) in the spatial domain also holds. Using variable projection, the residuals $$$\mathbf{\sigma}$$$ to the solution $$$\mathbf{s}_{\mathbf{o}}\left( \mathbf{r} \right)$$$ can be given as $$\mathbf{\sigma = \ }\left\lbrack \mathbf{I -}\left\lbrack \mathbf{U}_{\mathbf{o}}\ \mathbf{F} \right\rbrack\left\lbrack \mathbf{U}_{\mathbf{o}}\ \mathbf{F} \right\rbrack^{\mathbf{\dagger}} \right\rbrack\mathbf{\ }\sum_{l\mathbf{=}1}^{L}a_{l}\mathbf{}(\Delta B_{o})\mathbf{U}\mathbf{c}_{l\mathbf{,}\text{tot}}\mathbf{(r)} \qquad (5),$$ with $$$\mathbf{\dagger}$$$ designating the pseudo-inverse. By exhaustive search of discretized frequencies using pre-calculated $$$\left\{ a_{l}\mathbf{}(\Delta B_{o}) \right\}$$$, the off-resonance frequency that minimizes error can be found for each position, giving an estimated $$$\mathbf{}\Delta B_{o}$$$ and on-resonance fat and water coefficients. The water signals can then be reconstructed and fitted to a water dictionary to estimate T1 and T2.
Measurements were performed using 3 T Philips Achieva and Ingenia scanners (Philips Healthcare, The Netherlands) with either a transmit-receive head coil or multi-channel anterior and integrated posterior coils. The MRF sequence used the flip angle pattern reported by Jiang et al.,1 a fixed TR of 18 ms, and a linearly ramped TE from 3.25 to 7.25 ms. Variable density spirals with an acquisition time of 7 ms and independently measured k-space trajectories9 with gridded reconstruction were used for spatial encoding and reconstruction. Fitting for FSF and B0 with the proposed method used 31 off-resonance MFI basis frequencies and the SVD basis rank preserved 99.99% of the dictionary energy. The fat model consisted of six peaks with previously reported T1 and T2 values for adipose tissue.10 Reference fat fraction measurements used multi-echo spoiled gradient echo scans and post-processing by a graph cut algorithm11 or scanner software. Phantom experiments consisted of seven 50 mL tubes of varying fat fraction subject to off-resonance conditions and a water-only MRI system phantom12 subject to off-resonances. One subject’s liver was scanned after providing written informed consent.
Results
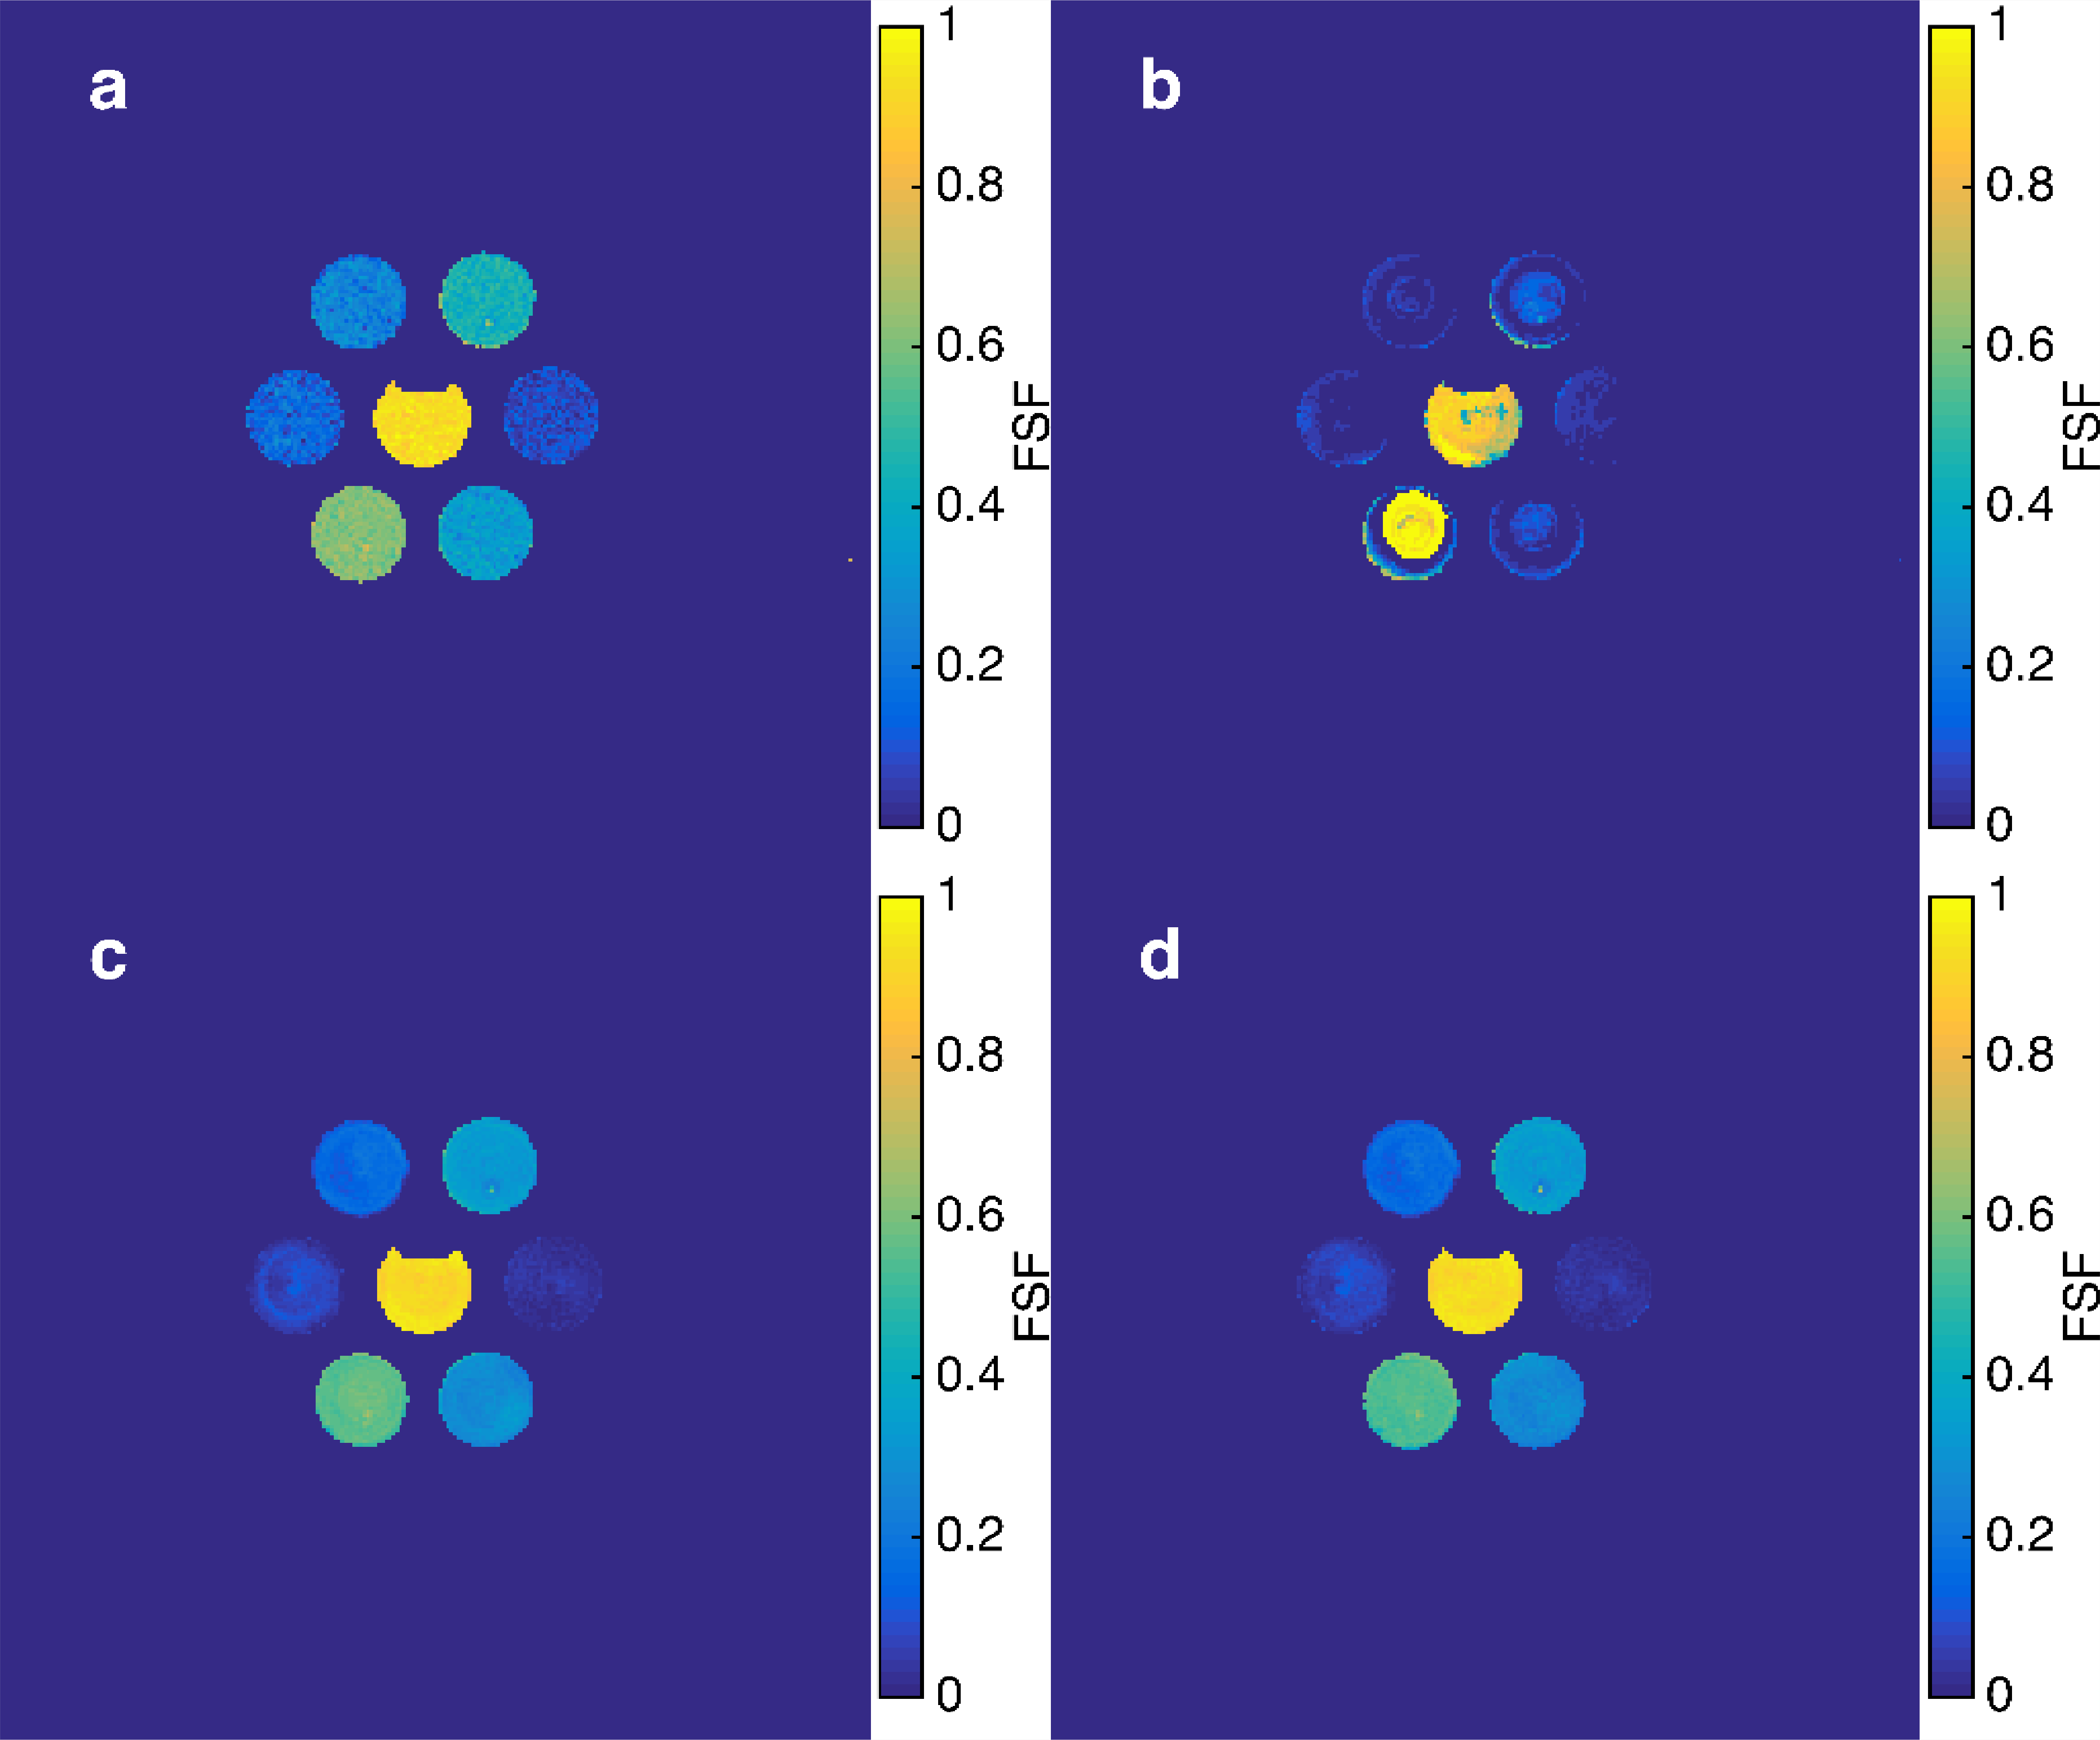
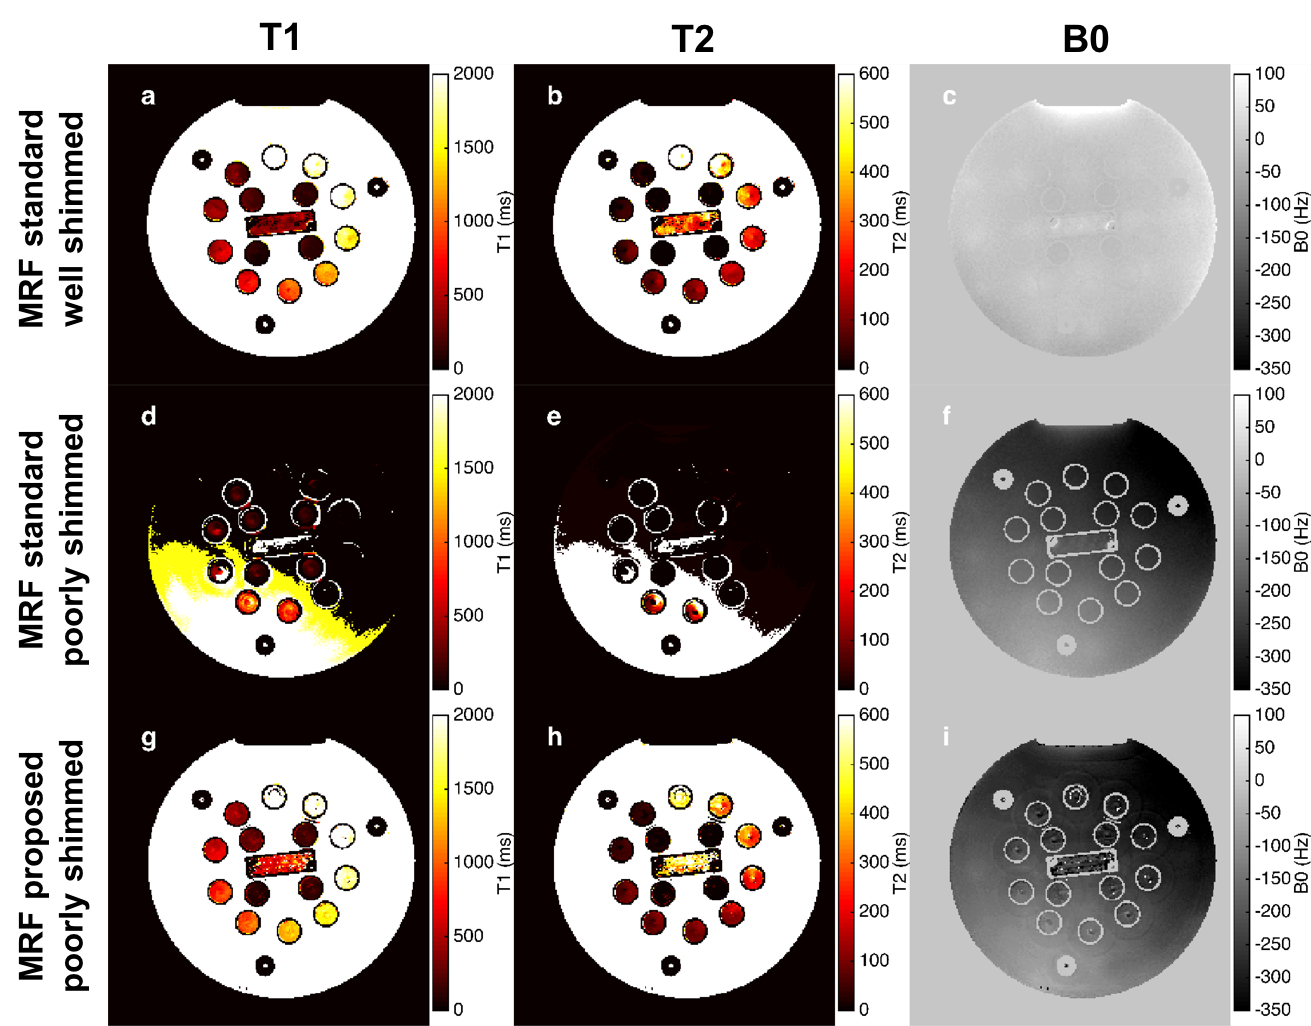
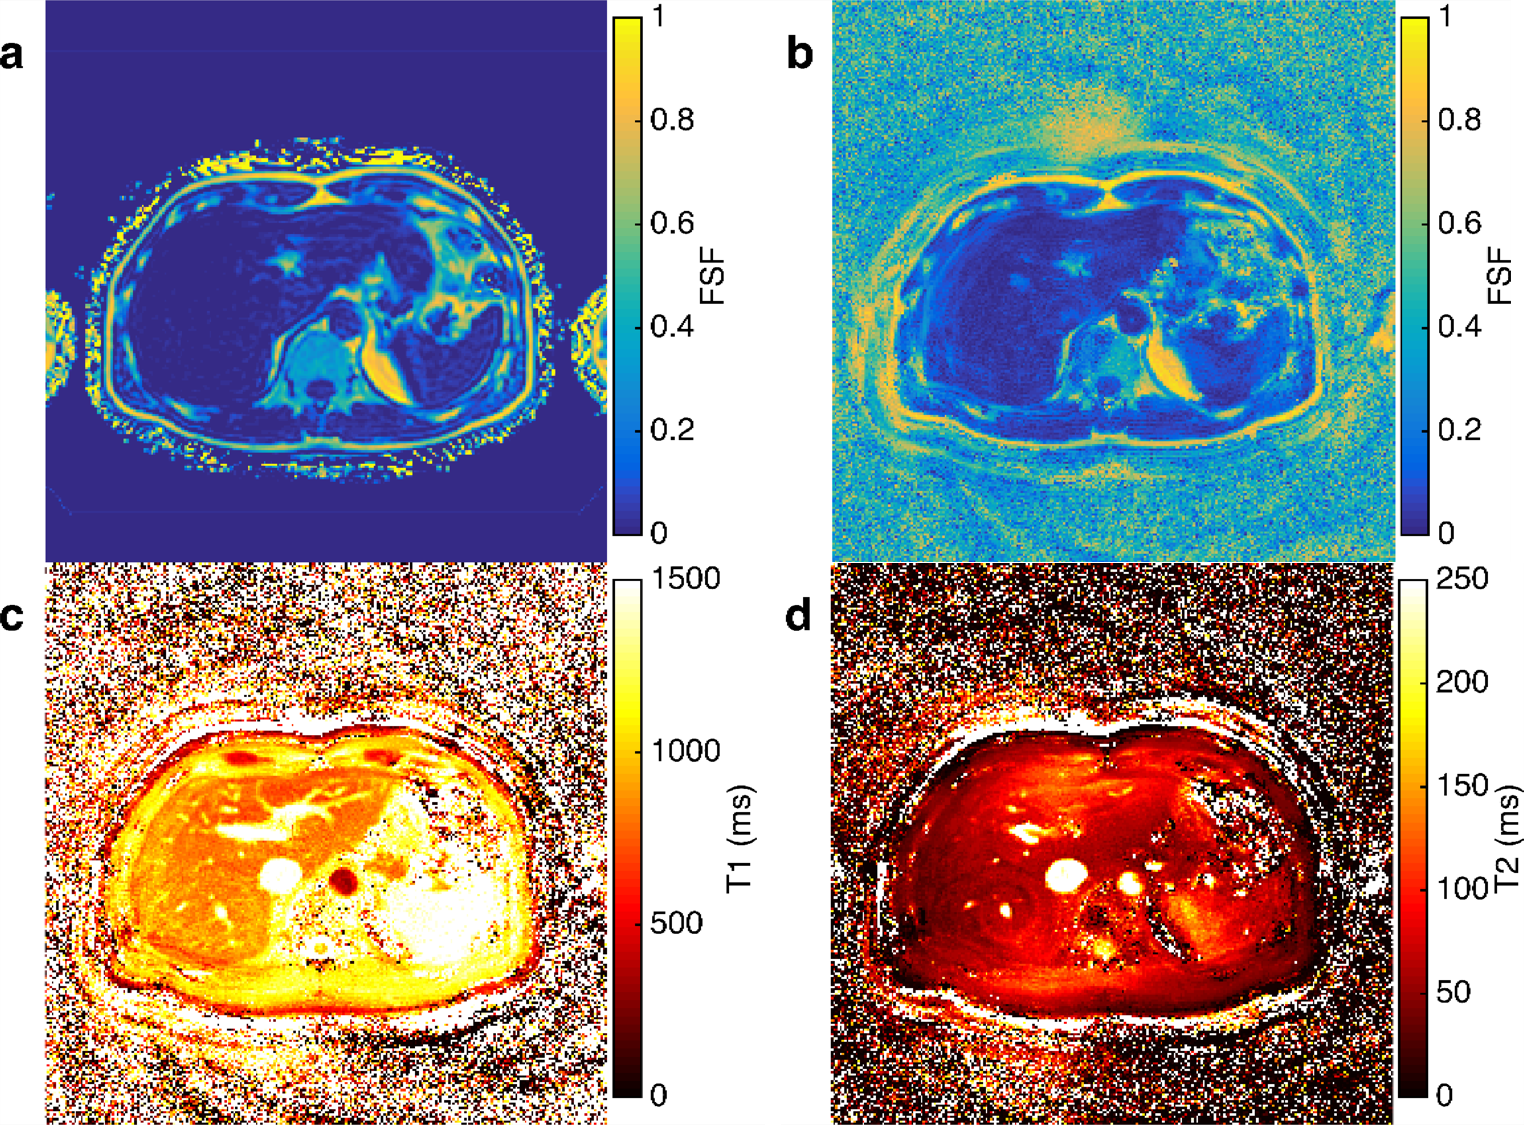
Figure 1 compares a Cartesian reference fat signal fraction (FSF) map under well shimmed conditions with MRF FSF derived from direct dictionary match, MRF FSF fitting in k-space without B0 correction, and MRF fitting with B0 correction. With spiral acquisition, significant blurring in the image domain occurs due to chemical shift. Blurring is reduced by fitting fat in k-space. Figure 2 shows off-resonance effects on a water only phantom and the deblurring achieved with the proposed method. Figure 3 presents the simultaneous multi-parametric estimation of FSF, T1 and T2 using the proposed method.Discussion and Conclusion
The proposed method substantially reduces blurring due to chemical shift and off-resonance effects using spiral uSSFP and simultaneously separates fat and water while fitting for B0. The B0 blurring correction accuracy is limited by known limits on conjugate phase correction, but the improvements in blurring indicated in Figure 2 are substantive. Further work will assess the accuracy of the resulting fat signal quantitation and water T1 and T2 estimates.Acknowledgements
This work was funded by NIH grants T32 EB014841 and R01 DK105371.References
1. Jiang Y, Ma D, Seiberlich N, Gulani V, Griswold MA. MR fingerprinting using fast imaging with steady state precession (FISP) with spiral readout. Magnetic Resonance in Medicine. 2015;74(6):1621–1631.
2. Han D, Kim M-O, Lee H, Hong T, Kim D-H. A Free-breathing water/fat separation and T1, T2 quantification method using dual TR FISP in abdomen. In: Proc Intl Soc Mag Reson Med. 2016. p. 575.
3. Ostenson J, Welch EB. Fat Signal Fraction Determination Using MR Fingerprinting. Proc Intl Soc Mag Reson Med. 2017:134.
4. Cencici M, Biagi L, Kaggie J, Schulte RF, Rosetti MT, Buonincontri G. MR Fingerprinting in the knee with dictionary-based fat and water separation. In: ISMRM Workshop on MRF. 2017.
5. Brodsky EK, Holmes JH, Yu H, Reeder SB. Generalized k-space decomposition with chemical shift correction for non-Cartesian water-fat imaging. Magnetic Resonance in Medicine. 2008;59(5):1151–64.
6. McGivney DF, Pierre E, Ma D, Jiang Y, Saybasili H, Gulani V, Griswold MA. SVD compression for magnetic resonance fingerprinting in the time domain. IEEE Transactions on Medical Imaging. 2014;33(12):2311–2322.
7. Man LC, Pauly JM, Macovski A. Multifrequency interpolation for fast off-resonance correction. Magnetic resonance in medicine. 1997;37(5):785–92.
8. Ostenson J, Robison RK, Zwart NR, Brian Welch E. Multi-frequency interpolation in spiral magnetic resonance fingerprinting for correction of off-resonance blurring. Magnetic Resonance Imaging. 2017:1–10.
9. Welch EB, Robison RK, Harkins KD. Robust k-space trajectory mapping with data readout concatenation and automated phase unwrapping reference point identi cation. In: Proc Intl Soc Mag Reson Med. 2017. p. 1387.
10. Hamilton G, Smith DL, Bydder M, Nayak KS, Hu HH. MR properties of brown and white adipose tissues. Journal of Magnetic Resonance Imaging. 2011 [accessed 2011 Jul 20];34(2):468–473. http://doi.wiley.com/10.1002/jmri.22623
11. Hernando D, Kellman P, Haldar JP, Liang ZP. Robust water/fat separation in the presence of large field inhomogeneities using a graph cut algorithm. Magnetic Resonance in Medicine. 2010;63(1):79–90.
12. Keenan KE, Stupic KF, Boss MA, Russek SE, Chenevert TL, Prasad P V, Reddick WE, Cecil KM, Zheng J, Hu P, et al. Multi-site, multi-vendor comparison of T1 measurement using ISMRM/NIST system phantom. In: Proc Intl Soc Mag Reson Med. 2016. p. 3290.
Figures