4259
DICTIONARY-FREE MR FINGERPRINTING PARAMETER ESTIMATION VIA INVERSE REGRESSION1Grenoble Institut des Neurosciences, La Tronche, France, 2Inria, Montbonnot, France
Synopsis
MR Fingerprint requires an exhaustive search in a dictionary, which even for moderately sized problems, becomes costly and possibly intractable. In this work, we propose an alternative approach: instead of an exhaustive search for every signal, we use the dictionary to learn the functional relationship between signals and parameters. This allows the direct estimation of parameters without the need of searching through the dictionary. The comparison between a standard grid search and the proposed approach suggest that MR Fingerprinting could benefit from a regression approach to limit dictionary size and fasten computation time.
INTRODUCTION
Magnetic resonance imaging (MRI) can map a wide range of tissue properties but is often limited to observe a single parameter at a time. In order to overcome this problem, Ma et al.1 introduced magnetic resonance fingerprinting (MRF), a procedure based on a dictionary of simulated couples (Yn,Xn) of signals and parameters. Acquired signals called fingerprints are then matched to the closest signal in the dictionary in order to estimate parameters. This requires an exhaustive search in the dictionary, which even for moderately sized problems, becomes costly and possibly intractable2.
We propose an alternative approach to estimate more parameters at a time. Instead of an exhaustive search for every signal, we use the dictionary to learn the functional relationship between signals and parameters.
METHODS
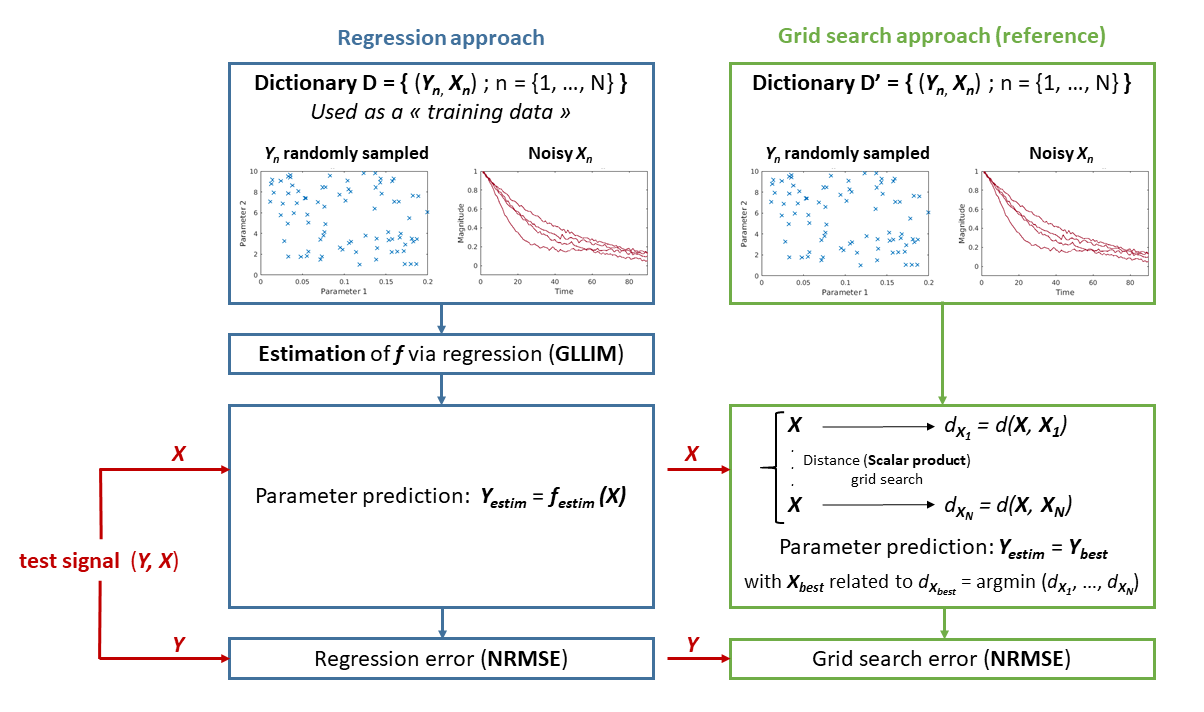
The dictionary is built using a biophysical model, g that allows to simulate a signal X from parameters Y, possibly corrupted by noise. To derive parameters Y from acquired signal X avoiding dictionary search, we propose to estimate the inverse function f=g-1, denoted by festim. The parameters are then computed using Yestim=festim(X). To achieve this, the dictionary is seen as a training dataset for a regression procedure. While the problem of regression has been extensively studied, the case where the input variable (X) dimension is far greater than that of the response (Y) remains a challenge. We propose to apply the GLLiM regression3 that bypasses the problems associated with high-to-low regression.
The experimental validation of our method is performed in the context of vascular fingerprinting4 and using the simulation tool developed by Pannetier et al.5 In this study, every brain voxel is characterized by two parameters: the blood volume fraction (BVf; [1, 25]%) and the mean vessel radius (R; [1, 10]μm). We generated dictionaries of 91 time-point signals, which represent the responses of brain tissue voxels simulated by a gradient-echo sampling of free induction decay and echo sequence6.
We compared our regression approach to the reference method1. We computed dictionaries of different sizes from 512 to 65536 randomly sampled. For each dictionary size, a function was learnt for the regression approach. Then 5000 additional independent test signals, with signal-to-noise (SNR) between 20 and infinity, were used to compute the normalized root mean squared error (NRMSE) between the true and estimated parameters. The whole procedure was repeated 60 times to compute an average NRMSE (figure 1).
RESULTS
Regarding computation time, both methods require a pre and post acquisition computations. In addition to the dictionary, our approach needs an additional step to estimate the function f (35s for a 23168-signals dictionary). The post-acquisition computation time of our approach does not depend on the dictionary size and is highly time efficient (21ms). However, the real-time grid search computation requires as many scalar product computations as signals in the dictionary (132ms for a 5824-signals dictionary and 505ms for a 23168-signals dictionary; time values were averaged on 10 computations of 10000 parameter estimations).
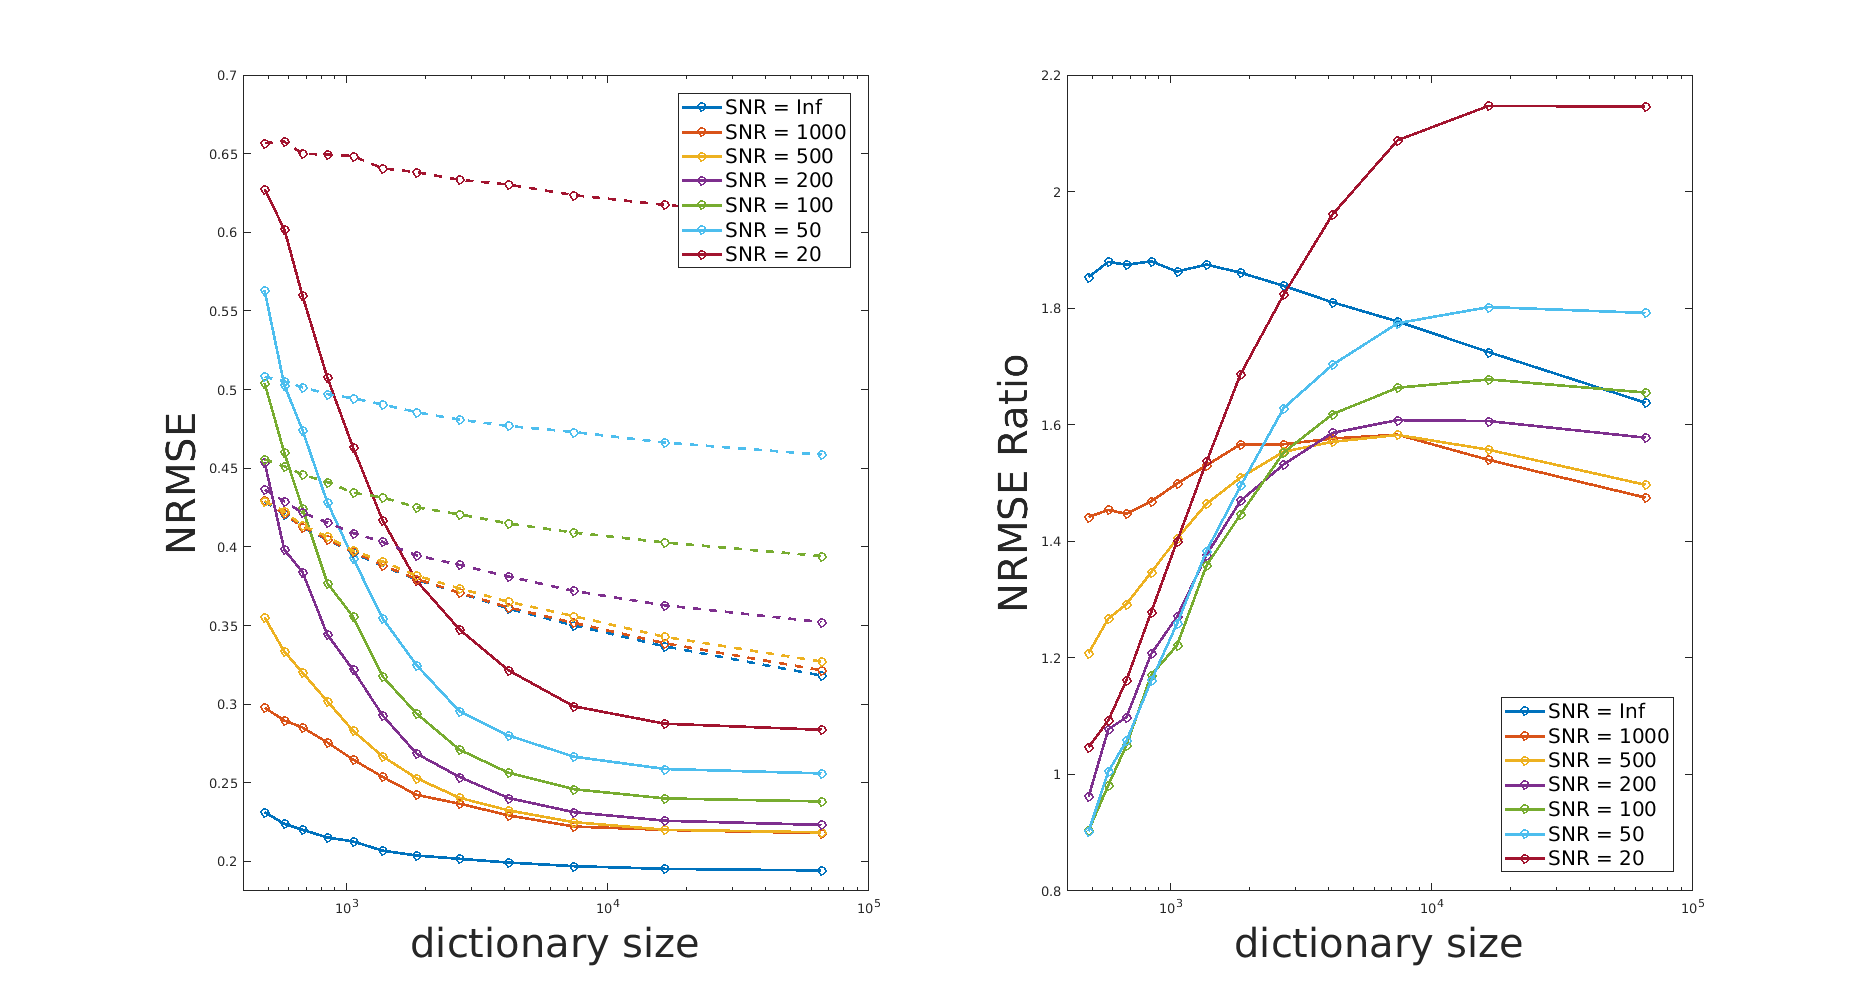
In figure 2, we present the average NRMSE as a function of the dictionary size for different SNR. As expected, NRMSE decreases when the dictionary size or the SNR increases. Regarding the impact of the dictionary size on the prediction quality, we observe that similar (often better) results can be obtained with the regression approach using much smaller dictionaries. For instance in the SNR=500 case (orange curves), to reach a NRMSE of 0.35, the reference method needs a dictionary of 65536 signals while the same NRMSE is already reached with the regression approach using a dictionary of size 512 for the grid search. This is futher visible on the second graph, which represents the ratio of NRMSE obtained with the two methods. NRMSE ratio in figure 2 tend to converge towards values within the interval [1.4, 2.2] for SNR between infinity and 20. Note the ability of the regression approach to obtain a low error for very small dictionary sizes when SNR is high.
DISCUSSION
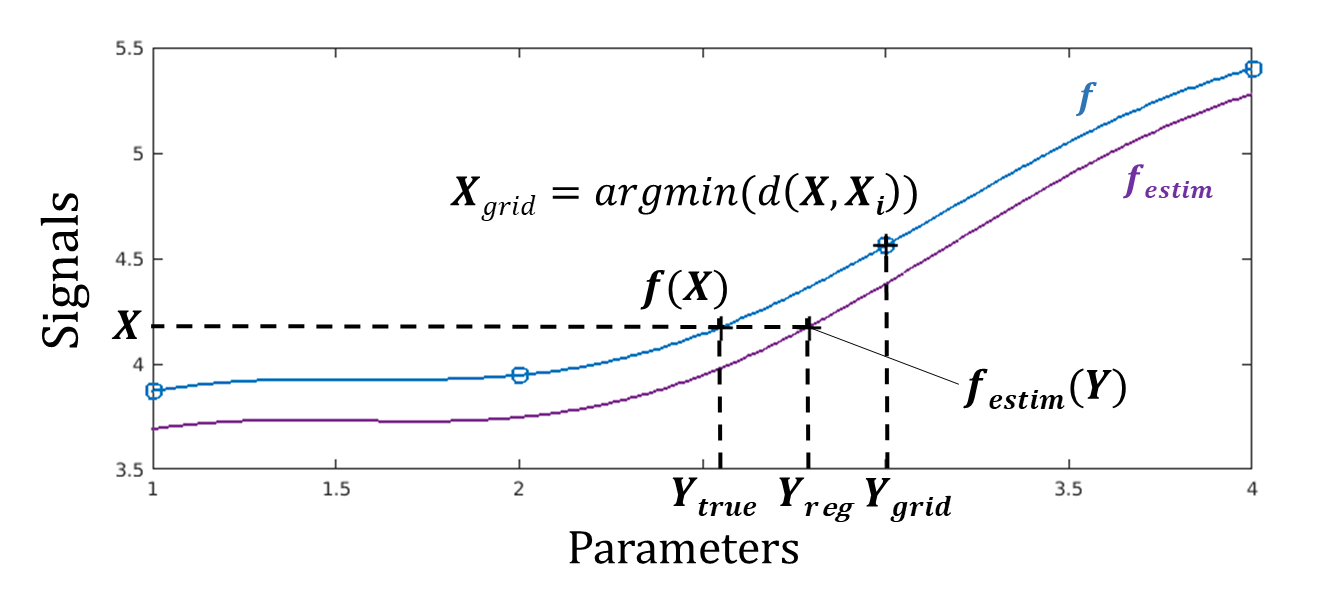
The regression approach outperforms the grid seach appraoch, whose accuracy is limited by the grid step, as it cannot predict a value in a hole of the grid (figure 3). The main interest of our method is to overcome this problem by learning the inverse function from the dictionary.CONCLUSION
These preliminary results suggest that MR fingerprinting could benefit from a regression approach to limit dictionary size and fasten computation time. This opens a possibility to introduce more parameters in the dictionary and benefit from multiparametric informations, a key to obtain fine diagnostics. Further evaluations are required with signals and dictionaries of higher dimensions.Acknowledgements
No acknowledgement found.References
1. Ma, D., Gulani, V., Seiberlich, N., Liu, K., Sunshine, J. L., Duerk, J. L., and Griswold, M. A. (2013). Magnetic resonance fingerprinting. Nature, 495(7440), 187-192.
2. Nataraj, G., Nielsen, J. F., and Fessler, J. A. (2017, April). Dictionary-free MRI parameter estimation via kernel ridge regression. In Biomedical Imaging (ISBI 2017), 2017 IEEE 14th International Symposium on (pp. 5-9). IEEE.. In : Biomedical Imaging (ISBI 2017), 2017 IEEE 14th International Symposium on. IEEE, 2017. p. 5-9.
3. Deleforge, A., Forbes, F., and Horaud, R. (2015). High-dimensional regression with gaussian mixtures and partially-latent response variables. Statistics and Computing, 25(5), 893-911.
4. Christen T, Pannetier NA, Ni WW, Qiu D, Moseley ME, Schuff N, Zaharchuk G. MR vascular fingerprinting: A new approach to compute cerebral blood volume, mean vessel radius, and oxygenation maps in the human brain. Neuroimage. 2014;89:262-70
5. Pannetier, N. A., Debacker, C. S., Mauconduit, F., Christen, T., and Barbier, E. L. (2013). A simulation tool for dynamic contrast enhanced MRI. PloS one, 8(3), e57636.. PloS one, 2013, vol. 8, no 3, p. e57636.
6. Ma, J., and Wehrli, F. W. (1996). Method for image-based measurement of the reversible and irreversible contribution to the transverse-relaxation rate. Journal of Magnetic Resonance, Series B, 111(1), 61-69.
Figures