4256
Magnetic Resonance Fingerprinting (MRF) Can Reveal Microstructural Variations in the Brain Gray Matter1Centre for Advanced Imaging, The University of Queensland, ST LUCIA, Australia
Synopsis
The importance of creating accurate anatomical maps of the human brain has motivated the development of in vivo, observer-independent and reproducible mapping methods that account for inter-individual variation. However, a) whole brain coverage and b) a multi-modal approach that accounts for the combined effects of all microscale tissue properties has yet to be developed. To bridge this gap, we propose a statistical feature-based residual analysis framework that makes use of unique tissue-specific MRF signals after taking account of T1 and T2* effects. In four cortical areas of six participants, this approach showed consistent similarity measurements between regions, indicating that MRF signals contain information about micro-level tissue properties.
INTRODUCTION
Accurate delineation of regions in the cerebral cortex in individuals has an important role in neurosurgical treatment planning and precise characterisation of regional microstructure may also be of use in the detection of pathologies such as focal cortical dysplasia.1 In the past century, cortical parcellation has relied on techniques ranging from histology2,3 to in-vivo MRI.4,5 However, precise multi-modal whole-brain microanatomical mapping that takes into account multiple micro-level brain tissue properties such as cytoarchitectonic, myeloarchitectonic, receptor architectonic and diffusion features is yet to be achieved.METHODS
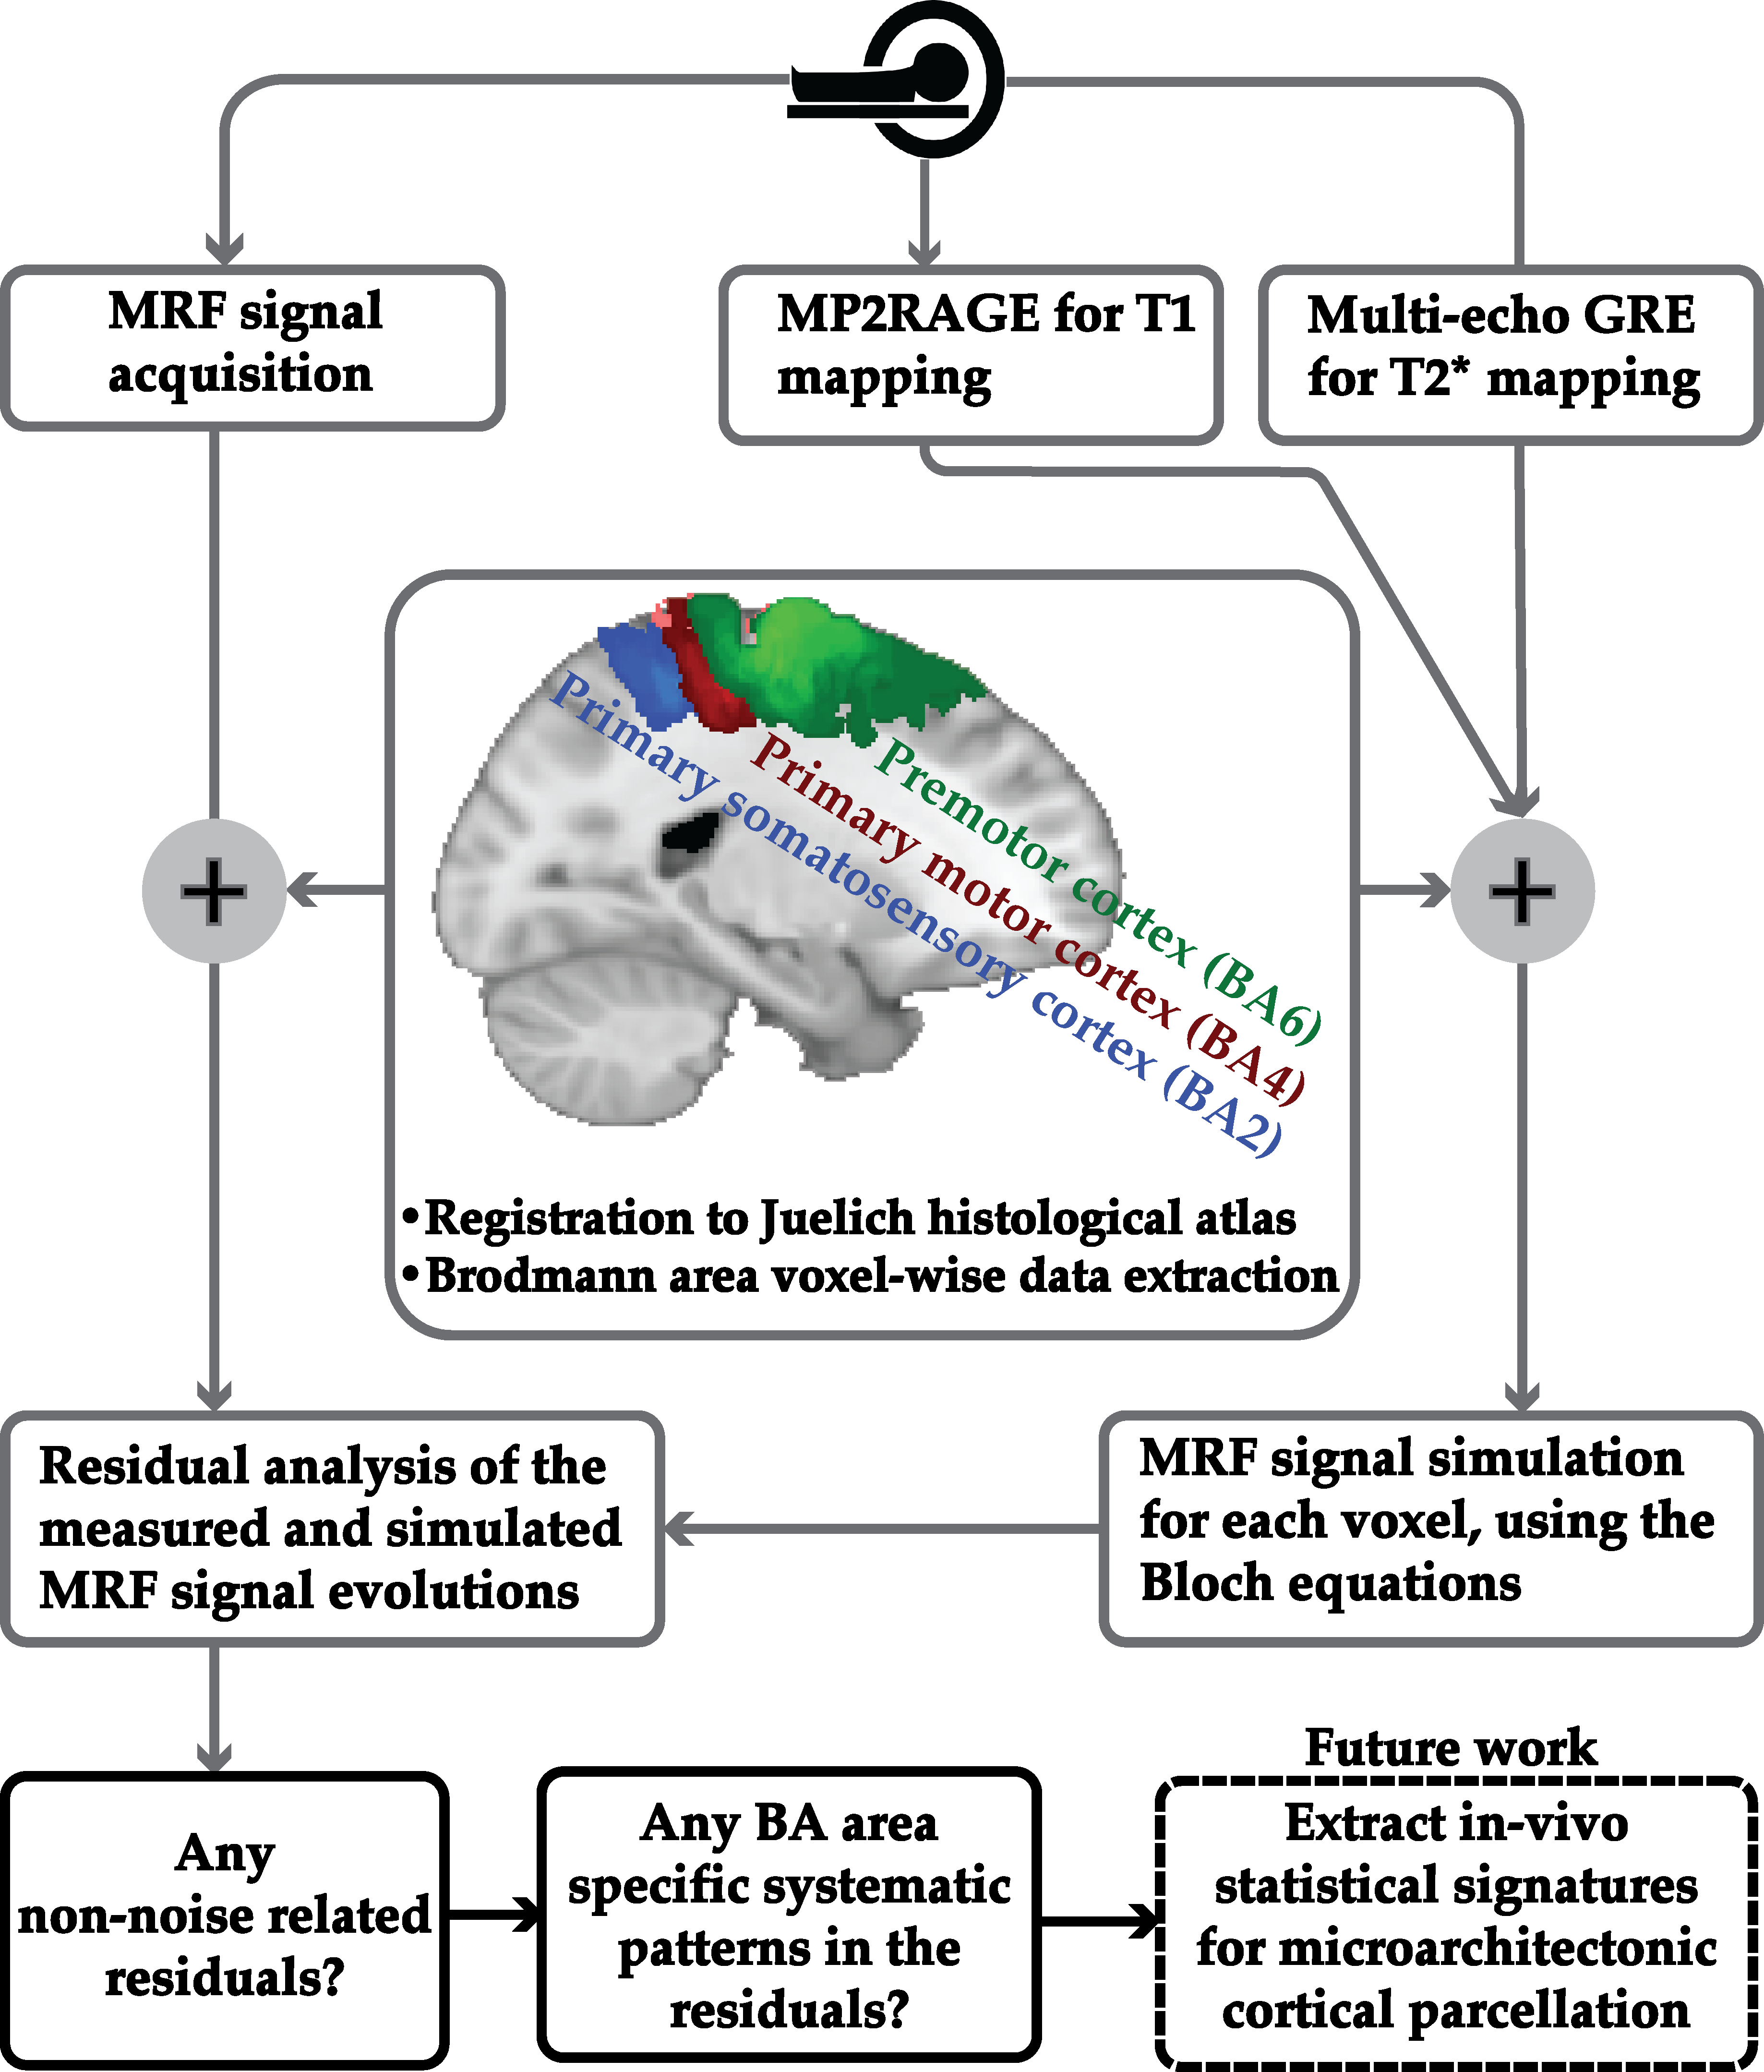
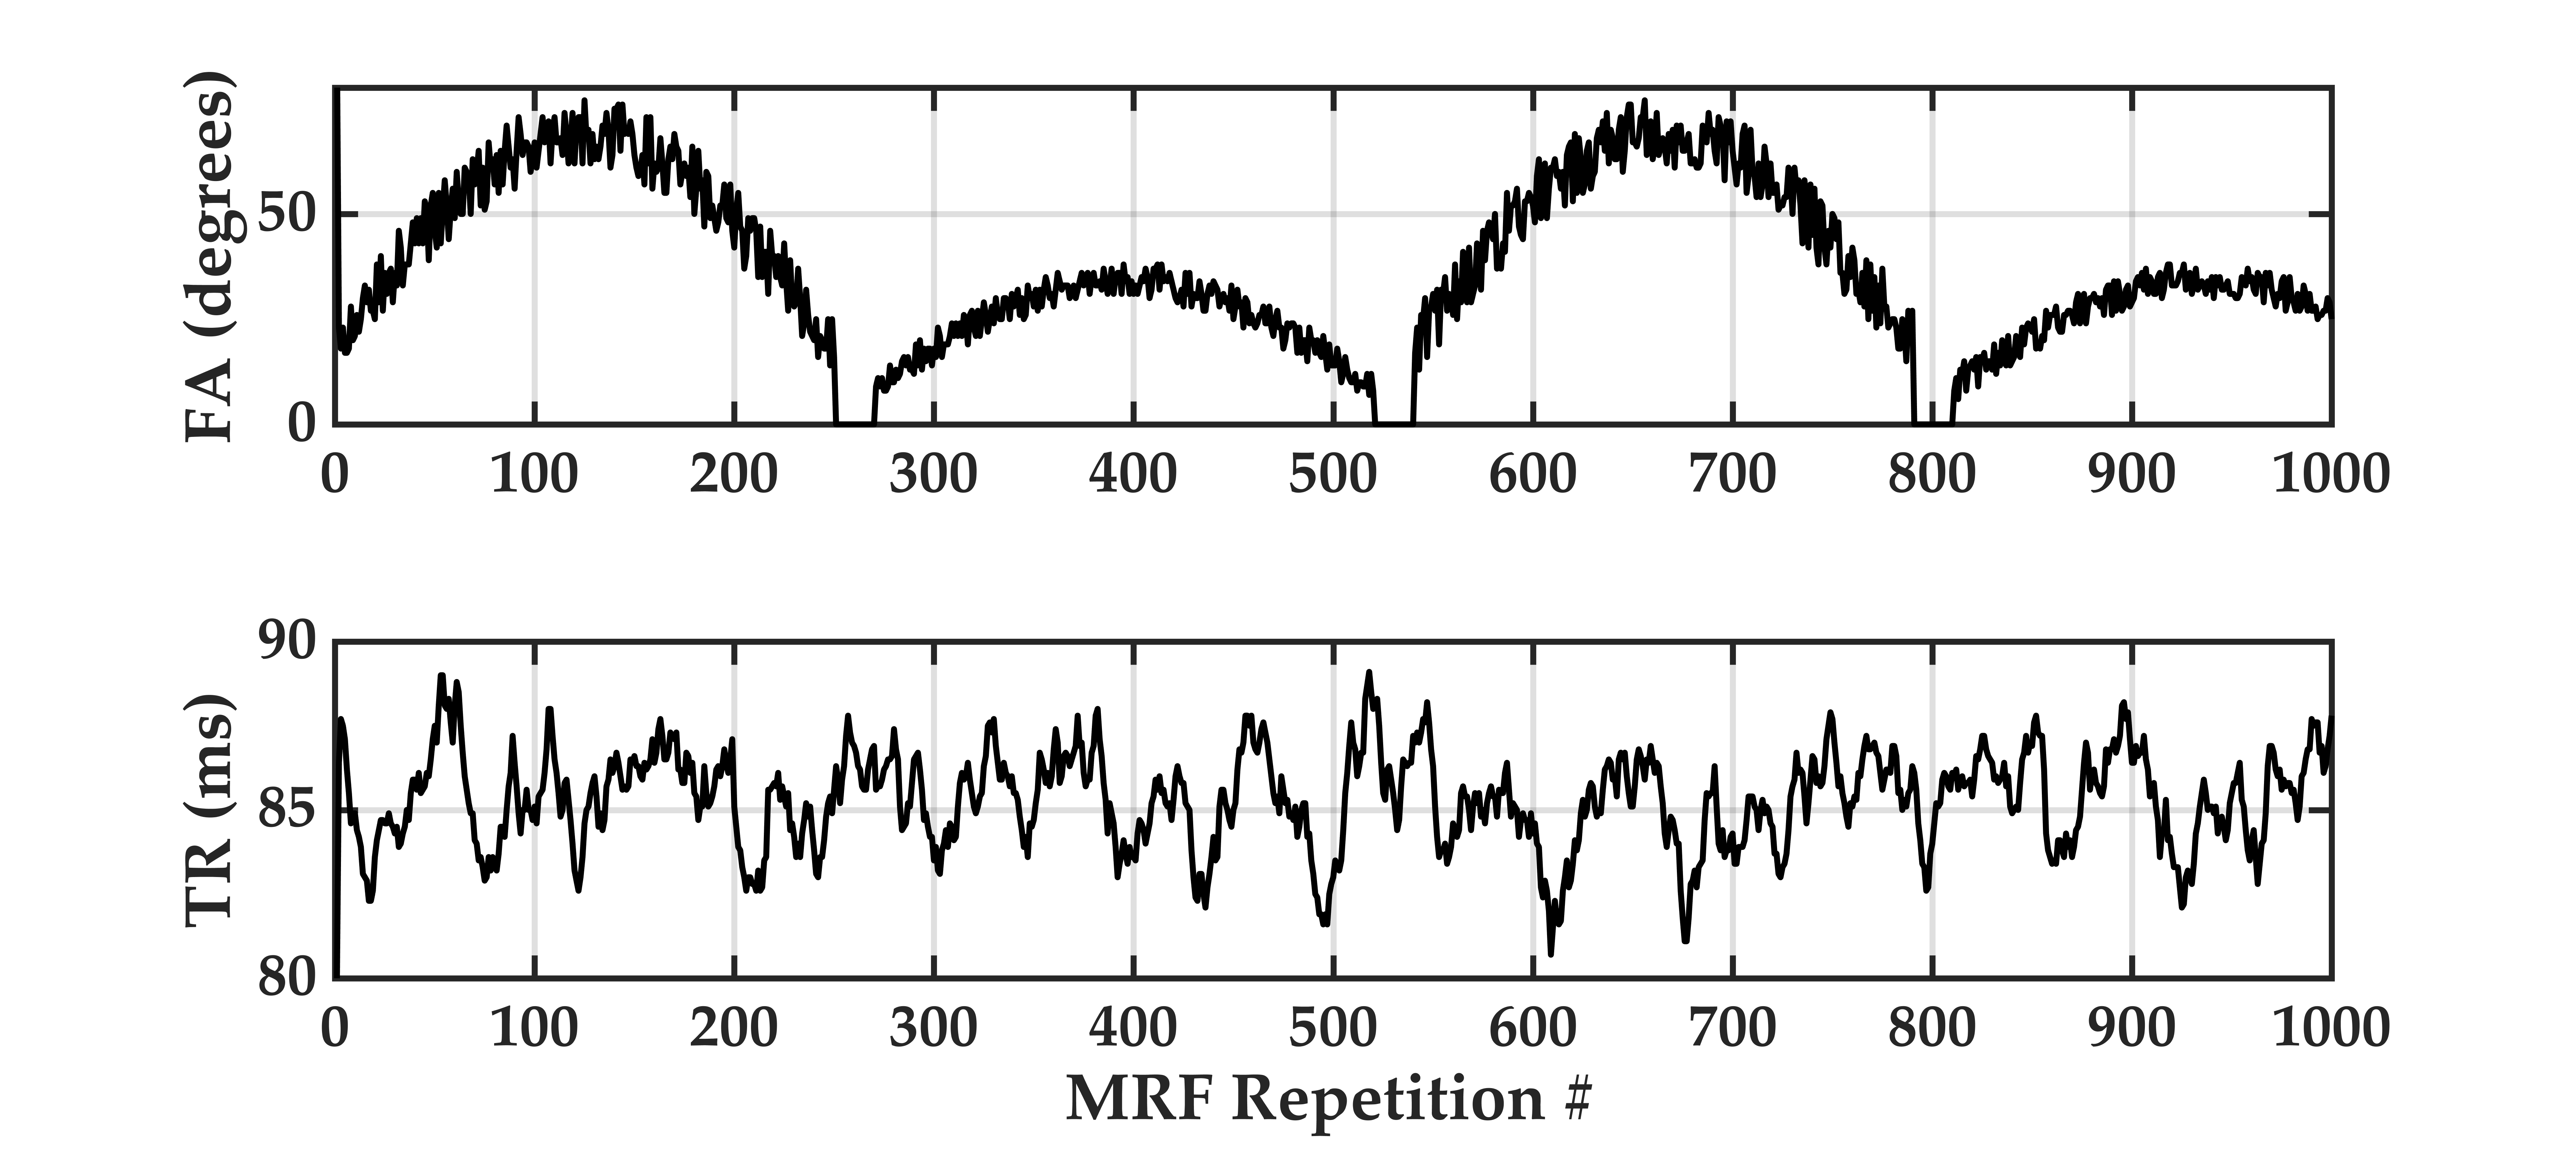
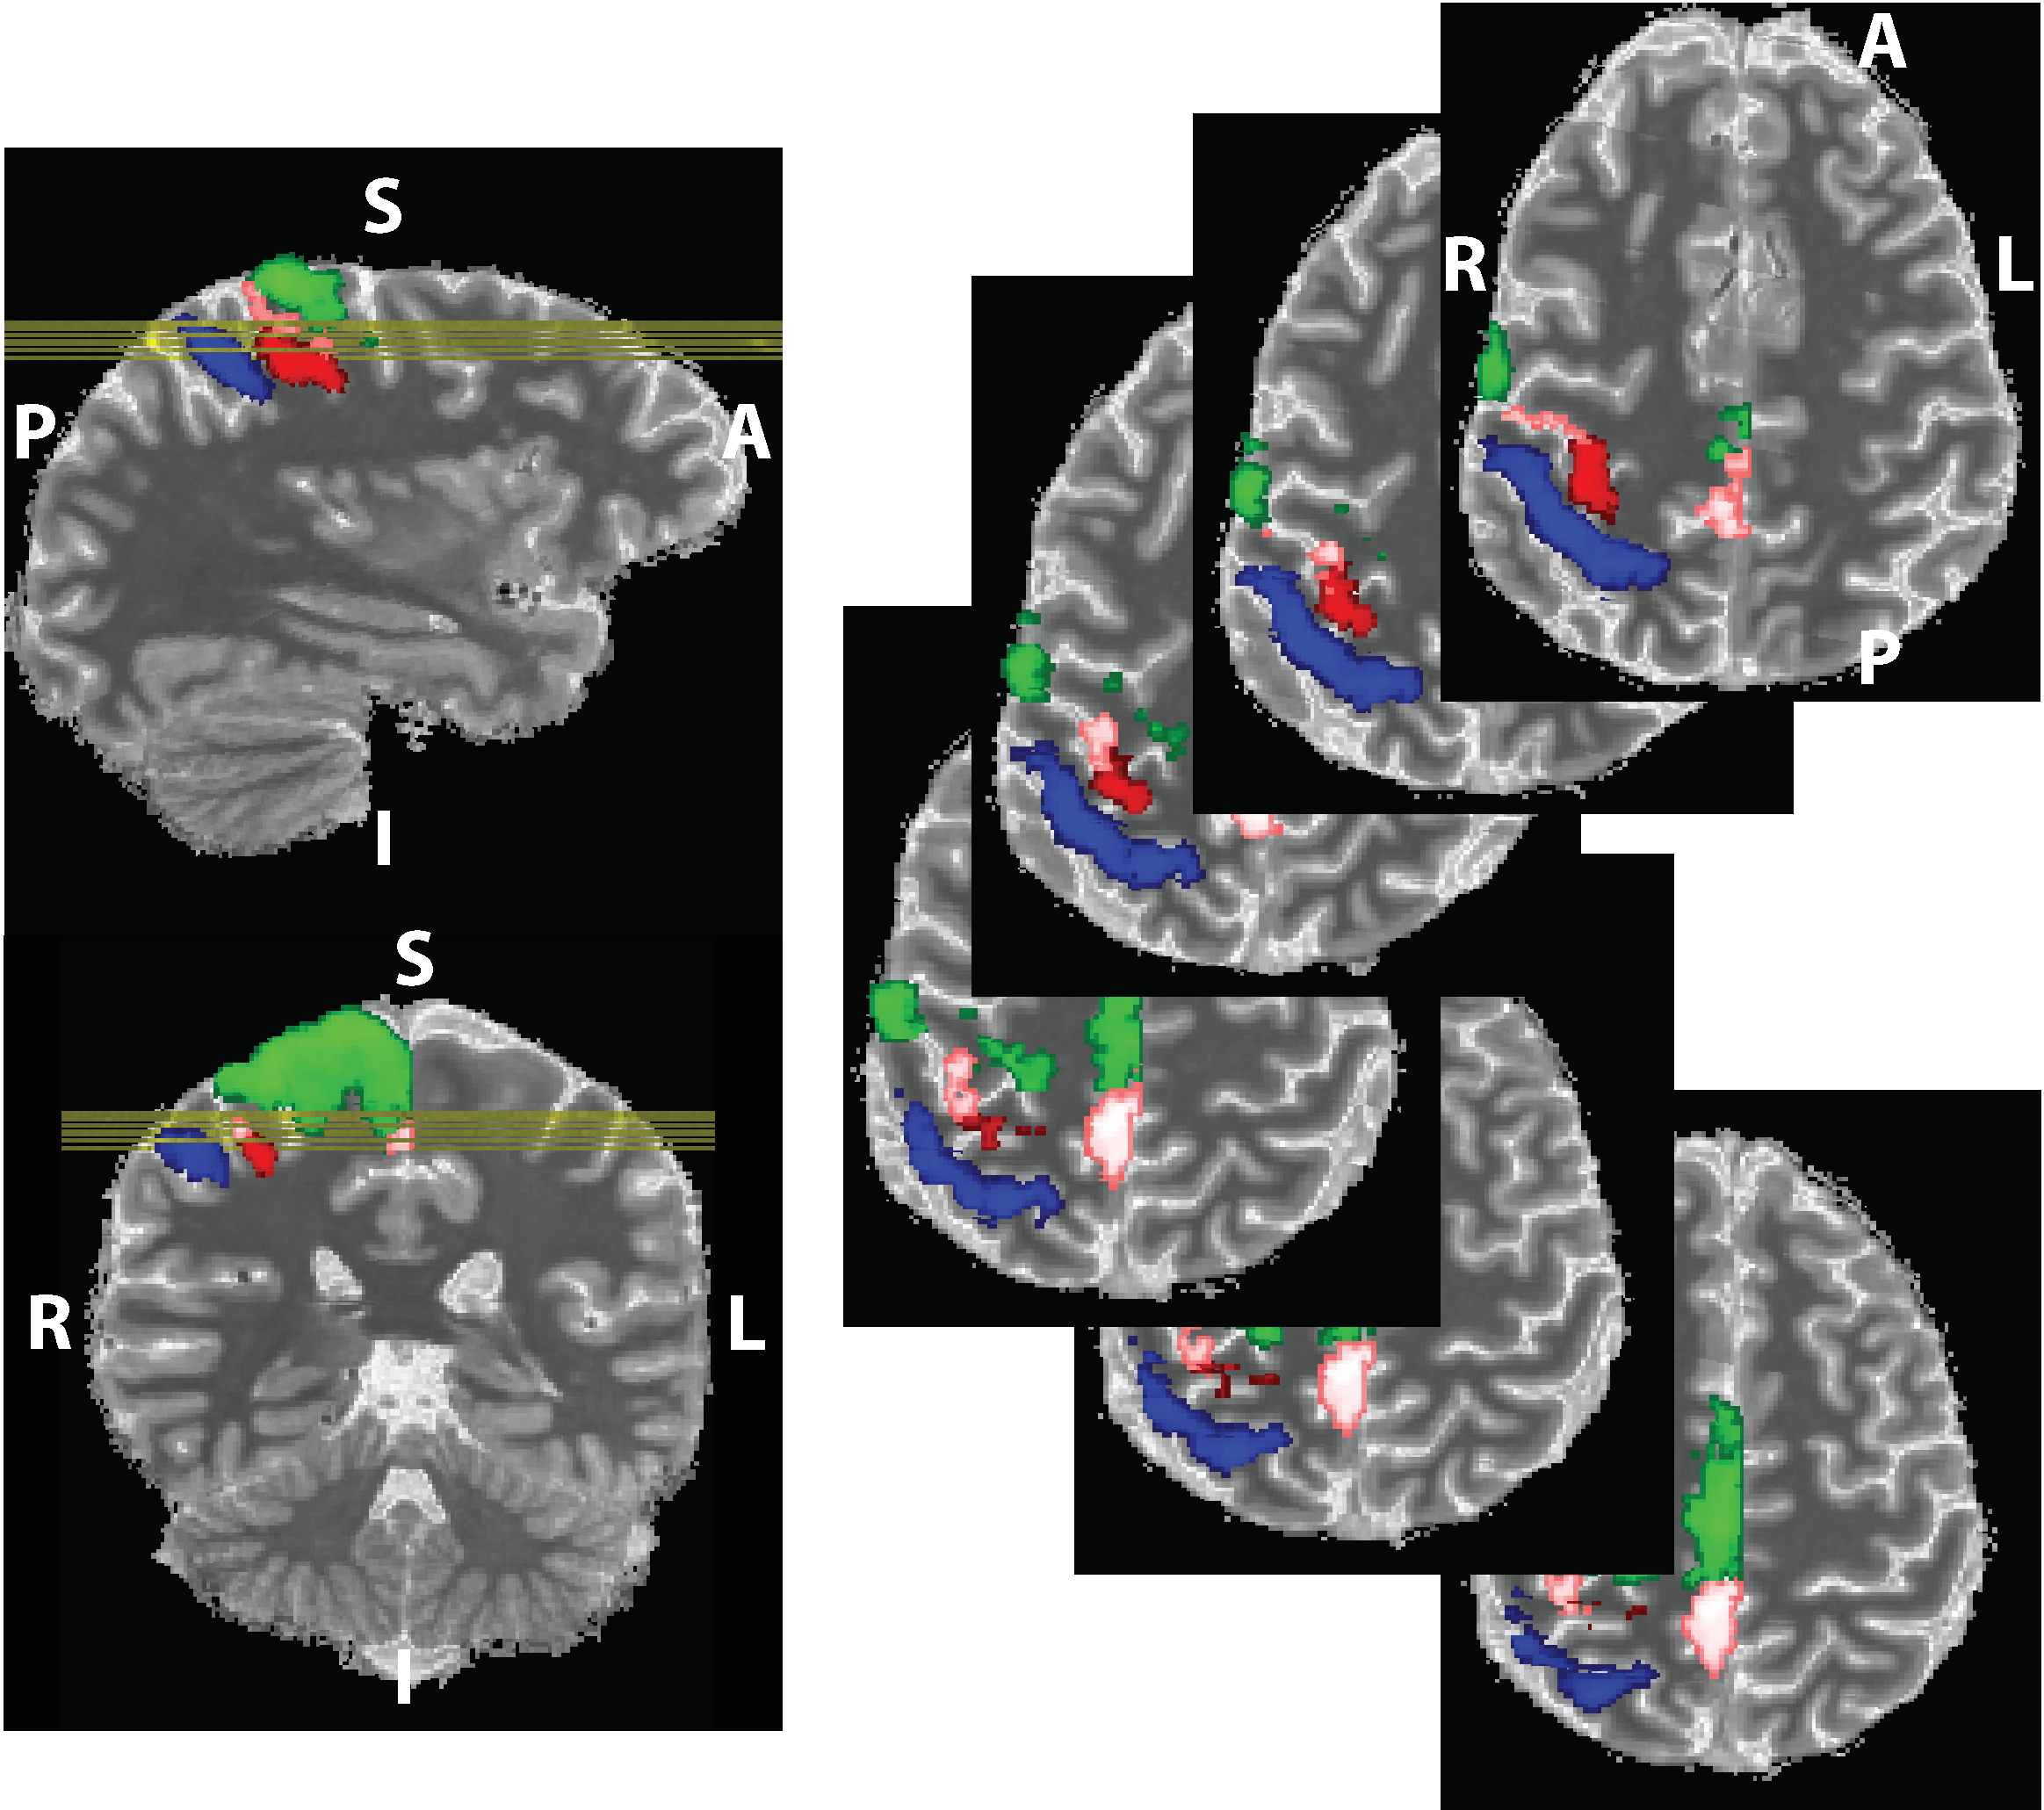
We propose a novel quantitative framework (Figure 1) that exploits the potential of MRF6 to generate unique signal evolutions from tissues with different properties. As opposed to the original MRF study which targeted macroscale tissue properties, our focus was on the use of MRF to characterise the microstructure of gray matter. Within our MRF framework, we integrate an approach based on statistical feature-based residual analysis. Six female volunteers participated in an hour-long 7 T MR scan session. Subjects were healthy individuals with no history of neurological disease aged 30 ± 3 years. Each participant underwent three scans for T1 mapping, T2* mapping and MRF. Four cyto-architectonically distinct cortical areas were targeted in our study: Area 2 (primary somatosensory cortex), area 4a (anterior primary motor cortex), area 4p (posterior primary motor cortex) and area 6 (premotor cortex). Binary masks for each area were extracted from the Juelich histological atlas of the human brain,7,8,9 integrated in the FSL brain imaging analysis tool,10 and then applied on the MRF images in MATLAB. Area 4, was defined as a single area by Brodmann, and has a distinctive cytoarchitecture containing giant pyramidal cells. Area 6 lacks a granular structure and is cytoarchitecturally similar area to Area 4.11 On the other hand, Area 2 is dissimilar to Area 4,12 with marked differences in myelinated fibre content.5 We selected regions that ranged in microstructural similarity so as to compare our quantitative similarity measurements with the published literature. For the residual analysis, MRF signal simulations were performed using the Bloch equations, where the macro-level tissue properties (i.e. T1 and T2*) were derived from well-established 3D sequences, yielding images with 1mm isotropic voxels and whole brain coverage: MP2RAGE (Magnetization Prepared 2 Rapid Acquisition Gradient Echoes)13 for T1 mapping and ME-GRE (Multi-Echo Gradient Echo) for T2* mapping. Due to acquisition time limitations, the MRF acquisition was a 2D MRF-EPI sequence (Figure 2), developed in-house, which yielded six 2D slices (matrix size of 200×200, resolution of 1mm isotropic, 1000 MRF frames, TR=80-90ms, FA=0-80°, RF pulse phase alters 180° every second frame) covering the target regions (Figure 3). Each MRF slice was acquired three times to increase the signal-to-noise ratio. To quantitatively investigate how well the residuals of the MRF signal from each cortical areas (after accounting for T1 and T2*) could be separated, we used autocorrelation as a signal characterisation measure. We sought to identify periodic patterns in the residuals and to evaluate whether the residuals purely reflected noise. We then used mean squared error as a quantitative distance measure between the residuals.RESULTS AND DISCUSSION
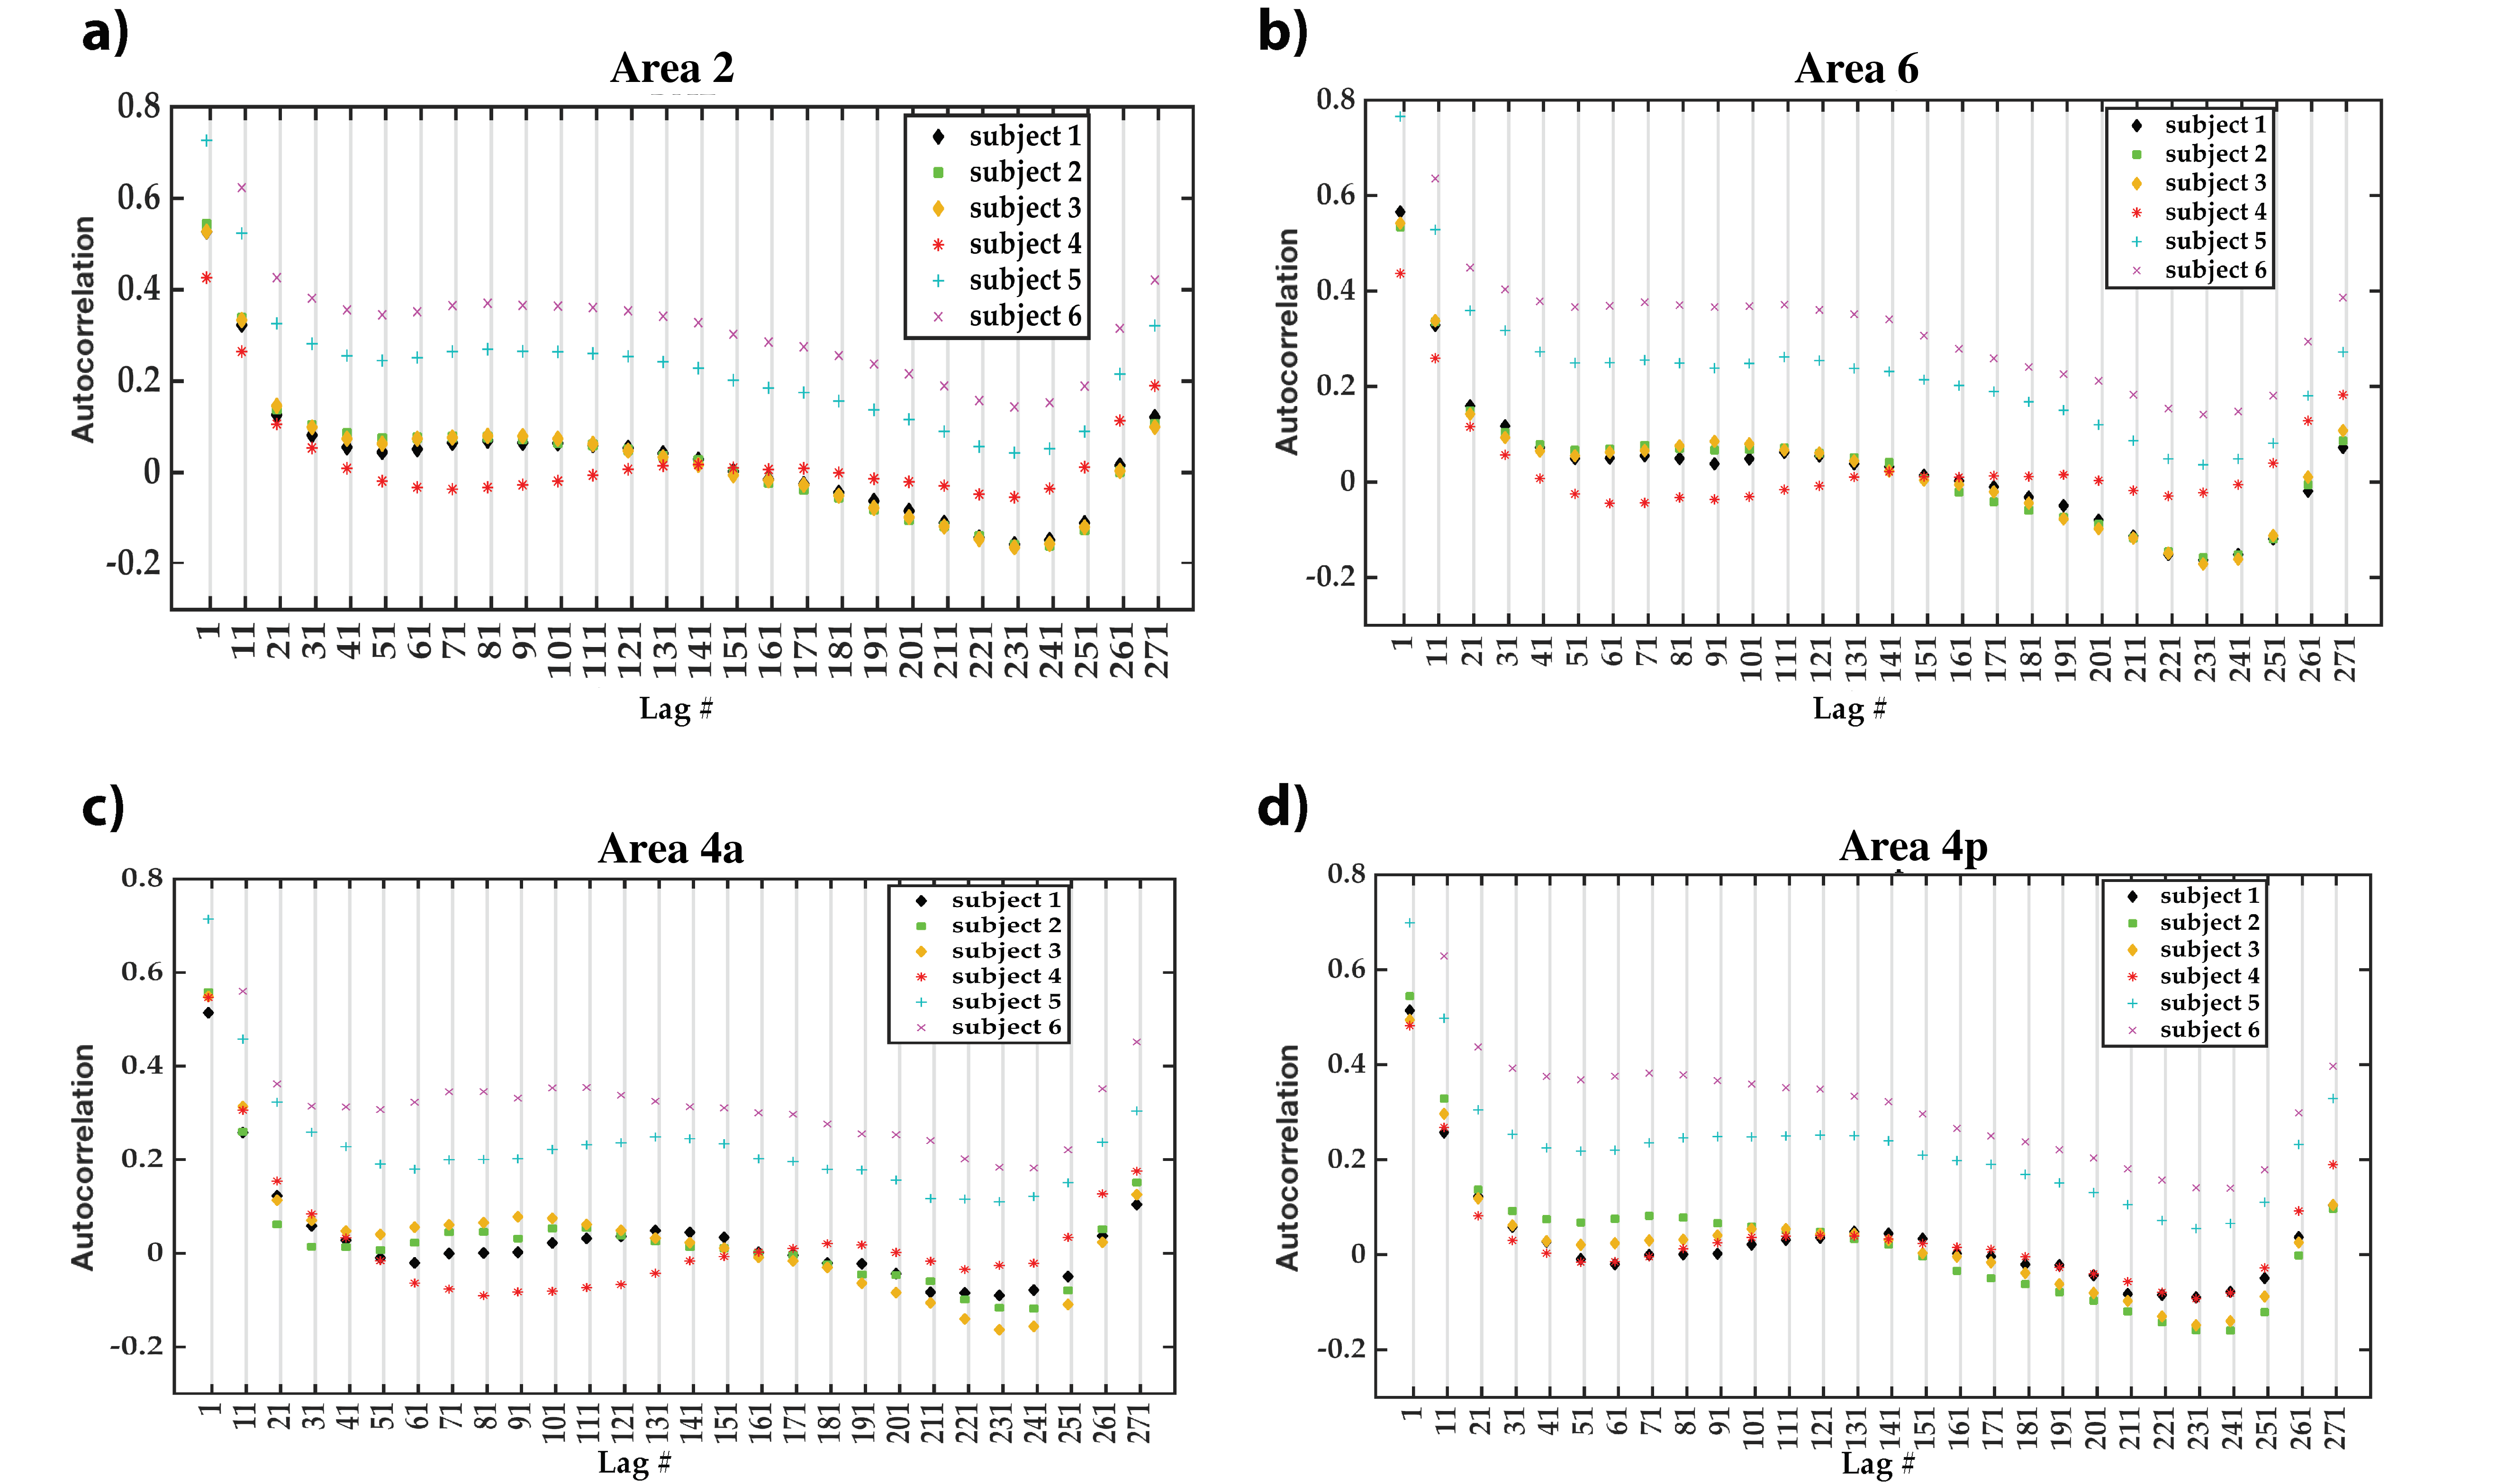
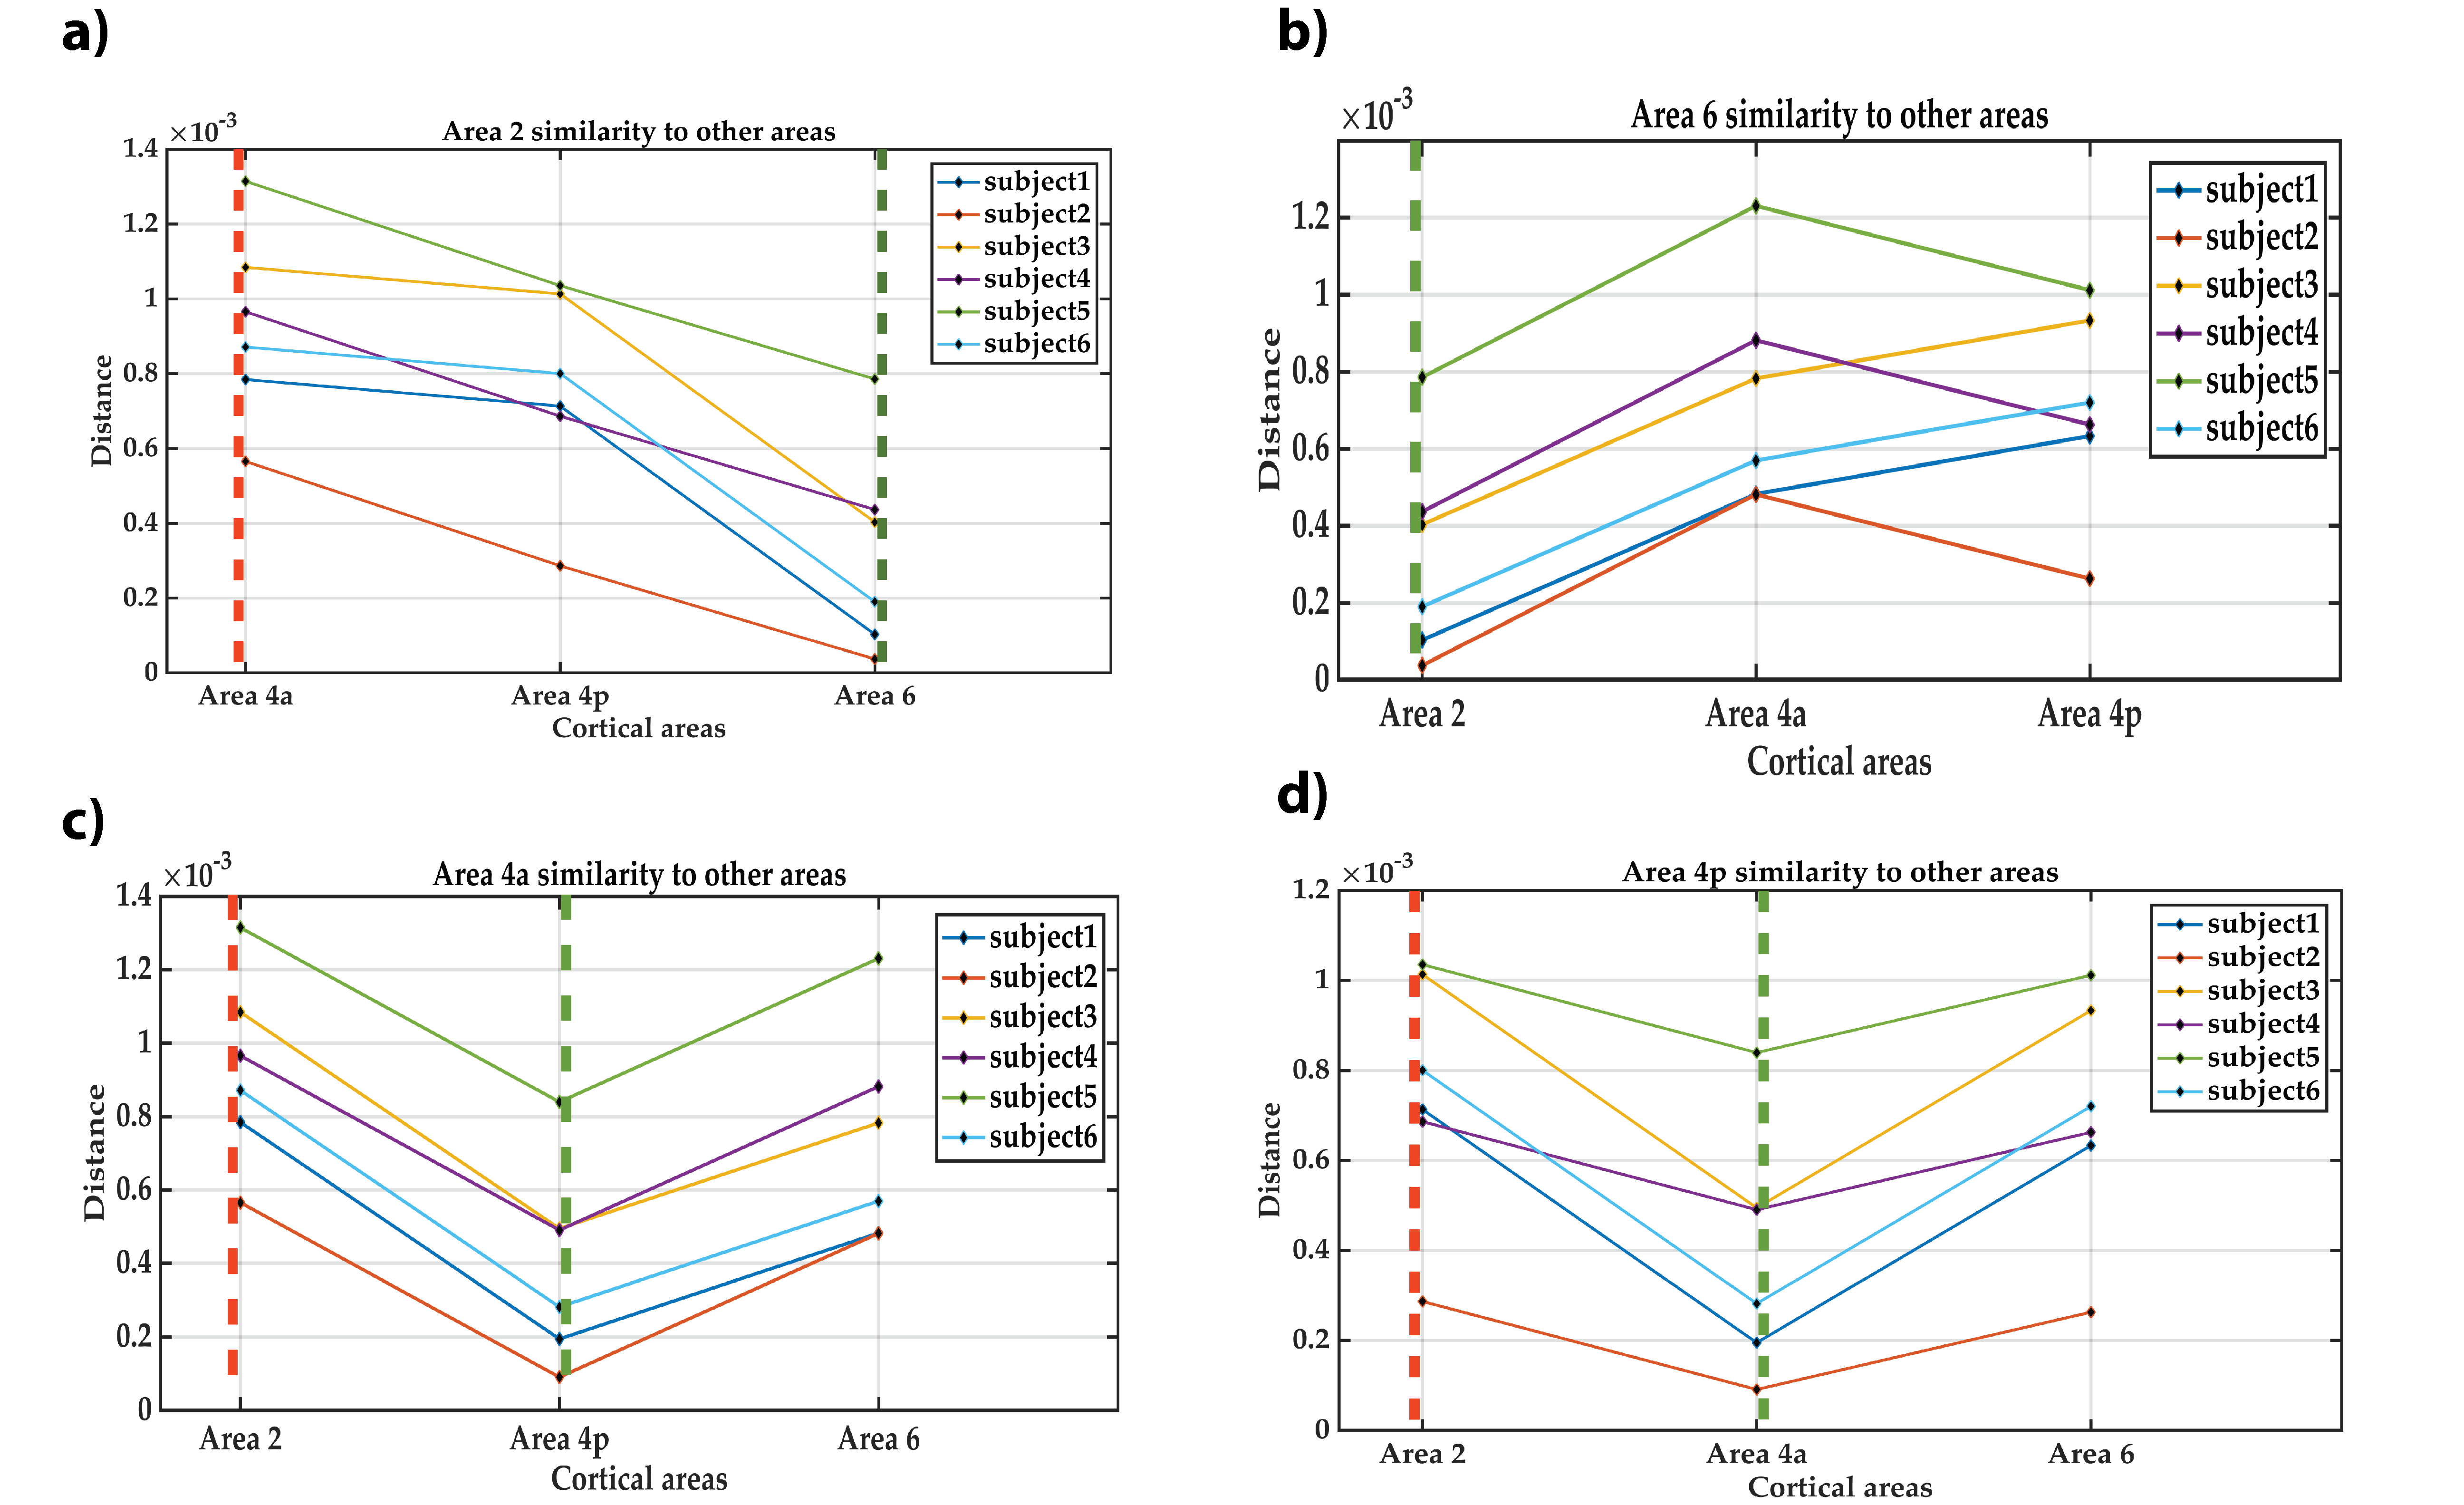
Autocorrelation of the residuals from the four cortical areas showed similar changes as a function of the lag number in the six participants. Many autocorrelation values fell outside the confidence intervals for white Gaussian noise autocorrelation (Figure 4). Thus, we infer that MRF signal residuals did not result solely from measurement noise and potentially contained micro-level information about the cerebral cortex. Quantitative similarity measurements between the residuals of the target areas (Figure 5) showed that the most similar and the most dissimilar areas to each target area were consistent between subjects and also consistent with prior cytoarchitectural knowledge. The only exception was with the most dissimilar area to Area 6, which was either Area 4a or Area 4p. Thus, consistency could still be inferred in that case, as Area 4a and Area 4p are microstructurally very similar to each other. Our findings suggest that the proposed framework has the potential to provide a quantitative method to distinguish between micro-architectonically different areas in the individual brain.CONCLUSION
We conclude that MRF signals reflect influences from the microstructural properties of the cerebral cortex. A statistical feature-based framework distinguished area-specific patterns in the residual between measured and simulated MRF signals in four cortical areas of the human brain. This microanatomical mapping framework takes into account effects of the ensemble of microscale properties whereas previous approaches mostly have focussed on one or two micro-level features. The framework may have potential for automated voxel-wise microanatomical parcellation of the entire cerebral cortex.Acknowledgements
The authors acknowledge the funding received from ARC Discovery Project Grant (DP140103593) in support of this project. We also thank Kieran O’Brien from Siemens Healthcare Australia for helping with the MR Fingerprinting sequence development.References
1. Kassubek J, Huppertz HJ, Spreer J, Schulze-Bonhage A. Detection and Localization of Focal Cortical Dysplasia by Voxel-based 3-D MRI Analysis. Epilepsia. 2002;43(6):596-602.
2. Brodmann K. Vergleichende Lokalisationslehre der Großhirnrinde in ihren Prinzipien dargestellt auf Grund des Zellenbaues: Barth; 1909.
3. Vogt O. Die myeloarchitektonische Felderung des menschlichen Stirnhirns. Journal für Psychologie und Neurologie. 1910;15(4/5):221-232.
4. Glasser MF, Van Essen DC. Mapping human cortical areas in vivo based on myelin content as revealed by T1-and T2-weighted MRI. The Journal of Neuroscience. 2011;31(32):11597-11616.
5. Cohen-Adad J, Polimeni JR, Helmer KG, et al. T2* mapping and B0 orientation-dependence at 7T reveal cyto-and myeloarchitecture organization of the human cortex. Neuroimage. 2012;60(2):1006-1014.
6. Ma D, Gulani V, Seiberlich N, et al. Magnetic resonance fingerprinting. Nature. 2013;495(7440):187-192.
7. Grefkes C, Geyer S, Schormann T, Roland P, Zilles K. Human somatosensory area 2: observer-independent cytoarchitectonic mapping, interindividual variability, and population map. Neuroimage. 2001;14(3):617-631.
8. Geyer S, Ledberg A, Schleicher A, et al. Two different areas within the primary motor cortex of man. Nature. 1996;382(6594):805-807.
9. Geyer S. The microstructural border between the motor and the cognitive domain in the human cerebral cortex. Vol 174: Springer Science & Business Media; 2012.
10. Smith SM, Jenkinson M, Woolrich MW, et al. Advances in functional and structural MR image analysis and implementation as FSL. Neuroimage. 2004;23:S208-S219.
11. Garey LJ. Brodmann's ‘localisation in the cerebral cortex’: World Scientific; 1994.
12. Geyer S, Schleicher A, Zilles K. Areas 3a, 3b, and 1 of human primary somatosensory cortex: 1. Microstructural organization and interindividual variability. Neuroimage. 1999;10(1):63-83.
13. Marques JP, Kober T, Krueger G, van der Zwaag W, Van de Moortele PF, Gruetter R. MP2RAGE, a self bias-field corrected sequence for improved segmentation and T 1-mapping at high field. Neuroimage. 2010;49(2):1271-1281.
Figures