4255
Prostate cancer tissue characterization with spatio-temporal analysis of Magnetic Resonance Fingerprinting data1Radiology, Case Western Reserve University, Cleveland, OH, United States, 2Radiology, University Hospitals, Cleveland, OH, United States
Synopsis
Multiple tissue properties (T1, T2, diffusion, etc.) and system parameters can be acquired simultaneously with Magnetic Resonance Fingerprinting (MRF). The dictionary formation and matching steps may be confounded by the lack of certain tissue properties (e.g. magnetization exchange) in the dictionary and thus, the differentiation of tissues of interest may be suboptimal even though variable MRF signal evolutions set them apart. Here, as a dictionary-free alternative, spatio-temporal analysis of MRF time series is proposed for tissue characterization. Independent Component Analysis (ICA) based correlation analysis of prostate MRF data can distinguish between healthy and cancer tissue without explicit dictionary matching.
Introduction
Magnetic Resonance Fingerprinting1 (MRF) is a recent technique tailored for simultaneous mapping of multiple tissue properties and system parameters. While this method has been shown to be an efficient way to collect multiparametric data, the dictionary and the matching process may not capture all of the underlying tissue structure (due to e.g. partial volume and magnetization exchange). Here we take inspiration from resting state fMRI and propose a model-free time course analysis approach that does not rely on the accuracy of the matching process or selected range for possible tissue properties as it is independent of a simulated dictionary.
In the proposed approach, as long as tissue time courses are sensitized to underlying tissue properties of interest, tissues showing differences in these properties will be separated based on their time courses regardless of accurate knowledge of factors affecting MRF signal evolutions. Here, we apply this approach to prostate cancer tissue characterization with Independent Component Analysis (ICA) and show that we can differentiate cancer from normal tissue as well as partially separate cancer based on grade.
Methods
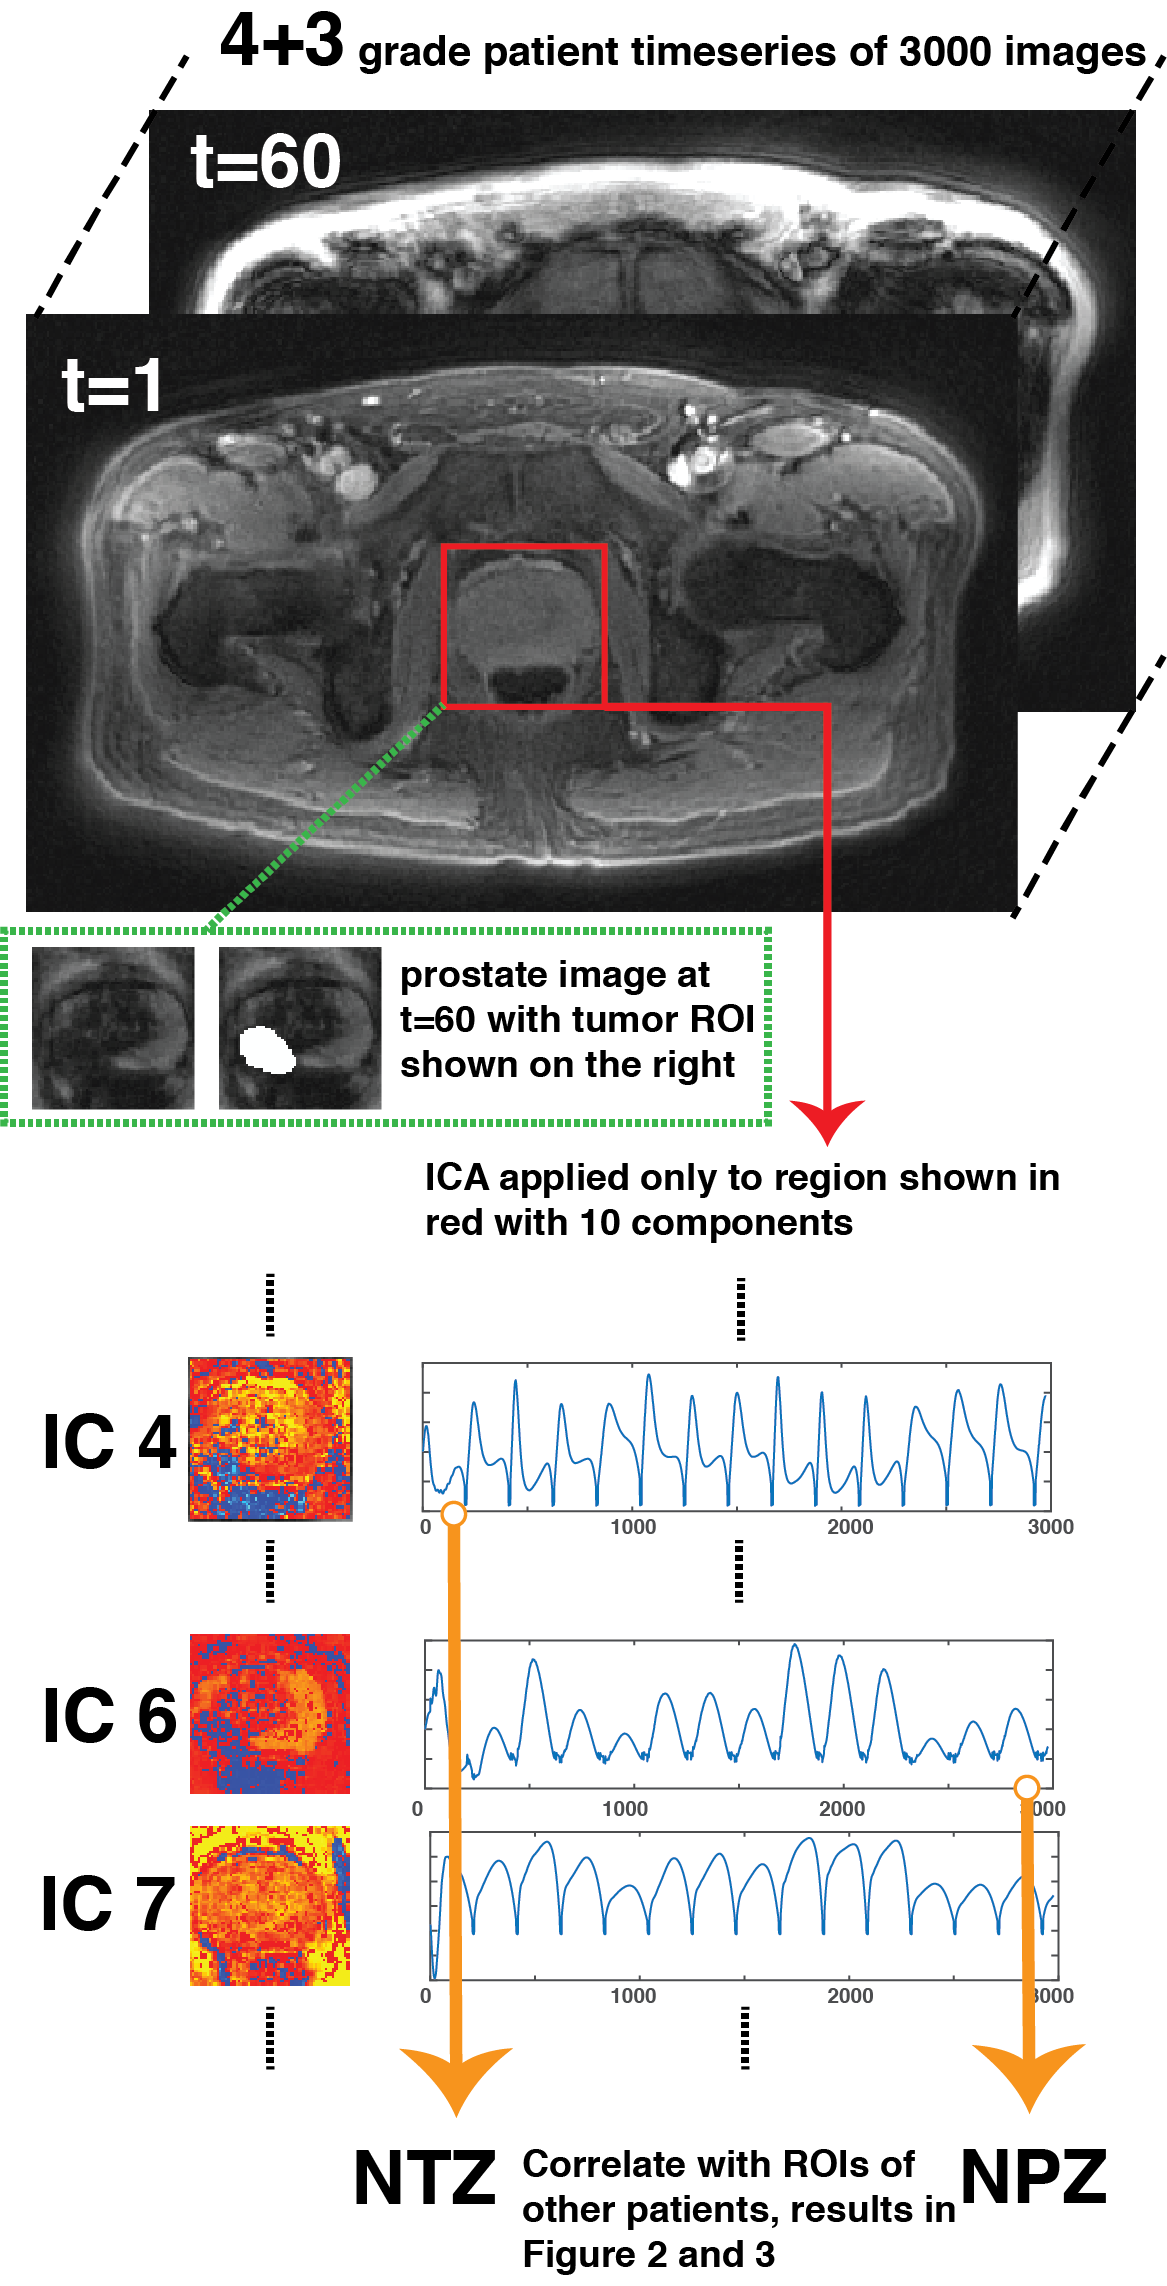
All patient data were acquired under an IRB approved study after prior written consent. Data were acquired using a FISP based MRF acquisition2 at 3T scanner (Skyra and Verio, Siemens) using a body coil with the following parameters; FA: 5°-75°, 1x1x5 mm3 resolution, TR: 12-14 ms, 3000 time points3. It was found experimentally that the cyclic aliasing artifacts account for a significant part of the variance of MRF data. Therefore, in order to focus only on the important tissue differences, MRF data was first reconstructed with a low rank method4 to remove structured signal changes in time due to undersampling artifacts. ICA5 was applied to a dataset with 10 independent components (ICs), diagnosed with Gleason grade 4+3 after masking for a partial FOV including prostate. Two ICs labeled as Normal Transition Zone (NTZ) and Normal Peripheral Zone (NPZ) were selected for further analysis. These “master” NPZ and NTZ IC time courses were correlated with manually drawn lesion and NPZ ROI time courses from other 20 patient datasets (all Gleason grade: five 3+3, five 3+4, five 4+3, three 4+4 and two 4+5). It is hypothesized that when correlated with NPZ and NTZ IC time courses, cancer and NPZ ROIs may be distributed differently in the NPZ vs. NTZ space and the distribution may also vary depending upon the grade of cancer. Figure 1 illustrates the analysis pipeline with additional information.Results
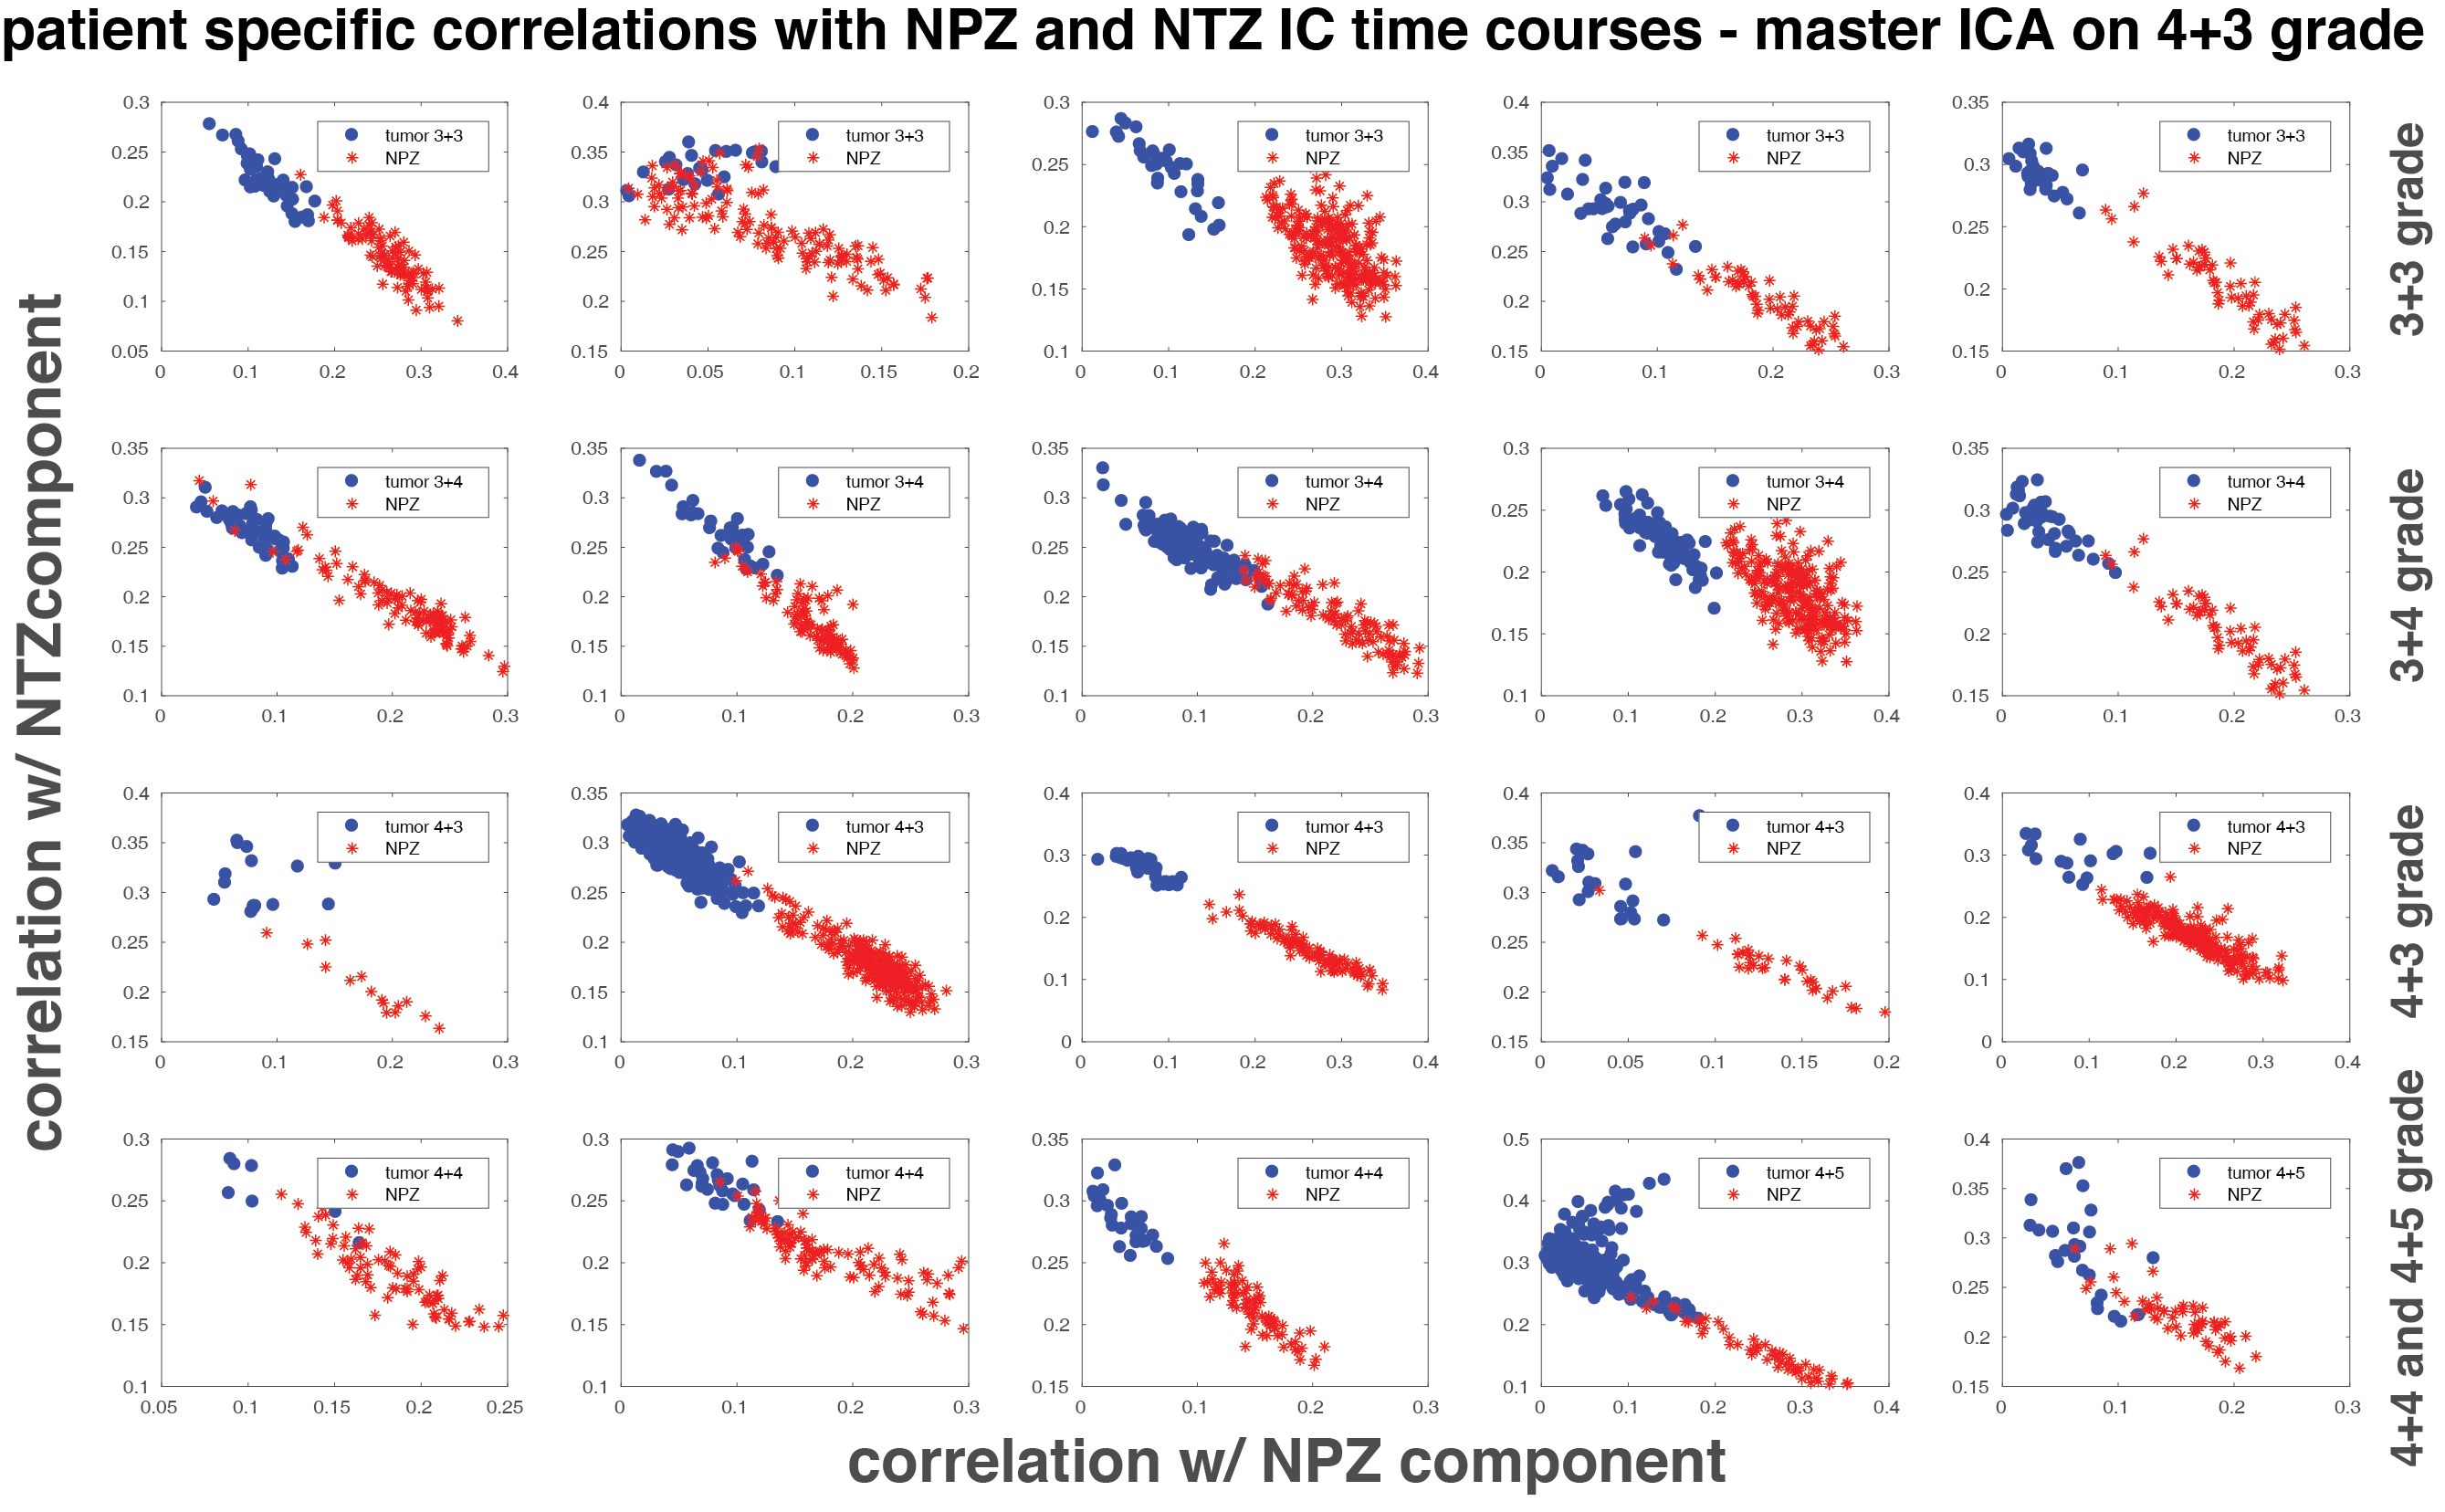
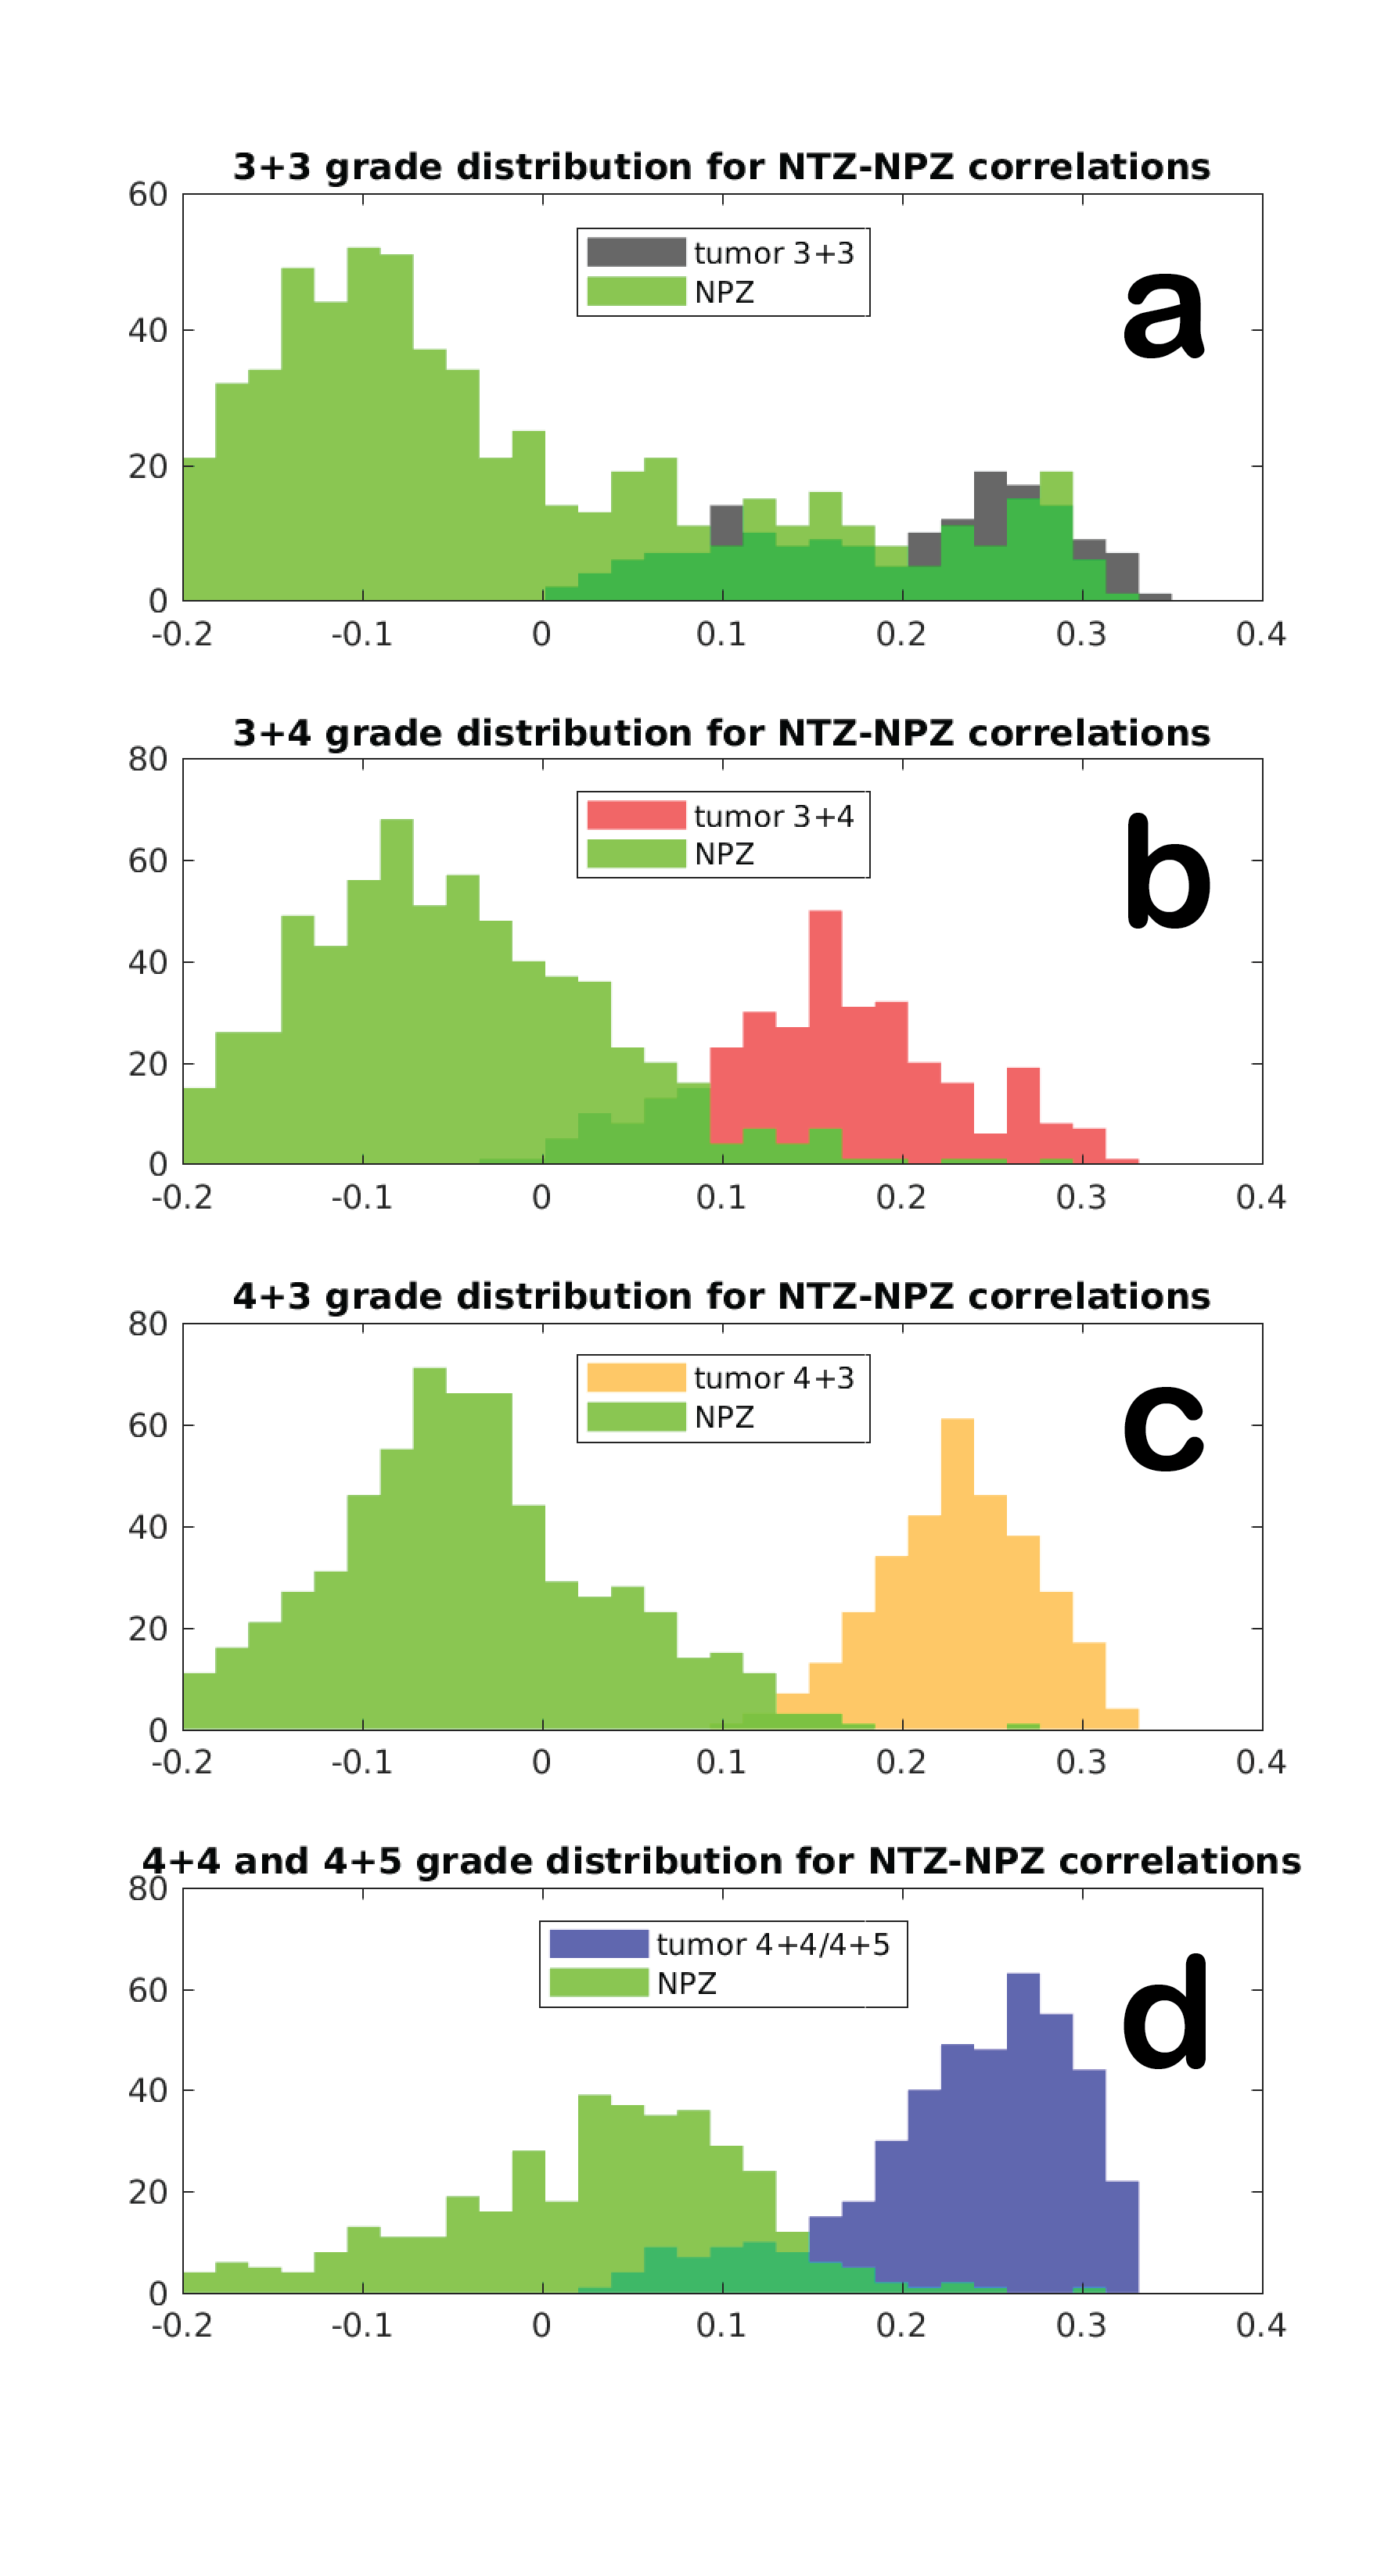
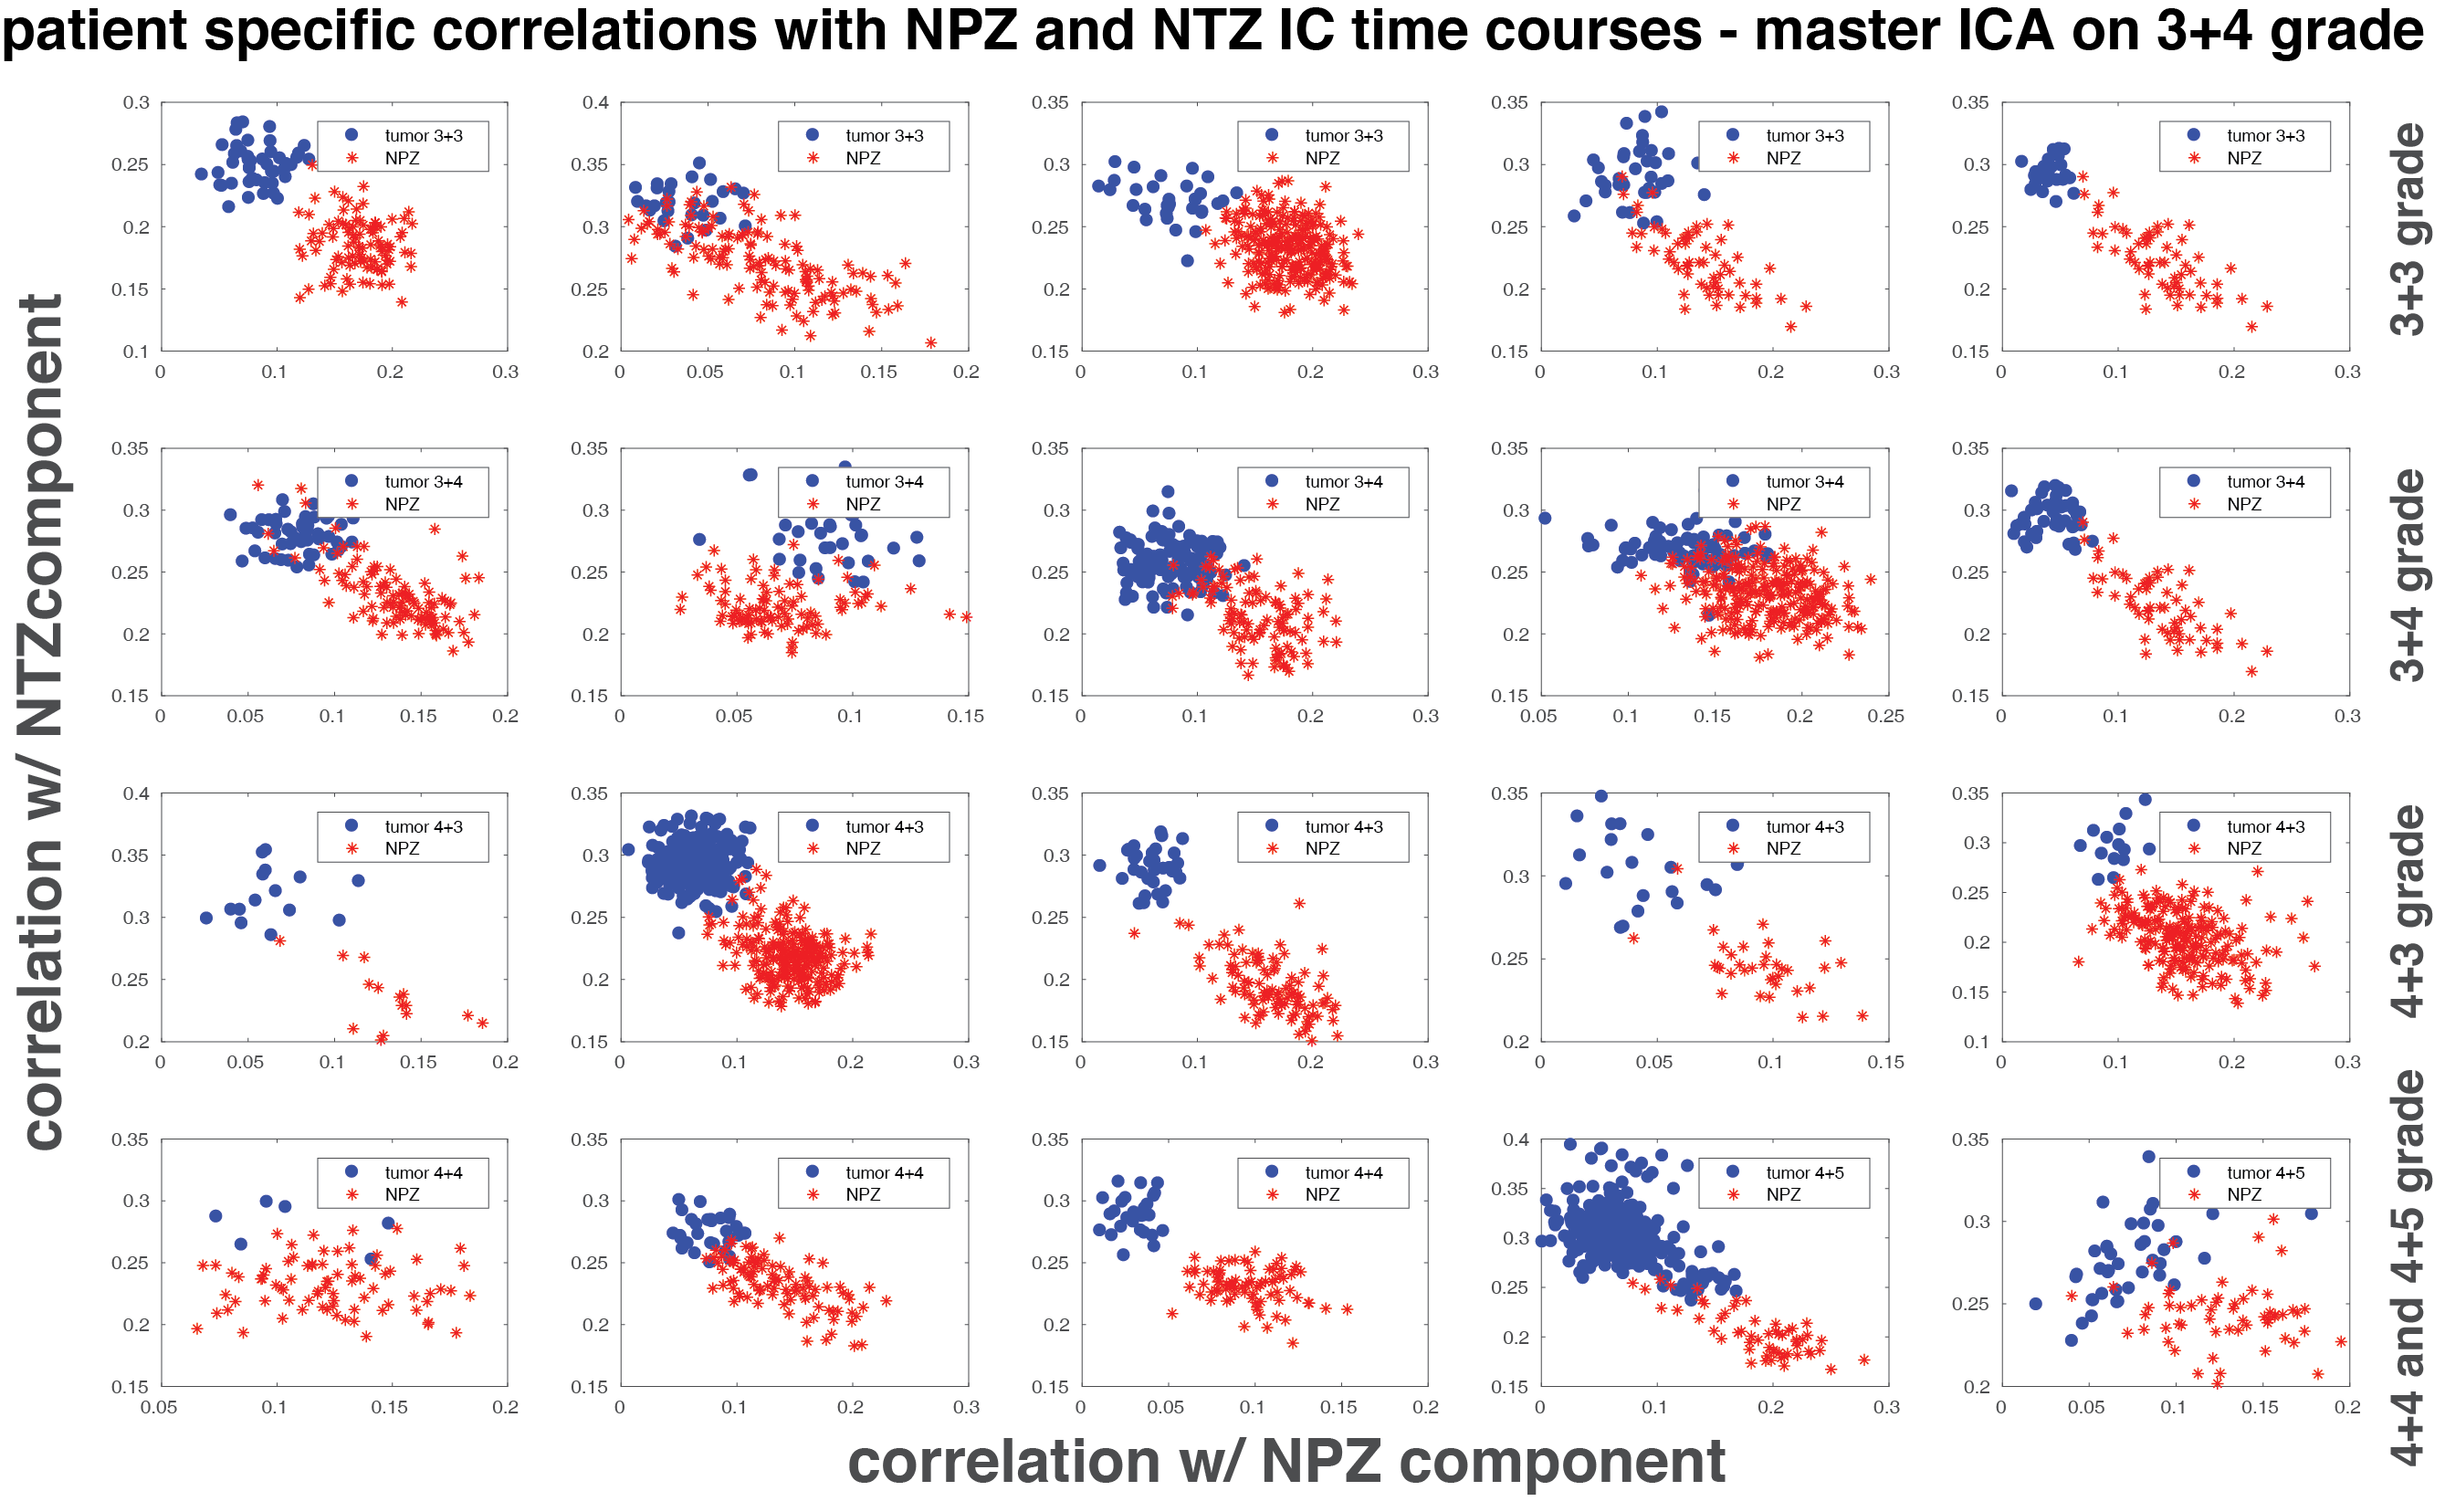
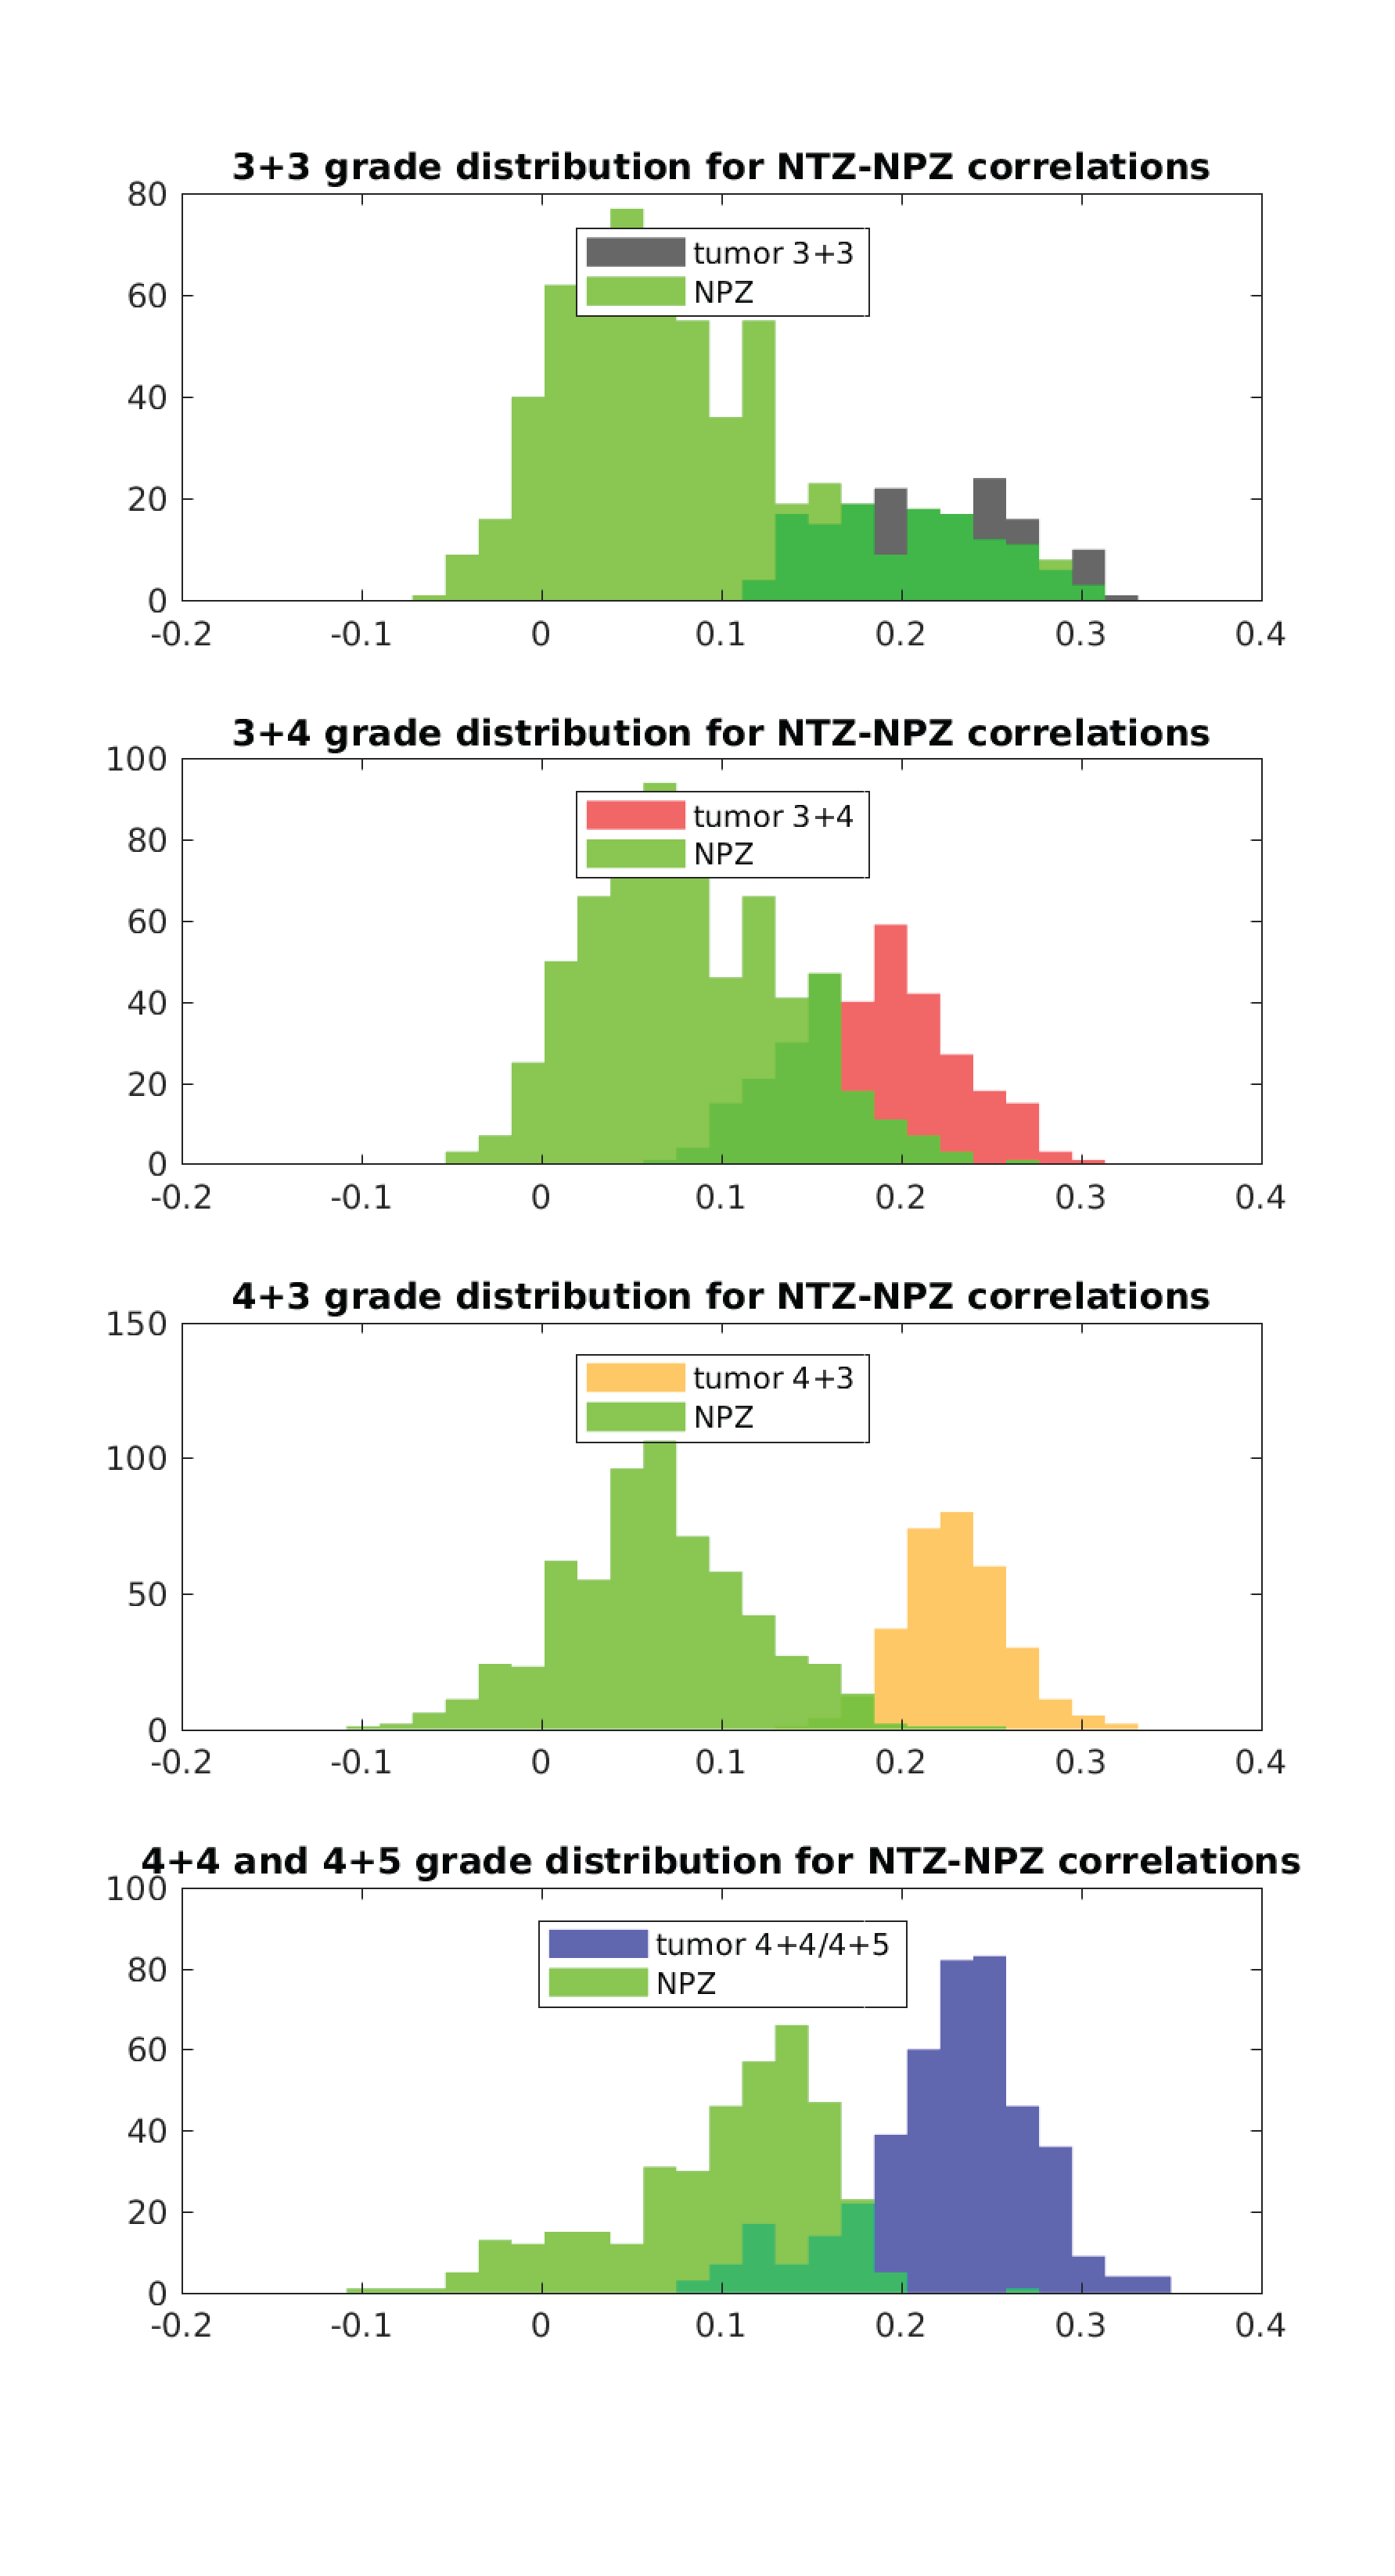
Figure 2 plots the correlation of all patients’ lesion and NPZ ROI voxels with NPZ and NTZ ICs. The shape of distribution in NTZ/NPZ space suggests that the chosen ICs are orthogonal to each other up to some degree as for the majority of the voxels a high correlation value with one IC dictates a low value with the other IC. On a patient level, the two types of tissue ROIs are easily distinguishable. When the difference of NTZ and NPZ correlation values is taken as a single metric for all voxels and plotted in histograms per grade in Figure 3, it can be observed that with the exception of 3+3 grade patients a cutoff point can be chosen for the characterization of healthy vs cancer tissue. Small differences between grades are also noteworthy. The same analysis was carried out with master ICA from a 3+4 patient for which similar results are obtained (Figure 4&5).Discussion
Here it is shown that MRF time courses can be useful for differentiating prostate tissue and possibly types of tumors without using an explicit dictionary match. Based on correlations with ICs obtained from ICA, lesion and NPZ ROIs are distributed differently in NPZ/NTZ space. The similar results between Figure 2 and 4, and Figure 3 and 5 obtained for two different sources of ICs (a 4+3 and a 3+4 patient) speak for the repeatability of the proposed approach. It should be noted that NPZ and NTZ ICs from ICA do not fully represent those regions or their mean time courses, but are found in two separate ICAs with similar time courses and maps that mostly overlap with NPZ or NTZ. Future work will concentrate on obtaining region or grade specific time courses and other metrics for the characterization of different grades of cancer.Conclusion
ICA based correlation analysis of MRF prostate data can clearly distinguish between lesion and NPZ ROIs of low and high grade cancer patients. Dictionary- and model-free analysis of MRF data provides new possibilities for MRF framework.Acknowledgements
The authors would like to acknowledge funding from Siemens Healthcare, NIH grants 1R01EB016728, 1R01DK098503, 1R01CA208236, 1R01BB017219.References
1. Ma D, Gulani V, Seiberlich N, et al. Magnetic resonance fingerprinting. Nature 2013;495: 187–192.
2. Jiang Y, Ma D, Seiberlich N, et al. MR Fingerprinting Using Fast Imaging with Steady State Precession (FISP) with Spiral Readout. Magn Reson Med 2015;74:1621-1631.
3. Yu A, Badve C, Ponsky L, et al. Development of a combined MR Fingerprinting and Diffusion examination for Prostate cancer. Radiology 2017;283(3):729-738.
4. Pierre E, Griswold M, Connelly A. Fast Analytical Solution for Extreme Unaliasing of MR Fingerprinting Image Series. ISMRM Proceedings 2017; p1353.
5. Melodic, FSL, https://fsl.fmrib.ox.ac.uk/fsl/fslwiki/MELODIC.
Figures